
Improving Vulnerability Prediction of JavaScript Functions using
Process Metrics
Tam
´
as Viszkok
1 a
, P
´
eter Heged
˝
us
1,2 b
and Rudolf Ferenc
1,3 c
1
Department of Software Engineering, University of Szeged, Dugonics t
´
er 13, Szeged, Hungary
2
MTA-SZTE Research Group on Artificial Intelligence, ELKH, Tisza Lajos krt. 103, Szeged, Hungary
3
FrontEndART Ltd., Somogyi utca 19., Szeged, Hungary
Keywords:
Vulnerability Prediction, Static Source Code Metrics, Process Metrics, JavaScript Security.
Abstract:
Due to the growing number of cyber attacks against computer systems, we need to pay special attention to
the security of our software systems. In order to maximize the effectiveness, excluding the human component
from this process would be a huge breakthrough. The first step towards this is to automatically recognize the
vulnerable parts in our code. Researchers put a lot of effort into creating machine learning models that could
determine if a given piece of code, or to be more precise, a selected function, contains any vulnerabilities or
not. We aim at improving the existing models, building on previous results in predicting vulnerabilities at the
level of functions in JavaScript code using the well-known static source code metrics. In this work, we propose
to include several so-called process metrics (e.g., code churn, number of developers modifying a file, or the
age of the changed source code) into the set of features, and examine how they affect the performance of the
function-level JavaScript vulnerability prediction models. We can confirm that process metrics significantly
improve the prediction power of such models. On average, we observed a 8.4% improvement in terms of
F-measure (from 0.764 to 0.848), 3.5% improvement in terms of precision (from 0.953 to 0.988) and a 6.3%
improvement in terms of recall (from 0.697 to 0.760).
1 INTRODUCTION
Nowadays, thanks to the advances in technology, soft-
ware is no longer only available in the traditional
computing environments. It is in our pockets on
smart-phones, in the kitchen in our refrigerators, and
it is even there in the smart-watches worn on our
wrists. As these devices become an integral part of
our daily lives, our vulnerability to cyber-crimes is
growing fast. Therefore, the need to create secure
software and detect software vulnerabilities as effec-
tively as possible is growing rapidly as well.
Nevertheless, in many cases, companies do not de-
vote sufficient resources to detect such vulnerabilities
due to tight deadlines, or may even completely ne-
glect and entrust this task to developers. But even
for companies that employ a dedicated security pro-
fessional to make sure that their software is protected
against cyber-crimes, the human factor can still cause
a
https://orcid.org/0000-0002-6049-786X
b
https://orcid.org/0000-0003-4592-6504
c
https://orcid.org/0000-0001-8897-7403
a problem. The introduction of an automated method
would help to solve this issue. Moreover, the sooner
a software vulnerability is detected, the greater the
amount of the saved resources that would otherwise
be wasted. Perhaps more importantly, the release of a
software that contains vulnerabilities can significantly
damage the reputation of developers, but even more
so that of the company. In addition, such cases could
even lead to lengthy lawsuits, which we ideally want
to avoid. Therefore, it would be invaluable if a tool
could detect whether a particular piece of code con-
tains any possible vulnerabilities before they are re-
leased into production.
Fortunately, we are living in the heyday of arti-
ficial intelligence. The high-computational capacity
needed to train learning algorithms is becoming more
and more affordable, and the vast amount of data
available to anyone on the Internet provides the per-
fect opportunity for algorithms requiring larger train-
ing datasets. We can also take advantage of the ca-
pabilities of machine learning in the field of cyber-
security. Most of the existing error detection models
focus mainly on predicting software defects in gen-
Viszkok, T., Heged˝us, P. and Ferenc, R.
Improving Vulnerability Prediction of JavaScript Functions using Process Metrics.
DOI: 10.5220/0010558501850195
In Proceedings of the 16th International Conference on Software Technologies (ICSOFT 2021), pages 185-195
ISBN: 978-989-758-523-4
Copyright
c
2021 by SCITEPRESS – Science and Technology Publications, Lda. All rights reserved
185

eral. However, in many cases, vulnerabilities can-
not be considered as a defect in the traditional sense,
so these methods cannot be applied with sufficient
effectiveness against vulnerabilities without adjust-
ment (Camilo et al., 2015; Krsul, 2011; Zimmermann
et al., 2010; Shin and Williams, 2011).
Our goal is to create an AI driven, precise, predic-
tion model that works at a fine-grained level, namely
to detect whether a given function of a JavaScript
software contains any vulnerabilities or not. The ap-
proach we take is to train a new, specialized model on
a carefully assembled dataset, which contains vulner-
able program samples (i.e., code that has been later
fixed for a vulnerability) for training models. As
a starting point for our studies, we selected an al-
ready existing vulnerability dataset published by Fer-
enc et al. (Ferenc et al., 2019) that contains 12,125
JavaScript functions with class labels if they are vul-
nerable or not. This dataset contains 42 static source
code metrics as features. Although their initial re-
sults were already promising, due to the very dy-
namic properties of JavaScript we hypothesized that
improvements could be made by extending the set of
features for the prediction.
Given that general prediction models leveraged a
lot from the addition of so-called process metrics (Ju-
reczko and Madeyski, 2011; Rahman and Devanbu,
2013; Mnkandla and Mpofu, 2016; Stani
´
c and Afzal,
2017) as features, we decided to augment the exist-
ing dataset (Ferenc et al., 2019) with process metrics,
and evaluate how this affects the performance of vul-
nerability prediction models. Process metrics, such as
Number of Modifications, Age or Number of Contrib-
utors provide an additional aspect of the source code
compared to its structural static code metrics. For ex-
ample, if a program element was modified many times
in the past that might suggest some inherent problems
with the code. Whether being hard to change, error-
prone, or simply too coupled with other components,
all these properties make it suspicious from a secu-
rity point of view. After a refactoring of such code,
it may be less likely to remain vulnerable. The refac-
toring also resets the aforementioned process metrics,
so our hypothesis is that they would properly capture
properties of code that help predict their vulnerability.
To summarize our research goals, we formalized
the following two research questions:
RQ1: Can process metrics as features improve
existing JavaScript vulnerability prediction models
based only on static source code metrics?
RQ2: If process metrics do improve the perfor-
mance of vulnerability prediction models, how signif-
icant it is in terms of precision, recall, and F-measure?
By adding 19 process metrics to the set of features
and re-training the prediction models we found that a
significant increase could be achieved in model per-
formances. On average, we observed a 8.4% improve-
ment in terms of F-measure (from 0.764 to 0.848),
3.5% improvement in terms of precision (from 0.953
to 0.988) and a 6.3% improvement in terms of recall
(from 0.697 to 0.760).
The rest of the paper is organized as follows. In
Section 2, we present the works related to our topic
of research. We give an overview of our applied
methodology and process metric calculation in Sec-
tion 3. The results of the new, extended vulnerability
prediction models are detailed in Section 4, where we
also compare these with the static source code based
predictions. Section 5 enumerates the list of possible
threats, while we conclude the paper in Section 6.
2 RELATED WORK
The viability of error detection using artificial intelli-
gence has already been demonstrated in many previ-
ous works (Delphine Immaculate et al., 2019; Ham-
mouri et al., 2018; Puranik et al., 2016; Kaur and
Chopra, 2016; T
´
oth et al., 2016; Melo et al., 2019).
However, these solutions are used to predict any kinds
of errors that may prevent the program from func-
tioning properly, and not only vulnerabilities. But, in
many cases, vulnerabilities do not fall into this gen-
eralized “bug” category. This is why we decided to
train a new model specifically designed for detecting
vulnerabilities instead of using existing fault detec-
tion models. Our approach of dedicated vulnerability
models is shared by many researchers, as we can find
a great number of specialized vulnerability prediction
models in the literature. Existing solutions can be di-
vided into three main groups based on their training
data: software metrics, text mining, and crash dump
stack traces based methods.
The closest to our work is obviously that of Ferenc
et al. (Ferenc et al., 2019), who created a vulnerabil-
ity dataset from 12,125 JavaScript functions mapping
public vulnerability database entries to code. They
calculated static source code metrics for these func-
tions and trained different machine learning models
to predict vulnerable functions. Our work is heavily
related to theirs as we reused their published dataset.
However, instead of just using static source code met-
rics, we augmented the data with process metrics
mined from the version control history of the projects
and revisited ML model performances.
In the work by Shin et al. (Shin et al., 2011),
the researchers performed two empirical case stud-
ies on two large, widely used open-source projects:
ICSOFT 2021 - 16th International Conference on Software Technologies
186

the Mozilla Firefox web browser and the Red Hat En-
terprise Linux kernel. They have used three types of
software metrics as prediction features: Code Com-
plexity, Code Churn, and Developer Activity. Code
Complexity belongs to the static source code met-
rics (included in the metrics we use in this paper as
well), Code Churn metrics are types of process met-
rics, while Developer Activity features describe the
relationship between each developer and the project,
like the CNCloseness feature, which has high value
if a file was modified by developers who are focused
on many other files. They used the tool Understand
C++
1
for extracting static source code metrics. They
trained five different machine learning models: Logis-
tic Regression, Decision Tree, Random Forest, Naive
Bayes, and Bayesian Network. Their best performing
model was Logistic Regression. This method can pre-
dict vulnerabilities in C++ files at file-level, i.e. it can
tell whether a file contains a vulnerability or not.
Zimmermann et al. (Zimmermann et al., 2010)
trained models on five types of software metrics:
Code Complexity, Code Churn, Dependency Mea-
sures, Code coverage Measure, and Organizational
Measures. These metrics were calculated at file level
and also at the level of binaries. They trained Logis-
tic Regression on the file-level code metrics and SVM
on the binary-level dependency measures. In their ex-
periments they observed that classical software mea-
sures predict vulnerabilities with a high precision but
low recall values. The actual dependencies, however,
predict vulnerabilities with a lower precision but sub-
stantially higher recall. We observed similar effect
with process metrics, which primarily improved the
recall values of the prediction models. However, they
did not cause precision values to decrease.
In the work of Scandariato et al. (Scandariato
et al., 2014), the granularity of the created vulnerabil-
ity prediction model is at the file level, and they an-
alyzed Android programs written in Java. They used
20 Android applications to build a training dataset.
Their method is based on a text mining technique,
which starts with tokenizing each Java file into a vec-
tor of terms, and counting the frequency of each term
in the file. Then these values are transformed into
a feature vector. They have initially explored five,
well-known learning techniques: Decision Trees, k-
Nearest Neighbor, Naıve Bayes, Random Forest, and
SVM. In this initial experiment they discovered that
the best results are obtained with Naıve Bayes and
Random Forest, so their work focused on these two
algorithms only.
Theisen et al. applied (Theisen et al., 2015) a
stack trace based method for vulnerability predic-
1
https://www.scitools.com/
tion. They used crash dump stack traces of the Win-
dows 8 operating system. They parsed the stack
traces and their components into a graph representa-
tion, then combined multiple stack traces into a single
graph. With this technique, their goal was to iden-
tify the software’s attack surface, i.e. the sum of all
paths where untrusted data can get in and out of the
system. After the identification, they ran their predic-
tion model only on those source files and binaries that
belong to the attack surface. They used the Random
Forest machine learning technique to build the predic-
tion model. The training dataset consisted of features
from source code and binary level software metrics
data.
The study of Sultana and Williams (Sultana and
Williams, 2017) explores the performance of class-
level patterns (i.e., micro patterns) in vulnerability
prediction and compares them with traditional class-
level software metrics. They found that micro patterns
have higher recall in detecting vulnerable classes than
the software metrics.
In contrast to these approaches, we used 42 dif-
ferent static source code metrics and 19 different pro-
cess metrics as predictor features. The prediction’s
granularity is at function level, i.e. our models can
predict whether a function contains a vulnerability
or not, which is much more fine-grained than file-
level approaches. This allows the models to produce
more actionable results. Also, we trained ten differ-
ent Machine Learning algorithms using our dataset,
including deep neural networks and other classical ap-
proaches, like Random Forest or k-Nearest Neighbor.
3 APPROACH
In this section, we summarize the overall approach
for the process metric collection, dataset extension
and model training on this extended dataset. Figure 1
shows this process at high level.
3.1 The Vulnerability Dataset
As we already pointed out, vulnerabilities can differ
from bugs in many cases. They might not even pre-
vent our program from working properly (rather it al-
lows users to do things they should not be able to).
Therefore, in order to train specific prediction models,
we need a dataset built from real-world vulnerabilities
in existing code.
To this end, we reused an existing function-
level dataset (i.e., functions and their possible vul-
nerabilities) created by Ferenc et al. (Ferenc et al.,
2019). The dataset was generated from functions
Improving Vulnerability Prediction of JavaScript Functions using Process Metrics
187

Figure 1: Data extraction and model training approach.
in JavaScript projects. To create this vulnerability
dataset, the authors collected vulnerability fix com-
mits from GitHub based on two publicly available
vulnerability databases, the Node Security Platform
(nsp)
2
and the Snyk Vulnerability Database.
3
They
mapped the vulnerability fix patches to functions and
collected all those that were affected by the patch.
The functions from the code version before the fix
became the vulnerable samples, while all other (not
affected) functions form the non-vulnerable samples.
After the data collection, they calculated 42 static
source code metrics (see Table 7 in the appendix) with
two different static analysis tools for each analyzed
function, like Cyclomatic Complexity, Nesting Level,
etc. This dataset contains function level data from
more than 300 projects, and every data row corre-
sponding to a JavaScript function is labeled vulner-
able or not vulnerable (labels of 1 and 0). For more
details on the dataset collection, please refer to (Fer-
enc et al., 2019).
Using this dataset with the set of static source code
metrics as features, Ferenc et al. trained models that
achieved an F-measure of 76% (91% precision and
66% recall), which already sounds very promising
and provides a strong basis for further research. In
this work, we extended this database with 19 differ-
ent process metrics (see Table 6 in the appendix) and
studied how the performance of vulnerability predic-
tion models change.
3.2 Process Metrics Extraction
To extend the above mentioned vulnerability dataset
with process metrics, we used the algorithm of Gy-
imesi et al. (Gyimesi, 2017). We integrated this al-
gorithm into a software quality monitoring platform,
called QualityGate
4
(Bakota et al., 2014), which is
able to analyze thousands of code versions efficiently,
which is a must for calculating process metrics. The
2
https://github.com/nodesecurity/nsp
3
https://snyk.io/vuln
4
https://quality-gate.com/
platform loads the git
5
version control data of a
project as input, performs static analysis on it, and
stores in an internal graph format, then calculates pro-
cess metrics on it. Therefore, one needs to provide the
version control URL for each project, and optionally
a specific commit hash, until which they want to cal-
culate the process metrics. For each program revision
the process metrics are updated based on the previous
values and the current commit. So to extend the orig-
inal dataset with process metrics for each function,
we went through the original database, collected the
necessary project information, and ran QualityGate to
calculate the process metrics.
The output of the algorithm is one csv file per
project, which contains the metrics and other infor-
mation (e.g., line info), which we could use to merge
these metrics back into the original dataset as new
feature columns. This way we have extended the
dataset with 19 new features, like number of modi-
fications, number of contributors, etc. More details
of the extracted process metrics can be found in (Gy-
imesi, 2017). To facilitate reproducibility, we made
the extended dataset publicly available.
6
3.3 Training Configurations
In order to test the impact of the newly added pro-
cess metrics on the performance of machine learning
models, we trained 10 different algorithms using the
Deep-Water Framework
7
(Ferenc et al., 2020). This
tool simplifies the configuration management of ML
tasks and offers efficient distributed training capabil-
ities and comprehensive visualization features. In the
following subsections, we describe the details of data
pre-processing and learning.
5
https://git-scm.com/
6
https://doi.org/10.5281/zenodo.4590021
7
https://github.com/sed-inf-u-
szeged/DeepWaterFramework
ICSOFT 2021 - 16th International Conference on Software Technologies
188

3.3.1 Balancing the Dataset
The vulnerability dataset is highly imbalanced, as it
contains 12,125 functions from which only 1,496 are
vulnerable. Therefore, in addition to the hyperparam-
eters of each model, we included re-sampling param-
eters in the grid-search we performed to find opti-
mal values. We tried both over-sampling and under-
sampling. In classification, over-sampling means that
we duplicate some of the elements of the less pop-
ulated class, while under-sampling means that we
delete some of the elements of the more populated
class. The result of these two operations is a more
balanced dataset, which drastically improves model
performances. If our model was trained on a dataset
containing e.g., mostly not vulnerable code, it would
make it less likely to flag a particular snippet of code
as vulnerable. The cause of this is that the model will
have a “preconception” that the largest portion of pro-
gram code are not vulnerable, since that is what it ex-
perienced in the learning phase.
3.3.2 Used ML Algorithms
We compared the results of all of the available ma-
chine learning algorithms that Deep-Water Frame-
work offers by default. These were the Random For-
est Classifier (RFC), Decision Tree Classifier (DT),
K-Nearest Neighbor Classifier (KNN), Support Vec-
tor Machine Classifier (SVM), Linear Regression
(LinReg), Logistic Regression (LogReg), Gaussian
Naive Bayes (NB), and Dummy Classifier (ZeroR)
from the scikit-learn
8
Python library. The framework
also offers two different neural network implemen-
tations. The first one is a default or simple version
(SDNN), which works with a fixed learning rate and
runs for a fixed number of epochs. The other one is an
improved or complex one (CDNN), which runs vali-
dation after every epoch, and if the model gets worse
(which is called a miss), then it restores the previous
best model and tries again with a reduced (halved)
learning rate. CDNN stops after a given number of
misses. Both of these neural net implementations are
based on the Tensorflow
9
Python library. From now
on, we will refer to the algorithms listed above with
the abbreviation in parentheses following them.
3.3.3 Hyperparameter Optimization
Finding the best hyperparameters of a machine learn-
ing algorithm is crucial in creating the best possible
prediction model. We used grid-search to find the best
8
https://scikit-learn.org/
9
https://www.tensorflow.org/
parameters, which is a common technique in the field
of machine learning. The name of grid-search comes
from how it works: First, we specify a set of values for
each parameter that we want to optimize. After that,
we create the Cartesian product of these sets, train a
model using each pair in the resulting set, then we
select the best performing one. If we apply this tech-
nique on two parameters, then the Cartesian product
of the two sets is a 2D matrix, hence the name grid-
search. We used 10-fold cross validation to evaluate
model performances, and applied a train-dev-test split
of the dataset with a 80%-10%-10% division.
4 RESULTS
In this section, we present our findings about the im-
pact of process metrics on vulnerability prediction.
First, we recap the original performance measures
achieved by Ferenc et al. using only static source
code metrics as predictors. Then, we showcase how
the addition of process metrics changes the machine
learning results.
4.1 Vulnerability Prediction with Static
Metrics Only
We used the results published by Ferenc et al. on the
original JavaScript vulnerability dataset (containing
only static source code metrics) as a baseline for eval-
uating the effect of the extracted process metrics on
the vulnerability prediction. They achieved the best
F-measure value with the KNN algorithm without re-
sampling.
Table 1: Best results with only static source code metrics
achieved by Ferenc et al. (our baseline).
Classifier Precision Recall F-measure
KNN 90.9% 65.9% 76.4%
DT 73.7% 69.7% 71.6%
RFC 93.1% 57.8% 71.3%
SDNN 87.3% 60.0% 71.1%
CDNN 91.1% 57.9% 70.8%
SVM 95.3% 51.4% 66.8%
LogReg 75.3% 21.2% 33.1%
LinReg 84.3% 15.4% 26.1%
NB 22.4% 11.7% 15.3%
The complete results are shown in Table 1, the
best value in each column is shown in bold, and the
rows are ordered by F-measure in a descending order.
Improving Vulnerability Prediction of JavaScript Functions using Process Metrics
189

Table 2: Results with the best hyperparameters defined in previous work by Ferenc et al. using only static metrics as predictors.
Classifier TP TN FP FN Accuracy Precision Recall F-measure
RFC 699 7054 24 261 96.5% 96.7% 72.8% 83.1% (+11.8%)
DT 723 7006 72 237 96.2% 90.9% 75.3% 82.4% (+10.8%)
CDNN 685 7027 51 275 95.9% 93.1% 71.4% 80.8% (+10%)
SDNN 665 7037 41 295 95.8% 94.2% 69.3% 79.8% (+8.7%)
KNN 613 7059 19 347 95.5% 97.0% 63.9% 77.0% (+0.6%)
SVM 548 7060 18 412 94.7% 96.8% 57.1% 71.8% (+5%)
LogReg 332 7007 71 628 91.3% 82.4% 34.6% 48.7% (+15.6%)
LinReg 274 7051 27 686 91.1% 91.0% 28.5% 43.5% (+17.4%)
NB 115 6779 299 845 85.8% 27.8% 12.0% 16.7% (+1.4%)
4.2 Vulnerability Prediction with Both
Static and Process Metrics
We present how the addition of process metrics
changed the results of the prediction models. We start
with outlining the performance of the models using
the parameters determined in the previous work of
Ferenc et al., then we detail how re-sampling and hy-
perparameter optimization affect the results on the ex-
tended dataset. Finally, we compare the best models
achieved by the addition of process metrics, and the
best models relying only on static code metrics.
4.2.1 Best Results with Hyperparameters from
Previous Work
We trained 10 different models (with ML algorithms
described in Section 3.3.2) on the dataset extended
with process metrics (see Section 3.2). We included
the ZeroR classifier as well, which classifies every-
thing based on the most common label in the dataset
(i.e., we used it as a baseline algorithm). As the ma-
jority of samples fall into the non-vulnerable category
(i.e., 0/negative class label), ZeroR has no precision
and a 0 recall measure, but it set up a baseline for
accuracy, 86.93%. This means that if another model
performs worse in terms of accuracy than ZeroR, then
it is no better than the trivial guessing.
We continued with the evaluation of the remain-
ing 9 models. First, we used the best hyperparameters
determined in the previous work by Ferenc et al. for
each algorithm (using only static source code metrics)
to get an overall picture of the performance of these
models on the extended, new dataset. As shown in
Table 2, the best overall performance, i.e. F-measure,
was achieved by RFC in this setup. This is 6.7%
higher than the best model (KNN) based only on the
static source code metrics. The change in F-measure
of each model compared to its version based on static
source code metrics only is shown in parentheses.
The overall accuracy of the RFC model was
96.5%, which is almost 10% higher than that of
the trivial ZeroR algorithm. The effect on process
metrics could be observed on both precision and
recall, which improved at almost the same rate. The
worst result in this setup was achieved by NB, which
underperformed even ZeroR (but still outperformed
NB using only static source code metrics). Based
on these first results, we can already answer RQ1 as
follows.
RQ1: Process metrics can improve existing
JavaScript vulnerability prediction models. With
this initial experiment, using the best hyperparam-
eters from the previous work, we already improved
the best F-measure value by 6.7%, the best recall by
5.6%, and the best precision by 1.7%.
Another important factor is the number of false
positives (FP column in Table 2), where the best value
was achieved by SVM, KNN being the second best.
Although KNN and SVM did not perform as well as
RFC in terms of F-measure, they produced the low-
est number of false hits, while having the two highest
precision values. That is, there may be vulnerabilities
that the model does not recognize, but in return, the
number of false alarms they produce is significantly
reduced. In terms of usability, this might be an impor-
tant aspect, as false alarms can easily build distrust in
the users, preventing the adoption of such models in
practice.
4.2.2 The Effects of Re-sampling
To further improve the efficiency of the models on the
extended dataset, we used four different re-sampling
ratios, both for under and over-sampling: 25%, 50%,
75%, 100%. So we used under and over-sampling
strategies to reach the ratio of positive and negative
samples to be at these levels. We observed that by per-
forming either under or over-sampling to achieve the
same ratios, we get similar model performances. With
higher re-sampling rates a higher recall value can be
achieved, which means the models could recognize
a higher percentage of vulnerable functions. Unfortu-
nately, the higher percentage of recognized vulnerable
ICSOFT 2021 - 16th International Conference on Software Technologies
190

Table 3: Best F-measure values per classifier using the optimal hyperparameters.
Classifier TP TN FP FN Accuracy Precision Recall F-measure
RFC 730 7046 32 230 96.7% 95.8% 76.0% 84.8% (+13.5%)
DT 723 7006 72 237 96.2% 90.9% 75.3% 82.4% (+10.8%)
KNN 684 7041 37 276 96.1% 94.9% 71.3% 81.4% (+5%)
SDNN 687 7019 59 273 95.9% 92.1% 71.6% 80.5% (+9.4%)
CDNN 678 7025 53 282 95.8% 92.8% 70.6% 80.2% (+9.4%)
SVM 692 6966 112 268 95.3% 86.1% 72.1% 78.5% (+11.7%)
LogReg 496 6906 172 464 92.1% 74.3% 51.7% 60.9% (+27.8%)
LinReg 570 6592 486 390 89.1% 54.0% 59.4% 56.6% (+24.5%)
NB 115 6779 299 845 85.8% 27.8% 12.0% 16.7% (+1.4%)
functions is accompanied by a higher number of false
positive elements, i.e. the model is more likely to la-
bel a function to be vulnerable that does not actually
contain any vulnerabilities. For all the other perfor-
mance metrics, the best results were obtained without
re-sampling, therefore, in each table we present the
results achieved on the dataset without re-sampling.
4.2.3 Finding the Best Hyperparameters
To find out if further improvements could be achieved
by hyperparameter optimization based on the ex-
tended new dataset, we started a grid-search for each
classifier one by one to find the best possible param-
eterizations. Each row in Table 3 shows the best re-
sult in terms of F-measure achieved by the grid-search
on a classifier’s hyperparameters. The table is orga-
nized by F-measure in a descending order for easier
overview.
As we can see, hyperparameter optimization on
the extended dataset further increased the perfor-
mance measures. The magnitude of this increase is
varying, but can be as high as +12.2% for LogReg.
The best results are shown in bold; the F-measure
improvement compared to the static source metrics
results are also shown in the last column, between
parentheses. Again, RFC performed by far the best,
but DT, KNN, and neural network-based methods also
worked well. What is remarkable is that RFC and
KNN achieved a fairly high precision value despite
the results being sorted by F measure. This is impor-
tant because even though we want to maximize the
precision value, the recall – thus the overall perfor-
mance – is also very important, as a poorly perform-
ing model in this respect can give a false sense of se-
curity to the users.
Each row in Table 4 shows the best result in terms
of precision achieved by the grid-search on a classi-
fier’s hyperparameters. The table is organized by pre-
cision in a descending order for easier overview. The
best results are shown in bold here as well. Again,
the aforementioned decision tree-based models (DT,
RFC) performed among the best, but KNN achieved
the best precision value.
As we mentioned earlier, on the one hand, max-
imizing the precision value is important in terms of
increasing user experience. On the other hand, F-
measure is still important, since too many false neg-
atives can lead to a false sense of security, which can
also result in bad user experience. We can see that DT
achieved a higher precision value than RFC, but DT
performed significantly worse than RFC in terms of
F-measure (i.e., has much more FN hits, thus lower
recall). Furthermore, selecting hyperparameters that
optimize model precision significantly reduces their
recall, thus the overall F-measure. So we could con-
firm that there is a practical trade-off between pre-
cision and recall, which one needs to consider when
selecting the hyperparameters of models for practical
applications.
4.2.4 Comparison of the Best Models
To aid easier comparison of the data presented in the
tables above, we created an overview plot of the best
results of each algorithm (see Figure 2). Here the
best results per algorithm can be seen, according to
three different metrics, F-measure (or F1-score), pre-
cision, and recall. Recall measures what percentage
of the vulnerable functions was found by our model,
precision measures what percentage of the predicted
vulnerable functions was truly vulnerable, while F-
measure is the harmonic mean of these two.
Using this plot, one can easily see how these val-
ues changed on the extended dataset. F-measure val-
ues are marked with red color. The full red line shows
the best results with only static source metrics as pre-
dictors, and the dashed red line shows the results ob-
tained with with the process metrics being added to
the set of features. We applied the same convention
for the other two metrics, precision and recall.
As can be seen, except in the case of SVM, Lin-
Reg and LogReg classifiers, we achieved significant
improvement in all three metrics. The recall value
was improved the most by process metrics, which
means that using these metrics, we can discover a lot
more vulnerabilities. In case of the above mentioned
three algorithms, the price of recall improvement was
Improving Vulnerability Prediction of JavaScript Functions using Process Metrics
191
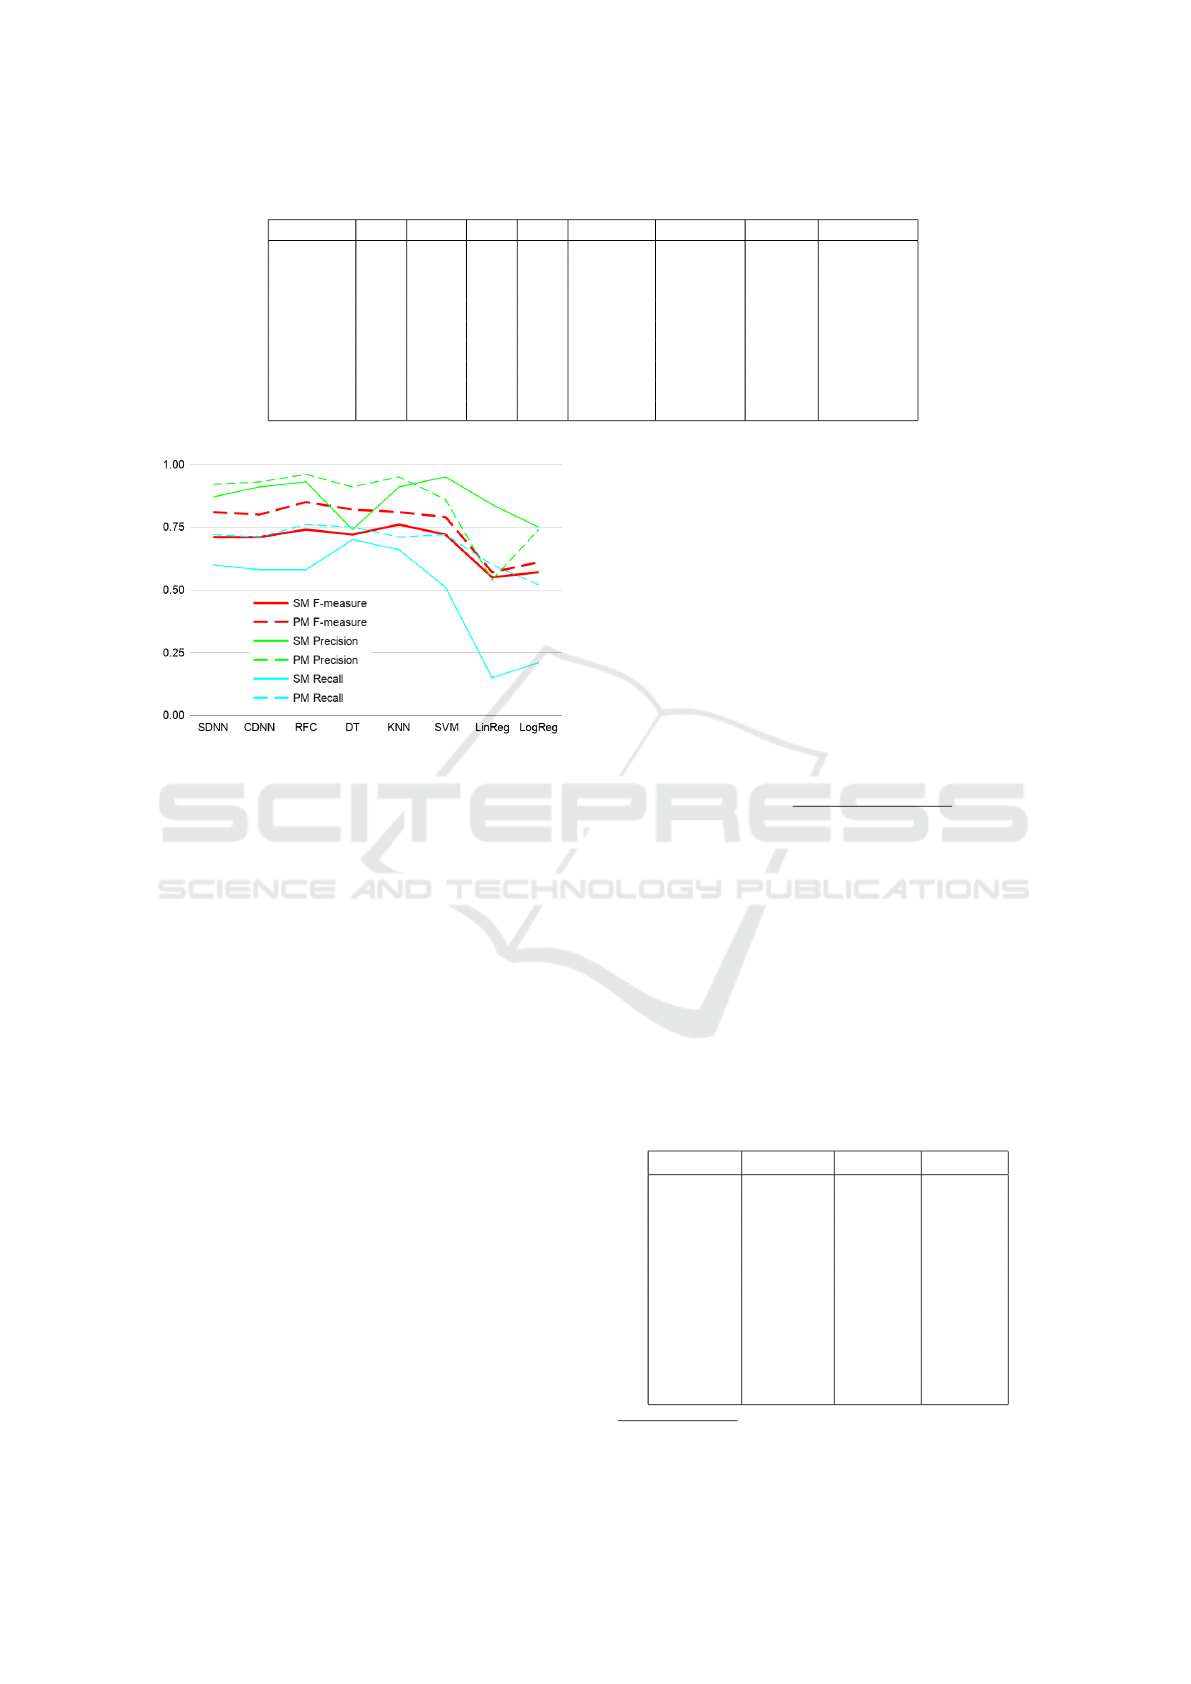
Table 4: Best precision values per classifier using the optimal hyperparameters.
classifier TP TN FP FN accuracy precision recall F-measure
KNN 565 7071 7 395 95.0% 98.8% 58.9% 73.8%
DT 429 7068 10 531 93.3% 97.7% 44.7% 61.3%
RFC 599 7063 15 361 95.3% 97.6% 62.4% 76.1%
SVM 548 7060 18 412 94.7% 96.8% 57.1% 71.8%
CDNN 551 7048 30 409 94.5% 94.8% 57.4% 71.5%
SDNN 572 7045 33 388 94.8% 94.6% 59.6% 73.1%
LogReg 221 7058 20 739 90.6% 91.7% 23.0% 36.8%
LinReg 274 7051 27 686 91.1% 91.0% 28.5% 43.5%
NB 115 6779 299 845 85.8% 27.8% 12.0% 16.7%
Figure 2: Overview of the best precision, recall, and F-
measure values for models using static metrics (SM) only,
and models using static and process metrics (PM) com-
bined.
a drop in precision, which also resulted in a less sig-
nificant overall improvement in terms of F-measure.
Even though intuitively it seems that adding process
metrics as features improve ML models in predicting
vulnerable JavaScript functions, we need to perform a
significance test to be sure that the improvements are
not by coincidence.
4.2.5 Checking the Statistical Significance of
Performance Improvement
To check if the improvements are statistically signif-
icant, we applied the McNemar’s test (Lachenbruch,
2014). This test is suitable for comparing the predic-
tion power of two classifiers. The default assumption,
or null hypothesis, of the test is that the two clas-
sifiers disagree to the same amount. If the null hy-
pothesis is rejected, it suggests that there is evidence
that the cases disagree in different ways, i.e., the dis-
agreements are skewed. In our case, we took one of
two classifiers (for every algorithm pair) trained on
the original database, which only contains static met-
rics, while the other one trained on the new, extended
database, which contains process metrics too. The
McNemar’s test operates upon a 2x2 contingency ta-
ble, which we can produce by evaluating both models
on the same dataset (in our case, these two datasets
were different in terms of the number of features, but
both models were predicting the same functions, so
we satisfied this requirement). The contingency table
is produced as follows. At the 0,0 position in the table,
we count the number of occurrences where both clas-
sifiers predicted the correct label, and at the 1,1 index
we count the number of occurrences where both clas-
sifiers predicted the incorrect label. At 0,1 we count
the number of occurrences where the first classifier
predicted the correct label, but the second classifier
predicted the wrong label, and vice versa at 1,0. The
McNemar’s test calculates a so called “statistic” value
as follows:
statistic =
(ct[0][1] − ct[1][0])
2
(ct[0][1] + ct[1][0])
,
where ct[x][y] is the value of contingency table at po-
sition (x, y). Using this statistic value, the test calcu-
lates a p value, which can be interpreted as follows. p
>α: accept H0, e.g. there is no significant improve-
ment. p <= α: reject H0, e.g. the improvement in
prediction performances is significant. We used the
Statsmodels
10
Python library to implements the test.
The results are summarized in Table 5. As it is shown
in the table in case of all the used algorithms, the im-
provement was statistically significant (we used 0.05
α value to reject the null hypothesis).
Table 5: McNemar’s test.
Model Statistic p-value H0
SDNNC 27.000 0.000 rejected
CDNNC 55.000 0.000 rejected
DT 44.000 0.000 rejected
RFC 18.000 0.000 rejected
LinReg 10.000 0.000 rejected
LogReg 28.000 0.000 rejected
LogReg 28.000 0.000 rejected
NB 131.000 0.048 rejected
SVM 12.000 0.000 rejected
KNN 12.000 0.000 rejected
10
https://www.statsmodels.org/stable/index.html
ICSOFT 2021 - 16th International Conference on Software Technologies
192

After the results of this McNemar’s test, we are
ready to formulate our answer to RQ2.
RQ2: We can achieve significant improvement
in predicting vulnerable JavaScript functions using
process metrics as additional features. The over-
all performance increase with process metrics was
8.4% in terms of F-measure (in the baseline work,
Ferenc et al. achieved an F-measure of 0.76 with
KNN, now on the new dataset we achieved an F-
measure of 0.85 with RFC), 6.3% in terms of re-
call and a 3.5% in terms of precision. All the per-
formance measure increases are statistically signifi-
cant.
5 THREATS TO VALIDITY
The complete dataset we trained our models contains
only 12,125 samples. Some models, typically deep
neural networks require a much higher number of
samples to produce reliable results. However, we ap-
plied classical machine learning models, too to build
vulnerability prediction models, which were perform-
ing even better than the deep neural networks. There-
fore, we are certain about our findings, nonetheless,
further extension of the dataset would be favorable.
The training dataset is highly imbalanced. Less
then 10% of the samples were actually vulnerable. To
mitigate this risk, we applied re-sampling strategies
before model training. However, we found that most
of the models are affected by re-sampling in a con-
troversial way, thus we presented the results without
applying any re-sampling on the data.
There are several ML and evaluation measures,
and we used precision, recall and F1-measure
for comparison. However, for highly imbalanced
datasets, AUC, probability of false alarms, recall , G-
mean, or MCC might work better. Nonetheless, we
believe the general conclusions would remain valid
based on these measures as well.
6 CONCLUSION
In this paper, we studied the effect of process met-
rics on the prediction performance of ML models in
the context of JavaScript functions. We based our re-
search on a previously published vulnerability dataset
by Ferenc et al. The dataset contained 42 static source
code metrics of various JavaScript functions and a la-
bel column indicating whether a function contains a
vulnerability or not. We extended this dataset with 19
process metrics, which was calculated by mining the
version control history of each project.
Using the data set, we trained different machine
learning models to predict vulnerable functions. We
compared the performance of these models with the
ones obtained by using only static source code metrics
as predictors. The best performing algorithm for pre-
dicting vulnerable JavaScript functions relying on the
combination of process metrics and static source code
metrics was Random Forest in terms of F-measure
with a value of 0.85 (0.96 precision and 0.76 recall),
which is a clear improvement compared to the best
model (k-NN) using only static source code metrics
that achieved an F-measure of 0.76 (0.91 precision
and 0.66 recall).
The best precision (0.99) was achieved by k-NN
(with the static metrics it was 0.95), while the best re-
call (0.90) was achieved by SVM (with the static met-
rics it was 0.80). In overall, according to our experi-
ences, Random Forest and k-NN are mostly equally
well-suited for the task, while the regressions as well
as the Naive Bayes algorithm performed worse.
The results showed that using process metrics
can significantly improve the predictive power of
JavaScript vulnerability prediction models in terms of
all the IR measures (i.e., precision, recall, F-measure).
With a McNemar’s test, we also showed that the in-
crease in performance measures are statistically sig-
nificant. In the future, we plan to extend the fea-
ture space with some new type of metrics and make
such prediction models part of the developer’s every-
day lives.
ACKNOWLEDGMENT
The presented work was carried out within the
SETIT Project (2018-1.2.1-NKP-2018-00004)
11
and
supported by the Ministry of Innovation and Technol-
ogy NRDI Office within the framework of the Arti-
ficial Intelligence National Laboratory Program (MI-
LAB). The research was partly supported by the EU-
funded project AssureMOSS (Grant no. 952647).
Furthermore, P
´
eter Heged
˝
us was supported by the
Bolyai J
´
anos Scholarship of the Hungarian Academy
of Sciences and the
´
UNKP-20-5-SZTE-650 New Na-
tional Excellence Program of the Ministry for Innova-
tion and Technology.
11
Project no. 2018-1.2.1-NKP-2018-00004 has been imple-
mented with the support provided from the National Re-
search, Development and Innovation Fund of Hungary,
financed under the 2018-1.2.1-NKP funding scheme.
Improving Vulnerability Prediction of JavaScript Functions using Process Metrics
193

REFERENCES
Bakota, T., Heged
˝
us, P., Siket, I., Lad
´
anyi, G., and Ferenc,
R. (2014). QualityGate SourceAudit: a Tool for As-
sessing the Technical Quality of Software. In Pro-
ceedings of the CSMR-WCRE 2014 Software Evolu-
tion Week (Merger of the 18th IEEE European Con-
ference on Software Maintenance and Reengineering
& 21st IEEE Working Conference on Reverse Engi-
neering - CSMR-WCRE 2014), pages 440–445. IEEE.
Camilo, F., Meneely, A., and Nagappan, M. (2015). Do
bugs foreshadow vulnerabilities? a study of the
chromium project. In 2015 IEEE/ACM 12th Working
Conference on Mining Software Repositories, pages
269–279.
Delphine Immaculate, S., Farida Begam, M., and Flo-
ramary, M. (2019). Software bug prediction using su-
pervised machine learning algorithms. In 2019 Inter-
national Conference on Data Science and Communi-
cation (IconDSC), pages 1–7.
Ferenc, R., Heged
˝
us, P., Gyimesi, P., Antal, G., B
´
an, D., and
Gyim
´
othy, T. (2019). Challenging machine learning
algorithms in predicting vulnerable javascript func-
tions. In Proceedings of the 7th International Work-
shop on Realizing Artificial Intelligence Synergies in
Software Engineering, RAISE ’19, page 8–14. IEEE
Press.
Ferenc, R., Viszkok, T., Aladics, T., J
´
asz, J., and Heged
˝
us,
P. (2020). Deep-water framework: The swiss army
knife of humans working with machine learning mod-
els. SoftwareX, 12:100551.
Gyimesi, P. (2017). Automatic calculation of process met-
rics and their bug prediction capabilities. Acta Cyber-
netica, 23:537–559.
Hammouri, A., Hammad, M., Alnabhan, M., and Al-
sarayrah, F. (2018). Software bug prediction using
machine learning approach. International Journal of
Advanced Computer Science and Applications, 9.
Jureczko, M. and Madeyski, L. (2011). A review of pro-
cess metrics in defect prediction studies. Methods of
Applied Computer Science, 5:133–145.
Kaur, K. and Chopra, D. (2016). An empirical study of
software entropy based bug prediction using machine
learning. International Journal of System Assurance
Engineering and Management, 8.
Krsul, I. (2011). Software vulnerability analysis. ETD Col-
lection for Purdue University.
Lachenbruch, P. A. (2014). Mcnemar test. Wiley StatsRef:
Statistics Reference Online.
Melo, C., da Cruz, M. L., Martins, A., Matos, T., Filho, J.,
and Machado, J. (2019). A practical guide to support
change-proneness prediction. In Proceedings of the
21st International Conference on Enterprise Informa-
tion Systems - Volume 2: ICEIS,, pages 269–276. IN-
STICC, SciTePress.
Mnkandla, E. and Mpofu, B. (2016). Software defect
prediction using process metrics elasticsearch engine
case study. In 2016 International Conference on Ad-
vances in Computing and Communication Engineer-
ing (ICACCE), pages 254–260.
Puranik, S., Deshpande, P., and Chandrasekaran, K. (2016).
A novel machine learning approach for bug predic-
tion. Procedia Computer Science, 93:924–930.
Rahman, F. and Devanbu, P. (2013). How, and why, process
metrics are better. pages 432–441.
Scandariato, R., Walden, J., Hovsepyan, A., and Joosen, W.
(2014). Predicting vulnerable software components
via text mining. IEEE Transactions on Software En-
gineering, 40(10):993–1006.
Shin, Y., Meneely, A., Williams, L., and Osborne, J. A.
(2011). Evaluating complexity, code churn, and devel-
oper activity metrics as indicators of software vulnera-
bilities. IEEE Transactions on Software Engineering,
37(6):772–787.
Shin, Y. and Williams, L. A. (2011). Can traditional fault
prediction models be used for vulnerability predic-
tion? Empirical Software Engineering, 18:25–59.
Stani
´
c, B. and Afzal, W. (2017). Process metrics are not
bad predictors of fault proneness. In 2017 IEEE Inter-
national Conference on Software Quality, Reliability
and Security Companion (QRS-C), pages 493–499.
Sultana, K. Z. and Williams, B. J. (2017). Evaluating micro
patterns and software metrics in vulnerability predic-
tion. In 2017 6th International Workshop on Software
Mining (SoftwareMining), pages 40–47.
Theisen, C., Herzig, K., Morrison, P., Murphy, B., and
Williams, L. (2015). Approximating attack surfaces
with stack traces. In 2015 IEEE/ACM 37th IEEE In-
ternational Conference on Software Engineering, vol-
ume 2, pages 199–208.
T
´
oth, Z., Gyimesi, P., and Ferenc, R. (2016). A public bug
database of github projects and its application in bug
prediction. In ICCSA.
Zimmermann, T., Nagappan, N., and Williams, L. (2010).
Searching for a needle in a haystack: Predicting secu-
rity vulnerabilities for windows vista. In 2010 Third
International Conference on Software Testing, Verifi-
cation and Validation, pages 421–428.
APPENDIX
Table 6: Process Metrics.
Metric Description
AVGNOAL Average Number Of Added Lines
AVGNODL Average Number Of Deleted Lines
AVGNOEMT Average Number Of Elements Modified Together
AVGNOML Average Number of Modified Lines
AVGTBC Average Time Between Changes
CChurn Sum of lines added minus lines deleted
MNOAL Maximum Number of Added Lines
MNODL Maximum Number of Deleted Lines
MNOEMT Maximum Number of Elements Modified Together
MNOML Maximum Number of Modified Lines
NOADD Number of Additions
NOCC Number of Contributor Changes
NOCHG Number of Changes
NOContr Number of Contributors
NODEL Number of Deletions
NOMOD Number of Modifications
SOADD Sum of Added Lines
SODEL Sum of Deleted Lines
SOMOD Sum of Modified Lines
ICSOFT 2021 - 16th International Conference on Software Technologies
194

Table 7: Static Metrics.
Metric Description
CC Clone Coverage
CCL Clone Classes
CCO Clone Complexity
CI Clone Instances
CLC Clone Line Coverage
LDC Lines of Duplicated Code
McCC, CYCL Cyclomatic Complexity
NII Number of Incoming Invocations
NL Nesting Level
NLE Nesting Level without else-if
NOI Number of Outgoing Invocations
CD, TCD (Total) Comment Density
CLOC, TCLOC (Total) Comment Lines of Code
DLOC Documentation Lines of Code
LLOC, TLLOC (Total) Logical Lines of Code
LOC, TLOC (Total) Lines of Code
NOS, TNOS (Total) Number of Statements
NUMPAR, PARAMS Number of Parameters
HOR D Nr. of Distinct Halstead Operators
HOR T Nr. of Total Halstead Operators
HON D Nr. of Distinct Halstead Operands
HON T Nr. of Total Halstead Operands
HLEN Halstead Length
HVOC Halstead Vocabulary Size
HDIFF Halstead Difficulty
HVOL Halstead Volume
HEFF Halstead Effort
HBUGS Halstead Bugs
HTIME Halstead Time
CYCL DENS Cyclomatic Density
WarningInfo ESLint Info priority Warnings
WarningMinor ESLint Minor priority Warnings
WarningMajor ESLint Major priority Warnings
WarningCritical ESLint Critical priority Warnings
WarningBlocker ESLint Blocker priority Warnings
Improving Vulnerability Prediction of JavaScript Functions using Process Metrics
195
