
Recommender Systems in Food Retail: Modeling Repeat Purchase
Decisions on Transaction Data of a Stationary Food Retailer
Thomas Neifer
1,2
, Dennis Lawo
1,2
, Gunnar Stevens
1,2
, Alexander Boden
2
and Andreas Gadatsch
2
1
Verbraucherinformatik Research Group, University of Siegen, Siegen, Germany
2
Institut f
¨
ur Verbraucherinformatik, University of Applied Sciences Bonn-Rhein-Sieg, Sankt Augustin, Germany
Keywords:
Recommender Systems, Food Retail, Repeat Purchase Recommendations, Bayesian Hierarchical Model.
Abstract:
In the course of growing online retailing, recommendation systems have become established that derive rec-
ommendations from customers’ purchase histories. Recommending suitable food products can represent a
lucrative added value for food retailers, but at the same time challenges them to make good predictions for
repeated food purchases. Repeat purchase recommendations have been little explored in the literature. These
predict when a product will be purchased again by a customer. This is especially important for food recommen-
dations, since it is not the frequency of the same item in the shopping basket that is relevant for determining
repeat purchase intervals, but rather their difference over time. In this paper, in addition to critically reflecting
classical recommendation systems on the underlying repeat purchase context, two models for online prod-
uct recommendations are derived from the literature, validated and discussed for the food context using real
transaction data of a German stationary food retailer.
1 INTRODUCTION
In times of digital transformation, enormous impor-
tance is attached to data. This manifests itself not least
in current trend topics in literature such as Big Data
and Data Science (Loebbecke and Picot, 2015). Food
retailers have also long since discovered such oppor-
tunities for themselves: A well-known example is the
insight into the connection between the purchase of
beer and diapers on the weekend. The information ob-
tained about consumer behavior has been used to op-
timize advertising and pricing mechanisms (Fu et al.,
2000). However, this requires a broad database (Chen
et al., 2012), which has led to asymmetric business
models such as ”Payback”, which collect user data
through discounts or loyalty programs and make it
available to cooperation partners in anonymized form
(Hofman-Kohlmeyer, 2016; Stevens et al., 2017).
But food retailing is not only experiencing change
from a digital perspective: consumers’ lifestyles are
also currently transforming strongly. Health, ecologi-
cal, ethical, social and culinary issues are gaining im-
portance. Nutrition and eating habits should no longer
merely satisfy hunger, but be an expression of the con-
sumer’s individual personality. A growing health con-
sciousness among consumers is also having an impact
on the demand for fresh and healthy foods. In the
course of this, the regionality and origin of products
in terms of quality, environmental awareness and eth-
ical aspects are coming into the focus of buyers in or-
der to eat healthy and climate-conscious (Hutapea and
Malanowski, 2019; Lawo et al., 2019; Stevens et al.,
2017). This leads to growing demands on food and
an increasing need for product variety in food retail
(Hutapea and Malanowski, 2019).
Especially in online retail, which is predestined
for the collection of user data (Jakobi et al., 2020),
transaction, behavioral, and rating data is used to en-
sure a personalized experience for customers by pro-
viding them with relevant content through recommen-
dation systems (Talasu et al., 2017). In online food
retailing, Amazon Prime Pantry, for example, also re-
lies on the use of recommendation systems to design
customer-centric marketing activities (Dokras, 2017).
However, recommendation systems are not yet
omnipresent in food and online retail. While click
pattern and user preference analyses are still relatively
easy to integrate (Poggi et al., 2013; Xu et al., 2011),
the more complex modeling of customers’ repeat pur-
chase behavior is particularly important in the food
sector. This is due to the fact that purchase deci-
sions there are often habitualized and therefore the
question is not what to buy but when to buy it (Kaas
and Dieterich, 1979; Ehrenberg, 2000). While estab-
Neifer, T., Lawo, D., Stevens, G., Boden, A. and Gadatsch, A.
Recommender Systems in Food Retail: Modeling Repeat Purchase Decisions on Transaction Data of a Stationary Food Retailer.
DOI: 10.5220/0010553600250036
In Proceedings of the 18th International Conference on e-Business (ICE-B 2021), pages 25-36
ISBN: 978-989-758-527-2
Copyright
c
2021 by SCITEPRESS – Science and Technology Publications, Lda. All rights reserved
25

lished studies and models in the context of marketing
research mostly deal with the consideration of spe-
cific products or brands (Fader et al., 2005; Morri-
son and Schmittlein, 1988), there are, however, first
approaches that discuss recommendation systems for
repeat purchase behavior using online tracked data
(Bhagat et al., 2018; Dey et al., 2016).
This paper critically derives the problems of exist-
ing recommender systems for food retail, and builds
on them to validate current models for repeat purchase
recommendations for this domain. However, in con-
trast to prior research, our work examines real-world
transaction data from stationary supermarket termi-
nals of a large German food retailer, as purchases
in food retail mainly take place offline (Pitts et al.,
2018). This represents a major difference to online
tracked data, which can usually be collected in a more
structured and traceable form (Jakobi et al., 2020).
The paper concludes with a critical discussion of the
results and identification of possible improvements to
make the models more suitable for both online and
offline food retailing.
2 RECOMMENDER SYSTEMS
2.1 General
Recommender systems are designed to support users
in their (future) decisions based on their previous us-
age history and that of other users. In principle,
they can be differentiated into non-individual, col-
laborative, content-based, knowledge-based, demo-
graphic and hybrid filters (Aggarwal, 2016; Bobadilla
et al., 2013). While non-individual recommenda-
tions are the same for all users and thus lack per-
sonalization of the respective products (e.g., the most
clicked products) Bobadilla et al. (2013), collabora-
tive filtering (CF) examines the preferences of dif-
ferent users based on their consumption and usage
patterns to identify similar individuals or items (e.g.,
movies on Netflix). Recommendations are made ei-
ther based on the similarity of two items in terms
of their user ratings (”item-based”) or on their rat-
ings of similar users (”user-based”) (Sarwar et al.,
2001; Zhang et al., 2017; Linden et al., 2003). In
contrast to collaborative approaches, content-based
filters generate their recommendations based on the
characteristics and content of the items already con-
sumed. For example, items similar to a user’s previ-
ous ones (e.g., articles about science and technology)
are recommended (Van Meteren and Van Someren,
2000; Bobadilla et al., 2013; Miranda et al., 1999).
Knowledge-based filters are based on satisfying cus-
tomer needs through specifically defined product fea-
tures. Here, explicit rules are used to generate rec-
ommendations (e.g., specifications such as size, min.
and max. price, or zip code when buying a house)
(Aggarwal, 2016). Demographic filtering makes rec-
ommendations based on a socio-demographic profile
(e.g., age, gender, nationality) of a user (Thorat et al.,
2015). Hybrid approaches represent a combination of
different filters. These are often used to circumvent
problems of individual methods as well as to increase
the accuracy and efficiency of the filtering (Aggarwal,
2016; Thorat et al., 2015).
In recent years and mainly driven by online re-
tailing, collaborative and content-based recommenda-
tion methods have become established (Breese et al.,
2013; Linden et al., 2003). However, these systems
have fundamental problems that are problematic for
recommending food products for repeated purchase.
2.2 Issues for Food Retail
2.2.1 Data Distribution
A fundamental problem of recommender systems is
the cold start problem, which leads to inaccurate pref-
erence capture for new users or products due to a
sparsely populated customer-product matrix (Thorat
et al., 2015). This is particularly problematic in food
retailing given that the ”long tail” of items (e.g., niche
items) has only sporadic ratings and therefore will
be difficult to predict (Clement et al., 2019). This
is especially affecting the collaborative approaches,
as they are based on historical customer preferences.
Since user-based collaborative filtering is built on
comparing item scores from different users, many
neighborhood scores are needed for a specific item
(Brusilovsky, 2007). Content-based methods are not
affected as much, since they determine similarities
based on item descriptions and thus recommend prod-
ucts for which there are no reviews yet (Thorat et al.,
2015). Due to dimension reduction, the matrix factor-
ization (MF) approach can lead to better results (Do
et al., 2010; kumar Bokde et al., 2015). In the con-
text of probabilistic model-based methods, such as the
Bayes classifier, missing values are ignored in proba-
bility estimation (Isinkaye et al., 2015). However, in
content-based systems, the so-called portfolio prob-
lem occurs, which ensures that only items are rec-
ommended due to overspecialization, which are very
similar to already recommended products (Tintarev
and Masthoff, 2006).
For the transaction data in food retail, this means
that a recommendation system would need to have
many purchases of the same product in order to form a
ICE-B 2021 - 18th International Conference on e-Business
26

neighborhood of similar customers. This is especially
relevant regarding the cold start problem, so that new
customers can be quickly assigned to a suitable cus-
tomer group to be able to make appropriate recom-
mendations. However, when it comes to sparse pur-
chasing data with only a few comparable purchases,
this leads to problems in generating neighborhoods
and the model does not work accurately.
2.2.2 Scalability
Another problem arises from the resource intensity of
the algorithms for computing the optimal neighbor-
hood. The demand for time and memory increases
linearly with the number of users and scores (Zhang
et al., 2017; Brusilovsky, 2007). For a food retailer
with a broad product and customer base that wants
to make recommendations in a split second, such
an algorithm would create time and cost pressures.
This can be countered by means of subsampling and
model-based methods. With subsampling, only a sub-
set of users is selected at a time, which is intended
to relieve the storage capacity. However, the compu-
tation of the neighborhood remains fixed (Lee et al.,
2012). In the context of model-based clustering meth-
ods, users are grouped into clusters based on com-
mon properties. The active user is now compared to a
group of users rather than individuals, so that the clos-
est neighborhood can be quickly identified. However,
problems with missing data also arise here when the
distance functions lead to non-intuitive and unstable
clusters (Lam and Riedl, 2004; Johnson, 1967; Lin-
den et al., 2003). Bayesian classification also provides
an advantage here, as it is a probabilistic model that
represents the historical data and therefore can per-
form classifications without having to retrieve the en-
tire customer-product matrix (Aggarwal, 2016). Fur-
thermore, MF approaches also provide acceleration
of recommendations by reducing dimensionality (Sar-
war et al., 2002).
As many transactions are needed to calculate
neighborhoods, this leads to a high computational ef-
fort and accordingly raises resource issues. Memory-
based methods therefore seem rather unsuitable for
this type of recommendation, which is why prob-
abilistic (Bayesian) models in particular can offer
added value here.
2.2.3 Inherent Meaning
Collaborative filtering is based on the assumption that
users have common preferences. The more homo-
geneous the preferences of different user groups, the
more functional the model will be. Furthermore, col-
laborative filtering is particularly suitable for subjec-
tive characteristics (e.g., musical taste) that influence
a selection decision. If, on the other hand, there are
predominantly objective quality criteria (such as price
changes), which do not have to be weighed against
each other, other models should be used. Accord-
ingly, a homogeneity of the items is also desirable.
Thus, they are similar with regard to their objec-
tive criteria and differentiate only by subjective char-
acteristics (e.g., music albums usually have a simi-
lar price, a similar length and similar sale channels)
(Brusilovsky, 2007; Linden et al., 2003; Zhang et al.,
2017).
In the case of purchasing data, this homogeneity
is usually not given, since it is precisely the objective
characteristics that cause behavioral changes in cus-
tomers and are therefore often addressed by market-
ing (e.g., weekly offers). Due to the resulting trade-
off between subjective and objective criteria, collabo-
rative filters can be seen as problematic for the gener-
ation of recommendations in food retailing.
2.2.4 Data Persistence
The temporal validity and relevance of the data should
also be assessed. From the requirements of data dis-
tribution, the problem arises that items that are only
relevant for a short period of time (e.g. daily news) are
rather less suitable for collaborative filtering, since in
principle few ratings can be expected. Historical rat-
ings are also less helpful when users’ tastes change
quickly (e.g., preferences for clothing items that have
since gone out of style) (Zhang et al., 2017; Linden
et al., 2003; Lee et al., 2012; Brusilovsky, 2007).
In the food sector, the temporal validity of the data
could play a subordinate role, since the tastes of the
customers are mostly habitualized or develop there
(Kaas and Dieterich, 1979).
2.2.5 Synonomy
Many recommender systems have problems when
similar and closely related products have different
names (e.g. clothes and dresses). Collaborative filters
are often not able to find a match between such items
and therefore do not calculate their similarity. This
problem is solved, for example, by the automatic term
expansion (Liphoto et al., 2016; Alani et al., 2000), as
well as the singular value decomposition (SVD) in the
context of MF (esp. Latent Semantic Indexing) (Sar-
war et al., 2001).
Again, food transaction data cause a problem,
because there are often many very similar names
for an almost identical product. For example, dif-
ferent names for the same mineral water (”Still”,
”Sparkling”) could lead to model inaccuracies. Here,
Recommender Systems in Food Retail: Modeling Repeat Purchase Decisions on Transaction Data of a Stationary Food Retailer
27

extended methods of term expansion or machine
learning methods for word embeddings, i.e. the re-
construction of linguistic contexts based on words,
should be used (Gong, 2010; Lawo et al., 2020).
3 INTEGRATION OF THE TIME
FACTOR
Most recommendation systems are based on static
principles, as they only take into account information
about whether a user buys a product or not. How-
ever, the time factor is also already integrated in some
recommendation systems. In principle, two types of
time-based data are distinguished in the literature:
The product introduction time and the time of pur-
chase (implicit) or evaluation (explicit) (Park and Lee,
2006). Tang, Winoto, and Chan integrate temporal
characteristics of items to reduce relevant candidate
sets in the context of movie recommendations (pro-
duction year), improving the accuracy of recommen-
dations (Tang et al., 2003). Ding, Li, and Orlowska
consider user rating time to optimize an item-based
collaborative filtering system. Here, weights are cal-
culated based on the rating times of different items
(Ding et al., 2006). Lee, Park, and Park developed
a time-based collaborative filtering system using im-
plicit data (transactions). It is based on a time-based
pseudo-rating matrix that takes into account product
introduction time and purchase time under the as-
sumption that a user’s current preferences are dis-
proportionately influenced by more recent purchases
and that more recent items exhibit higher user interest
(Lee et al., 2008).
Lathia, Hailes, and Capra (2009) focus on the ef-
fect of weekly retraining within a CF algorithm as
a time-dependent predictive model. As an adaptive
temporal CF method, it adjusts the neighborhood size
of a k-Nearest Neighbor approach based on perfor-
mance measured up to the current time (Lathia et al.,
2009). Koren sees an inevitable need to incorporate
temporal changes into a recommender system. He de-
fines an MF model that analyzes temporal change be-
havior over the entire data history and validity (Koren,
2009). Cho, Cho, and Kim consider customer pur-
chase sequences over time to optimize recommenda-
tion quality. They use an extended customer-product
matrix, which shows the purchase times in addition
to the products. Furthermore, they cluster the trans-
actions into homogeneous subclusters using the self-
organizing map (SOM) technique. A change of the
cluster membership by each individual transaction of
a customer defines its purchase sequence. The time-
dependent change in a customer’s cluster membership
also enables prediction of a customer’s future pur-
chases. A recommendation is generated by the system
following the identification of the most similar pur-
chase sequences compared to the current customer,
generating a set of products that the active customer
has is most likely to purchase based on the N most fre-
quently purchased products in the cluster (Cho et al.,
2005).
The ”Eigentaste” algorithm of Nathanson et al.
analyzes the time-related changes in customer prefer-
ences when selecting a product to recommend based
on the last evaluation (Nathanson et al., 2007). Chu
and Park describe a machine learning algorithm that
can improve the recommendations of new products
by continuously updating time-based features (e.g.,
popularity, freshness) in relevant content profiles per-
sonalized (Chu and Park, 2009). The time factor is
also being integrated into initial Deep Learning ap-
proaches for recommender systems. Most companies,
which do not have access to long usage histories, have
so far had to resort to item-to-item recommender sys-
tems. Hidasi et al. use recurrent neural Networks
(RNN) to address the problem of only short session-
based datasets in a memory-based approach (Hidasi
et al., 2015).
4 REPEAT PURCHASE
RECOMMENDATIONS
The aspect of repeat purchases addressed in this pa-
per is dealt with only sparsely in the literature on rec-
ommender systems. Repeat purchases describe any
situation in which a customer buys more than one
unit of a product (Bhagat et al., 2018). A key pub-
lication on the topic of repeat purchase decisions for
brands is Ehrenberg’s Repeat Buying Theory. Ehren-
berg describes that most aspects of brand buying be-
havior can be explained in terms of just two variables.
These are the market penetration and the average pur-
chase frequency of a product, whereby even these two
variables correlate with each other. Furthermore, a
product purchase decision essentially depends on the
timing of the purchase of a specific product class as
well as the brand choice. Accordingly, almost all in-
fluences can be adequately explained if purchase fre-
quency processes are specified per brand (see Fig. 1)
(Ehrenberg, 2000; Silver, 1989).
Ehrenberg’s theory looks at the purchase histories
of individual users from consumer panels, i.e. the
chronological sequence of purchases in all of a cus-
tomer’s shopping baskets over a specific period of
time and a specific point of sale, to study the purchase
frequencies of a particular brand. It turned out that the
ICE-B 2021 - 18th International Conference on e-Business
28

Figure 1: Purchase Events as Independent Stochastic Pro-
cesses according to Ehrenberg (2000).
analysis should focus in particular on purchase occa-
sions, i.e. the frequency of purchase of one or more
items of a product at a specific time in a store, and not
on quantity or price. Repeat purchases can therefore
be described for a specific item by its market penetra-
tion and purchase frequency, where penetration rep-
resents the proportion of people who buy a particular
product in the first place and purchase frequency rep-
resents the average number of these customers who
buy at least one product in the period under consid-
eration. The average purchase frequency here repre-
sents the basic measure of repeat purchases (Ehren-
berg, 2000).
Ehrenberg distinguishes between three types of re-
peat purchases: 1) A customer may buy an item in
more than one purchase in a given period. Different
customers can be characterized by the number of their
respective repeat purchases of the product. 2) A cus-
tomer can buy an item in more than one period. 3)
A customer can buy several units in the same pur-
chase. For the problem definition of this paper, the
first point in particular comes into consideration. The
frequency distribution of (repeat) purchases and thus
the number of consumers who have made 0 or 1 or, in
the repeated case, 2, 3, 4, etc., purchases, can be de-
scribed by the Negative Binomial Distribution (NBD)
or the Logarithmic Series Distribution (LSD) (Bhagat
et al., 2018; Geyer-Schulz et al., 2001). Most products
in everyday life have a certain time interval between
the purchase of one product and the next (e.g. weekly
purchase of mineral water). However, certain branded
products in particular are rarely bought again, even
over a longer period of time. Many customers of a
brand buy a product only once, some twice, etc. Due
to a thus relatively small share of buyers of a branded
product in the population, the highest frequency is ob-
served among non-buyers (Ehrenberg, 2000). This re-
sults in a very skewed frequency distribution (Forbes
et al., 2011), which can theoretically be described by
a mathematical function. The underlying function to
fit the above problem is the NBD, with the LSD being
a simplifying approximation to the NBD (Ehrenberg,
2000).
Bhagat et al. (2018) further discuss different ap-
proaches for repeat purchase decisions. In contrast to
the models above, they aim to generate individual rec-
ommendations for repeat purchases. In doing so, they
shed light on the temporal dependencies between re-
peat purchases of products, as these depend on when
a product was last purchased and how quickly the cus-
tomer runs out of it (Bhagat et al., 2018).
Therefore, they assume that a customer who has
bought a product frequently in the past will buy it
again (Repeat Customer Probability Model, RCP).
The recommendations are ranked in descending order
according to the number of repeat purchases. How-
ever, the problem arises that frequently purchased
items are not relevant for a certain recommendation
period, but are still considered due to their high num-
ber of repeat purchases. Even the integration of a
certain time decay, which models repeated purchases
based on a specific half-life, would be problematic
due to the assignment of the highest rank directly af-
ter a repeat purchase, as this would increase the rank
in the recommendation list. It can be assumed that
the attractiveness of a product for repeated purchase
immediately following the purchase of this product
is rather low. In order to include the temporal rele-
vance of products, it is also discussed that the pur-
chase of items represents a periodic phenomenon and
is therefore subject to a certain time interval (Ag-
gregate Time Distribution model, ATD). Other ap-
proaches based on this idea are the Poisson-Gamma
model (PG) and the Modified Poisson-Gamma model
(MPG), which perform better due to the personal-
ization of purchase rates by a Bayesian Hierarchi-
cal Model (Bhagat et al., 2018; Chu and Park, 2009;
De Oliveira, 2013; Gopalan et al., 2015).
5 METHODOLOGY
5.1 Data
The data set includes eleven features: CustomerId,
ShoppingCartId, MarketId, Date, ShoppingCart-
Value, ItemId, ItemName, ItemQuantity, ItemPrice,
CategoryId, and CategoryGroupLevel. Some prod-
ucts with negative item price and negative item quan-
tity are included. They were mainly marked as NaN
(Not a Number) and describe items such as deposits
and empties, which are refunded to the customer.
Negative item prices and quantities as well as NaNs
are already removed from the data set before data
preparation, as they would distort the data analysis
due to their negative values. In addition, other items
with the designation ”deposit” or ”delivery” existed,
Recommender Systems in Food Retail: Modeling Repeat Purchase Decisions on Transaction Data of a Stationary Food Retailer
29

which were also deleted.
The reduced and cleaned dataset includes
49,920,981 transaction records. The transactions
took place between December 28, 2018, and April
29, 2019. Overall, while the data set has a wide
range of analysis capabilities with approximately
50 million transactions and 200 thousand products,
these already reveal likely weaknesses with respect
to modeling repeat purchase decisions. For example,
the average number of purchases per customer across
all products is 5.1 with a standard deviation of 5.6.
This indicates a high number of customers who also
purchase fewer products in the complete period under
consideration. The average number of products in
a shopping cart also confirms this impression with
only 1.27 items. The maximum number of items in a
shopping cart is only 22 for 200 thousand different
products. Accordingly, although there are many
individual purchases of specific products, there are
no frequent repeat purchases by a specific customer.
The number of purchases per customer is in the range
of one to two purchases in the considered period. The
number of one-time repeat buyers (loc) per product
is less than five in 50% of cases. The number of
repeat buyers (moc) is even less than three. These
key figures result in the Repeat Customer Probability
– i.e. the probability of a product being purchased by
a repeat buyer.
Since this is a time-dependent classification prob-
lem, the data is divided on the basis of a reference
date. The test data thus represent (actual) future trans-
actions of the customers, which are to be predicted by
the model and used for validation within the frame-
work of a confusion matrix with their specific key fig-
ures. Here, the due date was set at March 31, 2019,
and the last month of the data set thus serves as test
data. Accordingly, the training data set comprises
37,289,860 rows (74.7%), and the test data set in turn
12,631,121 rows (25.3%). In addition, it is assumed
that a customer’s purchase will only occur in the test
period if that customer purchased a product in both
training and test data (Bhagat et al., 2018).
Due to sparsely purchases at customer level (data
distribution), two models are to be evaluated for
the present data. These are the ATD model and
the MPG model. While the ATD model addresses
this weakness by considering the aggregated repeat
purchases per product, the MPG model analyzes
the personalized purchase rates of a product using
the Bayes approach as a probabilistic model-based
method.
5.2 Modeling
The problem of repeat purchase recommendations is
described as estimating the probability of a repeat pur-
chase as a function of time since his last purchase
of the item under consideration, given the customer’s
previous purchase history. Accordingly, the associ-
ated purchase probability density P
A
i
is to be esti-
mated for a future time interval t
k+1
assuming that a
customer C
j
has purchased an item A
i
k times in the
past with time intervals t
1
,t
2
, ..., t
k
. Thus:
P
A
i
(t
k+1
|t
1
,t
2
, ..., t
k
) (1)
It is supposed that the customer’s purchase times
for different products are independent (Bhagat et al.,
2018).
Furthermore, it is assumed that the above purchase
probability density is composed of two components.
Q
A
i
represents the probability of a repeat purchase of
a customer who buys a product for (k + 1)
t
h times
with k previous purchases. R
A
i
defines the probability
distribution of t
k+1
, which depends on the repeated
purchase of the item by the customer (A
i
= 1).
P
A
i
(t
k+1
|t
1
, ..., t
k
) ≈ R
A
i
(t
k+1
|t
1
, ..., t
k
) ·Q
A
i
(2)
Moreover, the time distribution R
A
i
(t
k+1
|
t
1
,t
2
, ..., t
k
) is supposed to be asymptotic to
R
A
i
(t | t
1
,t
2
, ..., t
k
) (Bhagat et al., 2018; De Oliveira,
2013; Trinh et al., 2014).
R
A
i
(t
k+1
|t
1
,t
2
, ..., t
k
) ≈ R
A
i
(t |t
1
,t
2
, ..., t
k
)
where :
Z
∞
0
R
A
i
(t)dt = 1;
Z
∞
0
P
A
i
(t)dt ≤ 1
(3)
The above mentioned RCP model serves as a ba-
sis for the following models in order to consider only
products that are suitable for repeat purchase. It is de-
fined by analyzing aggregate repeat purchase behav-
ior as the ratio of the number of customers who have
purchased a product A
i
more than once (moc) to the
number of customers who have purchased a product
A
i
at least once (loc). The derived repeat customer
rate RCP
A
i
approximates Q(A
i
) and without consider-
ing the time intervals between purchases also P
A
i
ac-
cording to the following formula (Bhagat et al., 2018;
Fader and Hardie, 2009):
RCP
A
i
=
moc
loc
,
P
A
i
(t
k+1
= t | t
1
, ..., t
k
) ≈ Q(A
i
) ≈ RCP
A
i
(4)
Only products with an RCP
A
i
> r
threshold
are taken
into account further.
ICE-B 2021 - 18th International Conference on e-Business
30

5.2.1 Aggregate Time Distribution Model
If there are only a few repeat purchases at the cus-
tomer level, but a large number of customers at the
product level who have bought the product repeat-
edly, a model is suitable which analyzes the aggre-
gated and time-based repeat purchase behavior across
all repeat purchasers of a product. This models the de-
termination of the probability distribution of the time
intervals (t) of repeat purchase of a specific product
across all repeat purchase customers. For this pur-
pose, Baghat et al. examined various distributions
in the context of determining mean time intervals for
each customer in a sample of repeat-purchased items,
and the log normal distribution achieved the best fit
(Heyde, 1963; Bhagat et al., 2018).
R
A
i
(t) =
1
√
2πt
¯
σ
i
exp
−
(lnt − ¯µ
i
)
2
2
¯
σ
2
i
,t > 0 (5)
Accordingly, the ATD model estimates the pa-
rameters of the log-normal distribution for each suit-
able repeat purchase product by fitting them to the
different repeat purchase time intervals t of all re-
peat customers. Here, Q(A
i
) represents a fixed con-
stant q for all products A
i
of a given time t. Recom-
mendations are made based on the descending order
of probability density P
A
i
(t) at a given time t using
P
A
i
(t
k+1
|t
1
, ..., t
k
) ≈ R
A
i
(t
k+1
|t
1
, ..., t
k
) ·Q(A
i
) (Bha-
gat et al., 2018; Heyde, 1963).
5.2.2 Modified Poisson-Gamma Model
A Bayesian model is assumed whose evidence is Pois-
son distributed and the prior on λ is a gamma prior
(PG model). It is subject, on the one hand, to the
assumption that successive repeat purchases are un-
correlated and that repeat purchases follow a homo-
geneous Poisson process with repeat purchase rate λ.
On the other hand, λ across all customers follows
a gamma distribution of the form α with an inverse
scale parameter β. The parameters of the product-
specific gamma distributions are estimated by fitting
them to the maximum likelihood estimators of the
purchase rates of repeat purchase customers. This is
followed by a Bayesian estimate of a customer’s re-
peat purchase rate based on the combination of the
prior distribution and the individual’s past purchase
history (Bhagat et al., 2018; Trinh et al., 2014):
λ
A
i
,C
j
=
k + α
A
i
t + β
A
i
,t > 0 (6)
In addition to the shape and scale parameters α
A
i
and β
A
i
of the gamma prior of product A
i
, k describes
the number of purchases of the specific product A
i
by customer C
j
. The elapsed time between the ini-
tial purchase of A
i
by C
j
and the current time, is ex-
pressed by t. Regarding recommendations, R
A
i
is as-
sumed to be Poisson distributed, with the inverse scale
parameter estimated using λ
A
i
,C
j
and the likelihood
function estimated using the following equation R
A
i
,C
j
(Gopalan et al., 2015; De Oliveira, 2013).
R
A
i
,C
j
(t) =
∞
∑
m=1
λ
m
A
i
,C
j
exp(λ
A
i
,C
j
)
m!
,t > 0 (7)
Here m represents the number of expected future
purchases and Q
A
i
is considered as a fixed constant
for all products A
i
. Recommendations are made by
classifying all items previously purchased repeatedly
by the customer based on their estimated probability
density P
A
i
in descending order at a given time t using
the equation 2 (Bhagat et al., 2018).
Unlike the classical Bayesian methods, the Bayes
estimation of the a priori distribution here is done em-
pirically using the underlying data, rather than defin-
ing it fixedly in advance without taking the data into
account. Therefore, this method is also titled Empir-
ical Bayesian Method. The PG model is thus a para-
metric Empirical Bayesian Model whose likelihood
and a priori distribution take simple parametric forms.
It approximates a Hierarchical Bayesian Model. The
Bayes theorem allows the individual purchase deci-
sions of a customer to be combined with the aggregate
purchase behavior of a product, thereby personalizing
this model. The PG model has already been used in
the past, but not yet in the context of stand-alone re-
peat purchase recommendations (Bhagat et al., 2018;
De Oliveira, 2013; Fader et al., 2005; Morrison and
Schmittlein, 1988; Sichel, 1982).
If λ is the purchase rate to be estimated at Y ∈
{0, 1, 2, ...}∈N
0
purchases occurred in period N, then
E(Y ) = Nλ describes the expected number of pur-
chases. Because λ follows a gamma distribution at
the product level, a maximum likelihood estimator
(MLE) of the gamma parameters Γ(α, β) for each
product of the respective repeat purchase customers
is established as
ˆ
λ =
Y
N
. Because Y represents the
number of purchases with the above expected value
E(Y ) = Nλ, the likelihood assumption is Y | λ ∼
Γ(α + Y, β + N). The Bayes estimator (a posteriori
mean) can be expressed as (Bhagat et al., 2018; Con-
sul and Jain, 1973; Sichel, 1982):
ˆ
λ
posterior
=
α +Y
β + N
(8)
Due to the estimation of the posterior distribution
of the purchase rate λ under the a priori assumption
Recommender Systems in Food Retail: Modeling Repeat Purchase Decisions on Transaction Data of a Stationary Food Retailer
31
of a gamma distribution, whose parameters are ap-
proximated via the MLE using the actual purchases
for each product, this is a parametric empirical Bayes
model, which is an approximation of a Bayesian Hier-
archical Model. The difference is that scale and shape
parameters (α, β) of the gamma prior are estimated
from the actual data rather than from additional hy-
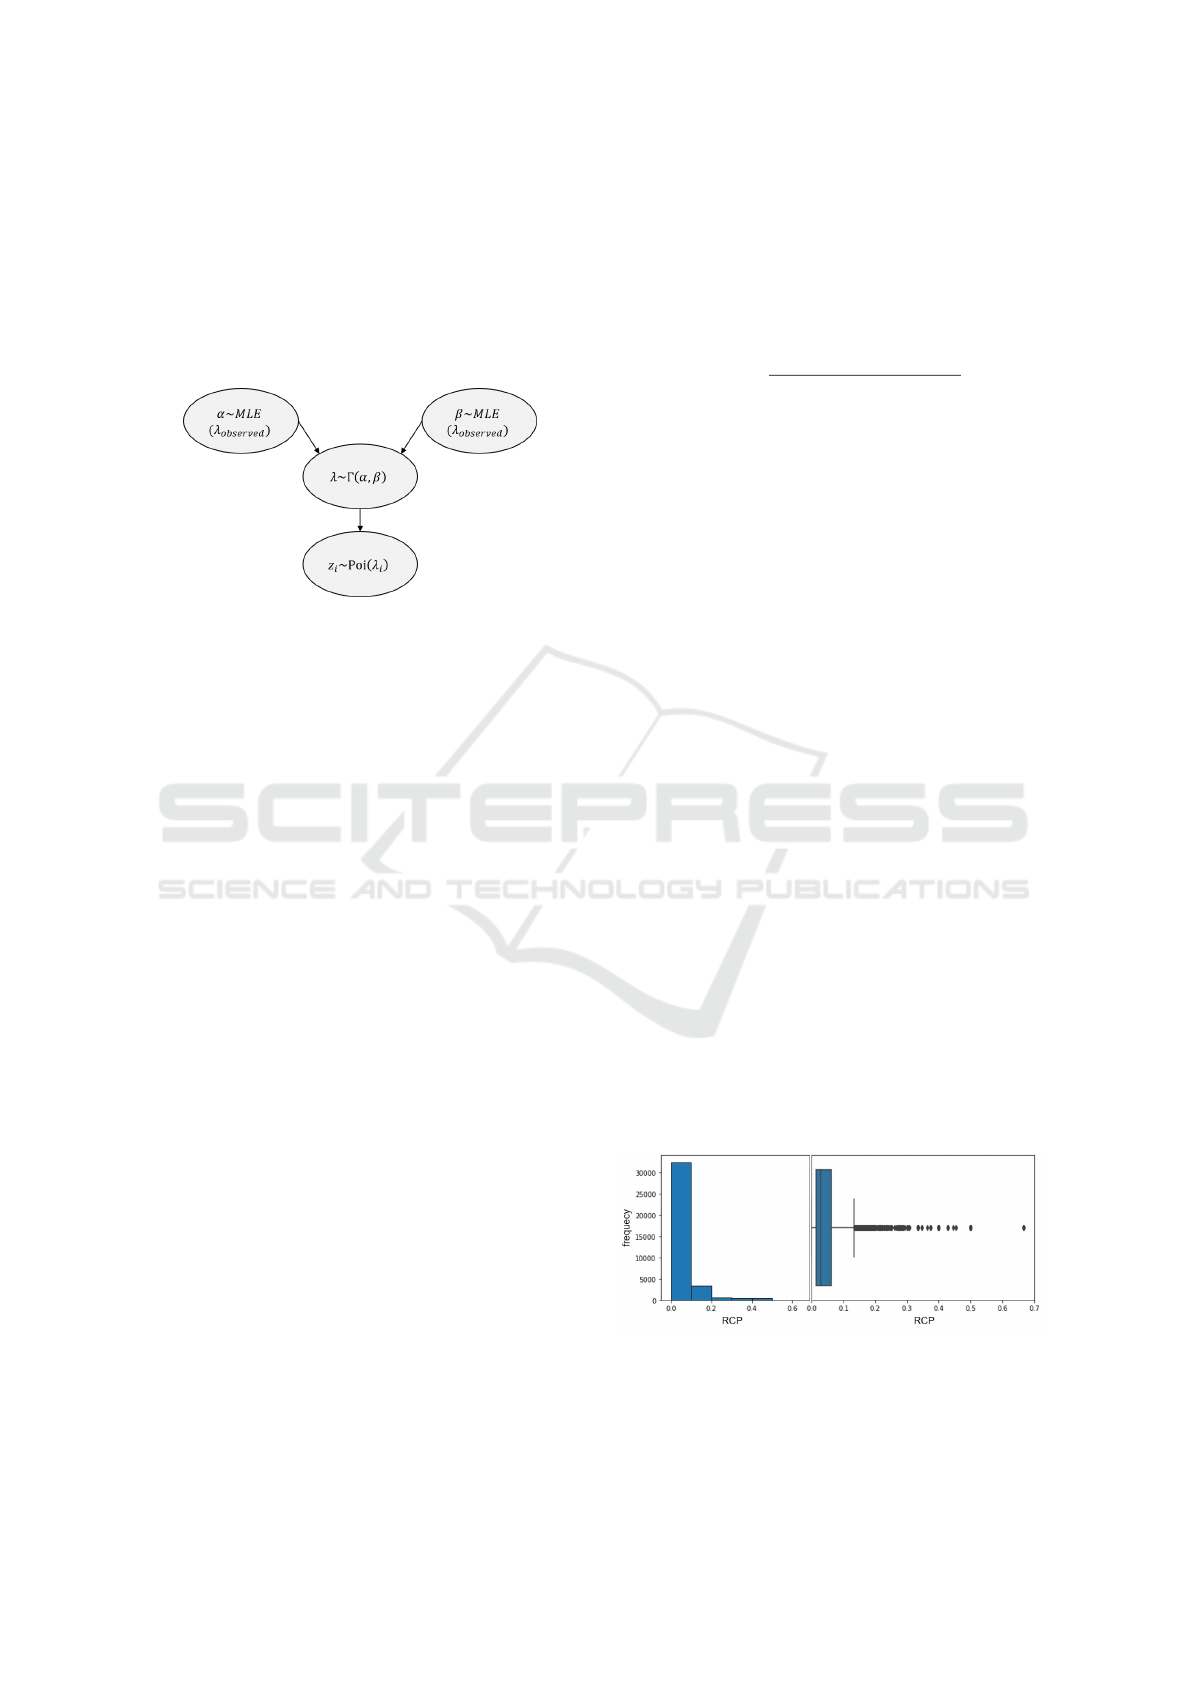
perprior parameters (see Fig 2).
Figure 2: Empirical Bayesian Model.
However, the assumption of a homogeneous Pois-
son distribution is not valid for any type of product
since the purchase events can theoretically represent a
time-independent constant. Therefore, the PG model
needs to be modified (MPG model). This is due to
the fact that a Poisson process represents a limiting
case of the sequence of Bernoulli processes in the
boundary between a large sample and a small con-
stant probability and is memoryless. However, this
is not expected for purchase behavior for a number
of products, since a customer’s need to repurchase an
item after purchasing it is initially small but variable
as time progresses (Bhagat et al., 2018;
¨
Ozekici and
Soyer, 2003; De Oliveira, 2013).
The MPG model assumes that a customer’s pur-
chases are correlated and repeat purchases follow a
modified Poisson process, which uses a single param-
eter λ as the repeat purchase rate. λ depends on the
last purchase of a product by the customer under con-
sideration. Thus, it differs by the homogeneous Pois-
son process in the PG model. Furthermore, a gamma
prior is assumed on λ. Thus, λ follows a gamma dis-
tribution of the form α across all customers with an
inverse scale parameter β (De Oliveira, 2013).
In analogy to the PG model, the estimates of the
parameters are made via a parametric empirical Bayes
model that fits them to the MLEs of customers’ re-
peat purchase rates. The estimation is optimized per
customer by estimating the mean time interval for re-
peated purchases of a specific item based on the first
and last purchases. The model assigns the observed
mean value to the associated highest repeat purchase
rate. This is achieved by making modifications to the
PG model: t
buy
denotes the elapsed time interval be-
tween the first and last purchase of product A
i
by cus-
tomer C
j
, t represents the elapsed time interval be-
tween the last purchase of A
i
by C
j
and the current
time. t
mean
represents the estimated mean time inter-
val of repeat purchases of A
i
by C
j
. For t < 2 ·t
mean
,
the estimation of the repeat purchase rate of the MPG
model is done according to (Bhagat et al., 2018):
λ
A
i
,C
j
=
k + α
A
i
t
buy
+ 2 ·|t
mean
−t|+ β
A
i
(9)
α
A
i
and β
A
i
are shape and inverse scale parame-
ters of the gamma prior of A
i
. k represents the num-
ber of purchases of A
i
by C
j
. If t ≥ 2 ·t
mean
, λ
A
i
,C
j
is determined via the separate formula of the MPG
model. This ensures that λ
A
i
,C
j
increases from t = 0 to
t = t
mean
and then decreases until t = 2 ·t
mean
. At this
point, the MPG model is equivalent to the PG model.
A Poisson distribution is further assumed for R
A
i
,
whose likelihood function is estimated using R
A
i
,C
j
(t)
of the PG model. Moreover, Q(A
i
) can be determined
via RCP
A
i
using equation 4. Recommendations are
generated by ranking all products in descending order
based on their estimated probability density P
A
i
(t) at
a given time t using equation 2 (Bhagat et al., 2018;
Consul and Jain, 1973; Gopalan et al., 2015).
6 RESULTS
The average RCP is 6.7% with a standard deviation of
12.7%. The median is 3.0%, which means that 50%
of the products have a higher and 50% a lower RCP.
However, products with a repeat customer probabil-
ity of 100% also occur and are excluded in the fol-
lowing. These are mostly products that have a very
low but equally high loc and moc frequency. Figure 3
provides information about the distribution of repeat
customer rates for all products. It can be seen that the
most frequent values are concentrated in the range of
a RCP < 0.2. Outliers are considered for all products
with a RCP > 0.13.
Figure 3: Distribution of Repeat Customer Probability.
Determining the threshold for products to be con-
sidered suitable for repeat purchase is therefore diffi-
cult. One study outlines that products are to be clas-
ICE-B 2021 - 18th International Conference on e-Business
32

sified as suitable for repeat purchase if they have a
RCP > 0.27 (McEachern, 2021). However, different
thresholds are tested to show the impact of RCP filter-
ing, as this is expected to have a large impact on the
model results.
6.1 ATD Model
Since many customers in the data set make only a few
repeat purchases, the ATD model draws on the aggre-
gate and time-dependent repeat purchase behavior of
all repeat purchasers of a product. Figure 4 shows
that the aggregated mean repeat purchase periods of
e.g. mineral water are approximately log-normally
distributed. Therefore, R
A
i
is determined over the in-
terval of the log-normal distribution.
Figure 4: Distribution of time intervals (t) for repeated pur-
chases of mineral water over all customers.
Since the purchase rates at the individual level are
often unrealistic due to sparse data, looking at the ag-
gregated purchase rates of products across all repeat
purchasers ensures considerable results (see Table 1).
Increasing the RCP further improves these. It can be
seen that an RCP of 25% provides the best results, a
further increase would lead to a model degradation.
6.2 MPG Model
At the beginning, the individual purchase rates of the
products are determined for each customer. An exem-
plary distribution of the purchase rates of mineral wa-
ter can be seen in the following Fig 5a). It shows that
the normalized a posteriori distribution of λ achieves
a good fit with respect to the data. The normalization
is stronger the closer the last purchase (t) is to the cur-
rent date (cf. Fig. 5b).
A conversion of the Bayesian estimators
ˆ
λ
posterior
to the actual observed purchase rates is still evident
(see Fig. 5 a, b). Even for long periods since the
last purchase, the purchase rates are well reproduced.
However, there is a general trend in that the closer
the first purchase of a product is to the cutoff date,
the more the purchase rates diverge. Figure 5 b) re-
veals that the estimate is more in line with the true
rate when the first purchase of a product was made
recently and a customer is simultaneously is a first-
time repeat buyer. Figure 5 c) shows the distributions
of the probabilities P
λ
(Y = 1) of all repeat buyers.
Table 1 shows that the MPG model outperforms
the ATD model. This is due to the fact that Bayesian
model-based methods can perform well with sparse
data (Isinkaye et al., 2015) and personalized pur-
chase rates are considered here. Also for the MPG
model, the best results are obtained with an RCP of
25%. Compared to the ATD model, the MPG model
leads on average to an improvement in precision@k
of 26.3%, recall@k of 21.1% and f1@k of 23.9%.
These are particularly driven by the increases under a
relatively small RCP of 7%.
7 DISCUSSION
7.1 Model Results
With regard to the problems of traditional recom-
mender systems, the model-based methods consid-
ered can reduce many weaknesses. They are suitable
for sparse data, which is achieved in the ATD model
by aggregations of the mean repeat purchase intervals
per product and complemented in the MPG model by
Bayesian personalization of purchase rates. The high
computational effort regarding memory-based meth-
ods is also improved here by using probabilistic mod-
els. The results show that the MPG model can outper-
form the ATD model. In particular, when a low RCP
is applied, the potential of the MPG model becomes
apparent (see Table 1).
Furthermore, in the food context, the model as-
sumptions show better suitability than similar models
discussed for repeat purchases in the marketing lit-
erature. These focus on repeat purchases of brands,
where the assumption is that an increasing time dif-
ference between the current date and last purchase re-
sults in a decreasing probability for a repeated pur-
chase (Miglautsch, 2000). Especially for food (e.g.
staple foods), the assumption is contradictory. Here,
customers are more likely to buy a product if this time
difference increases. This is, in particular, true as
brand loyalty is rather low, but products need to be
purchased frequently.
Nevertheless, MPG model errors often occured,
when a customer was rarely a repeat buyer and usu-
ally just before the set cutoff date, so a small number
of purchases were combined with a small time gap
from the first purchase of the product. This is pre-
cisely the case if the customer does not appear again
Recommender Systems in Food Retail: Modeling Repeat Purchase Decisions on Transaction Data of a Stationary Food Retailer
33
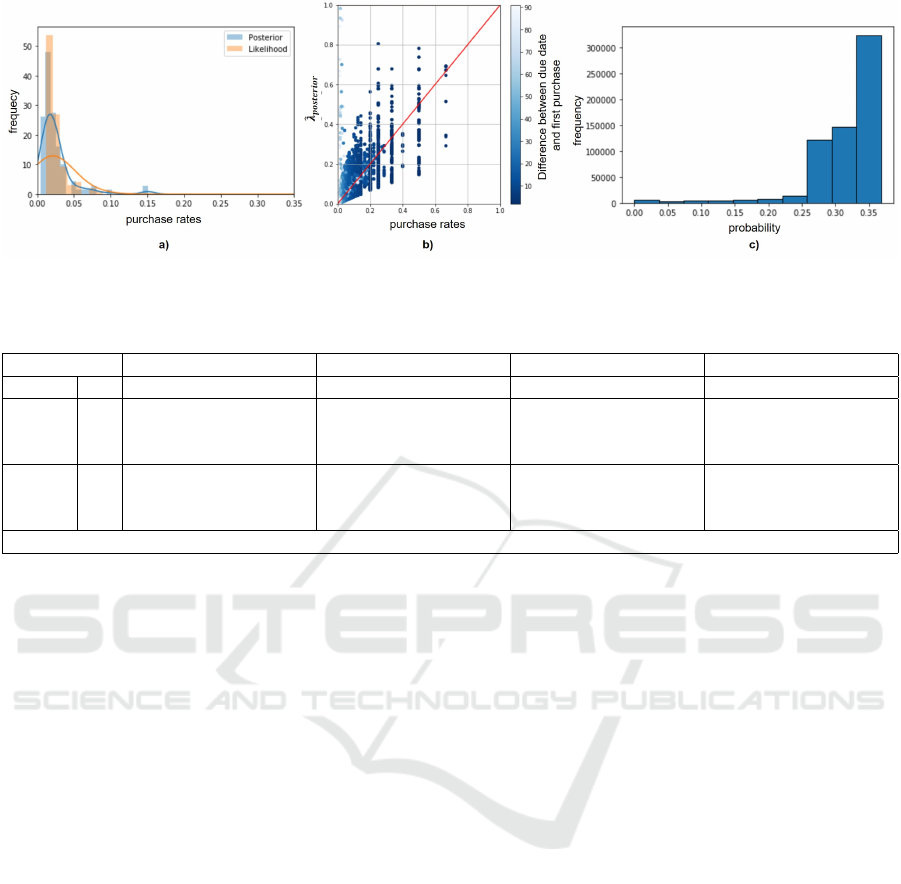
Figure 5: MPG-Model – a) Likelihood and a posteriori distribution of mineral water, b) residuals between true purchase rate
and the Bayes estimator and c) Distribution of probabilities of all customers for a purchase of mineral water within 30 days.
Table 1: Model Evaluation.
0.07 0.20 0.25 0.30
model k p@k r@k f1@k p@k r@k f1@k p@k r@k f1@k p@k r@k f1@k
ATD
1 0.14 0.16 0.15 0.22 0.36 0.27 0.23 0.37 0.28 0.09 0.14 0.11
5 0.14 0.22 0.17 0.23 0.38 0.29 0.24 0.38 0.29 0.10 0.15 0.12
10 0.15 0.22 0.18 0.23 0.38 0.29 0.24 0.38 0.29 0.10 0.15 0.12
MPG
1 0.17 0.24 0.20 0.24 0.40 0.30 0.27 0.42 0.33 0.12 0.16 0.14
5 0.22 0.27 0.24 0.24 0.42 0.31 0.28 0.44 0.34 0.14 0.20 0.16
10 0.22 0.27 0.24 0.25 0.42 0.31 0.28 0.44 0.34 0.14 0.20 0.16
where: p@k: precision@k, r@k: recall@k, f1@k: f1score@k
in the test data set and not regularly as a repeat buyer
of the product. This can be explained by the shift-
ing behavior of consumers, who frequently change
the point of purchase (e.g. supermarket and discount
store) or adopt different consumption behaviors (e.g.
going vegan) (Lawo et al., 2019; Stevens et al., 2017).
Further research should therefore address the integra-
tion of changing preferences and shopping habits.
7.2 Influence of the RCP
Since there is no explicit information on RCP in food
retailing in the literature, different thresholds were
tested here. The results show that the RCP has a
strong influence on the model quality. With increas-
ing filtering of the products regarding their probabil-
ity that a customer buys the product repeatedly, the
model quality increases significantly. As a study sug-
gests (McEachern, 2021), in this case an RCP of 25%
provides the best results. However, this is related to
a trade-off between model goodness and the product
variety considered, which – especially with sparsely
populated data – also filters products that normally
follow a habitualized and regular purchase process.
If an RCP of 0.3 is reached, there is a decline of
the model, because now mostly only products are con-
sidered, which combine low loc and moc values, re-
sulting in a tendentially high RCP.
8 CONCLUSION
This paper has focused on validating a time-based
recommender system for repeat purchase decisions
in food retailing. For this purpose, an introduction
to recommender systems was given at the beginning
and classical problems for transaction data of food re-
tail were derived. The consideration of state-of-the-
art solutions for the integration of a temporal com-
ponent into recommendations created a transition to
current models in the marketing literature. Two spe-
cific models were identified that deal specifically with
repeat purchase decisions. These were applied to a
real data set of a stationary German food retailer and
discussed with respect to the previously derived prob-
lems of recommender systems. It is shown that the
Modified Poisson-Gamma model is well suited for the
sparse data situation at hand, but that model inaccura-
cies occur due to different consumption and shopping
habits. Therefore, future research should focus on the
integration of these consumption patterns.
REFERENCES
Aggarwal, C. C. (2016). An introduction to recommender
systems. In Recommender systems, pages 1–28.
Springer.
ICE-B 2021 - 18th International Conference on e-Business
34

Alani, H., Jones, C., and Tudhope, D. (2000). Associative
and spatial relationships in thesaurus-based retrieval.
In International Conference on Theory and Practice
of Digital Libraries, pages 45–58. Springer.
Bhagat, R., Muralidharan, S., Lobzhanidze, A., and Vish-
wanath, S. (2018). Buy it again: Modeling repeat pur-
chase recommendations. In Proceedings of the 24th
ACM SIGKDD International Conference on Knowl-
edge Discovery & Data Mining, pages 62–70.
Bobadilla, J., Ortega, F., Hernando, A., and Guti
´
errez, A.
(2013). Recommender systems survey. Knowledge-
based systems, 46:109–132.
Breese, J. S., Heckerman, D., and Kadie, C. (2013). Empir-
ical analysis of predictive algorithms for collaborative
filtering. arXiv preprint arXiv:1301.7363.
Brusilovsky, P. (2007). Adaptive navigation support. In The
adaptive web, pages 263–290. Springer.
Chen, H., Chiang, R. H., and Storey, V. C. (2012). Busi-
ness intelligence and analytics: From big data to big
impact. MIS quarterly, pages 1165–1188.
Cho, Y. B., Cho, Y. H., and Kim, S. H. (2005). Mining
changes in customer buying behavior for collaborative
recommendations. Expert Systems with Applications,
28(2):359–369.
Chu, W. and Park, S.-T. (2009). Personalized recommen-
dation on dynamic content using predictive bilinear
models. In Proceedings of the 18th international con-
ference on World wide web, pages 691–700.
Clement, R., Schreiber, D., Bossauer, P., and Pakusch,
C. (2019). Intermediation: Direkte und indirekte
verkn
¨
upfung von angebot und nachfrage. In Internet-
¨
Okonomie, pages 153–204. Springer.
Consul, P. C. and Jain, G. C. (1973). A generalization of the
poisson distribution. Technometrics, 15(4):791–799.
De Oliveira, V. (2013). Hierarchical poisson models for
spatial count data. Journal of Multivariate Analysis,
122:393–408.
Dey, S., Mitra, P., and Gupta, K. (2016). Recommending
repeat purchases using product segment statistics. In
Proceedings of the 10th ACM Conference on Recom-
mender Systems, pages 357–360.
Ding, Y., Li, X., and Orlowska, M. E. (2006). Recency-
based collaborative filtering. In Proceedings of the
17th Australasian Database Conference-Volume 49,
pages 99–107.
Do, M.-P. T., Nguyen, D., and Nguyen, L. (2010). Model-
based approach for collaborative filtering. In 6th In-
ternational Conference on Information Technology for
Education.
Dokras, N. S. (2017). Prime Pantry Optimization: a cost
analysis and deep-dive in process improvement. PhD
thesis, Massachusetts Institute of Technology.
Ehrenberg, A. S. (2000). Repeat buying. Journal of Empir-
ical Generalisations in Marketing Science, 5(2).
Fader, P. S. and Hardie, B. G. (2009). Probability mod-
els for customer-base analysis. Journal of interactive
marketing, 23(1):61–69.
Fader, P. S., Hardie, B. G., and Lee, K. L. (2005). “counting
your customers” the easy way: An alternative to the
pareto/nbd model. Marketing science, 24(2):275–284.
Forbes, C., Evans, M., Hastings, N., and Peacock, B.
(2011). Statistical distributions. John Wiley & Sons.
Fu, X., Budzik, J., and Hammond, K. J. (2000). Mining
navigation history for recommendation. In Proceed-
ings of the 5th international conference on Intelligent
user interfaces, pages 106–112.
Geyer-Schulz, A., Hahsler, M., and Jahn, M. (2001). A
customer purchase incidence model applied to recom-
mender services. In International Workshop on Min-
ing Web Log Data Across All Customers Touch Points,
pages 25–47. Springer.
Gong, S. (2010). A collaborative filtering recommendation
algorithm based on user clustering and item cluster-
ing. JSW, 5(7):745–752.
Gopalan, P., Hofman, J. M., and Blei, D. M. (2015). Scal-
able recommendation with hierarchical poisson fac-
torization. In UAI, pages 326–335.
Heyde, C. C. (1963). On a property of the lognormal distri-
bution. Journal of the Royal Statistical Society: Series
B (Methodological), 25(2):392–393.
Hidasi, B., Karatzoglou, A., Baltrunas, L., and Tikk,
D. (2015). Session-based recommendations
with recurrent neural networks. arXiv preprint
arXiv:1511.06939.
Hofman-Kohlmeyer, M. (2016). Customer loyalty pro-
gram as a tool of customer retention: literature review.
In CBU International Conference Proceedings, vol-
ume 4, pages 199–203.
Hutapea, L. and Malanowski, N. (2019). Neue
gesch
¨
aftsmodelle in der ern
¨
ahrungsindustrie und im
lebensmitteleinzelhandel. Technical report, Working
Paper Forschungsf
¨
orderung.
Isinkaye, F. O., Folajimi, Y., and Ojokoh, B. A. (2015). Rec-
ommendation systems: Principles, methods and eval-
uation. Egyptian informatics journal, 16(3):261–273.
Jakobi, T., Stevens, G., Seufert, A.-M., Becker, M., and von
Grafenstein, M. (2020). Web tracking under the new
data protection law: Design potentials at the intersec-
tion of jurisprudence and hci. i-com, 19(1):31–45.
Johnson, S. C. (1967). Hierarchical clustering schemes.
Psychometrika, 32(3):241–254.
Kaas, K. P. and Dieterich, M. (1979). Die entstehung
von kaufgewohnheiten bei konsumg
¨
utern. Marketing:
Zeitschrift f
¨
ur Forschung und Praxis, pages 13–22.
Koren, Y. (2009). Collaborative filtering with temporal dy-
namics. In Proceedings of the 15th ACM SIGKDD
international conference on Knowledge discovery and
data mining, pages 447–456.
kumar Bokde, D., Girase, S., and Mukhopadhyay, D.
(2015). Role of matrix factorization model in col-
laborative filtering algorithm: A survey. CoRR,
abs/1503.07475.
Lam, S. K. and Riedl, J. (2004). Shilling recommender sys-
tems for fun and profit. In Proceedings of the 13th
international conference on World Wide Web, pages
393–402.
Lathia, N., Hailes, S., and Capra, L. (2009). Temporal
collaborative filtering with adaptive neighbourhoods.
In Proceedings of the 32nd international ACM SIGIR
Recommender Systems in Food Retail: Modeling Repeat Purchase Decisions on Transaction Data of a Stationary Food Retailer
35

conference on Research and development in informa-
tion retrieval, pages 796–797.
Lawo, D., B
¨
ohm, L., and Esau, M. (2020). Supporting
plant-based diets with ingredient2vec. 7th Interna-
tional Conference on ICT for Sustainability.
Lawo, D., Litz, K., Gromov, C., Schw
¨
arzer, H., and Stevens,
G. (2019). Going vegan: The use of digital media
in vegan diet transition. Proceedings of Mensch und
Computer 2019, pages 503–507.
Lee, J., Sun, M., and Lebanon, G. (2012). A compara-
tive study of collaborative filtering algorithms. arXiv
preprint arXiv:1205.3193.
Lee, T. Q., Park, Y., and Park, Y.-T. (2008). A time-based
approach to effective recommender systems using im-
plicit feedback. Expert systems with applications,
34(4):3055–3062.
Linden, G., Smith, B., and York, J. (2003). Amazon. com
recommendations: Item-to-item collaborative filter-
ing. IEEE Internet computing, 7(1):76–80.
Liphoto, M., Du, C., and Ngwira, S. (2016). A survey on
recommender systems. In 2016 International Confer-
ence on Advances in Computing and Communication
Engineering (ICACCE), pages 276–280. IEEE.
Loebbecke, C. and Picot, A. (2015). Reflections on societal
and business model transformation arising from digiti-
zation and big data analytics: A research agenda. The
Journal of Strategic Information Systems, 24(3):149–
157.
McEachern, A. (2021). What is a repeat customer and why
are they profitable? https://learn.smile.io/blog/repeat-
customers-are-profitable-and-we-can-prove-it.
Miglautsch, J. R. (2000). Thoughts on rfm scoring. Journal
of Database Marketing & Customer Strategy Manage-
ment, 8(1):67–72.
Miranda, T., Claypool, M., Gokhale, A., Mir, T., Murnikov,
P., Netes, D., and Sartin, M. (1999). Combining
content-based and collaborative filters in an online
newspaper. In In Proceedings of ACM SIGIR Work-
shop on Recommender Systems. Citeseer.
Morrison, D. G. and Schmittlein, D. C. (1988). Generaliz-
ing the nbd model for customer purchases: What are
the implications and is it worth the effort? Journal of
Business & Economic Statistics, 6(2):145–159.
Nathanson, T., Bitton, E., and Goldberg, K. (2007). Eigen-
taste 5.0: constant-time adaptability in a recommender
system using item clustering. In Proceedings of
the 2007 ACM conference on Recommender systems,
pages 149–152.
¨
Ozekici, S. and Soyer, R. (2003). Bayesian analysis of
markov modulated bernoulli processes. Mathematical
methods of operations research, 57(1):125–140.
Park, Y. and Lee, T.-Q. (2006). Using temporal informa-
tion in collaborative filtering: An empirical study. In
CSREA EEE, page 316. Citeseer.
Pitts, S. B. J., Ng, S. W., Blitstein, J. L., Gustafson, A.,
and Niculescu, M. (2018). Online grocery shopping:
promise and pitfalls for healthier food and bever-
age purchases. Public health nutrition, 21(18):3360–
3376.
Poggi, N., Muthusamy, V., Carrera, D., and Khalaf, R.
(2013). Business process mining from e-commerce
web logs. In Business process management, pages 65–
80. Springer.
Sarwar, B., Karypis, G., Konstan, J., and Riedl, J. (2001).
Item-based collaborative filtering recommendation al-
gorithms. In Proceedings of the 10th international
conference on World Wide Web, pages 285–295.
Sarwar, B., Karypis, G., Konstan, J., and Riedl, J. (2002).
Incremental singular value decomposition algorithms
for highly scalable recommender systems. In Fifth in-
ternational conference on computer and information
science, volume 1, pages 27–8. Citeseer.
Sichel, H. (1982). Repeat-buying and the generalized in-
verse gaussian–poisson distribution. Journal of the
Royal Statistical Society: Series C (Applied Statis-
tics), 31(3):193–204.
Silver, M. (1989). Repeat-buying: Facts, theory and ap-
plications. Journal of the Royal Statistical Society:
Series A (Statistics in Society), 152(3):420–421.
Stevens, G., Bossauer, P., Neifer, T., and Hanschke, S.
(2017). Using shopping data to design sustainable
consumer apps. In 2017 Sustainable Internet and ICT
for Sustainability (SustainIT), pages 1–3. IEEE.
Talasu, N., Jonnalagadda, A., Pillai, S. S. A., and Rahul, J.
(2017). A link prediction based approach for recom-
mendation systems. In 2017 international conference
on advances in computing, communications and infor-
matics (ICACCI), pages 2059–2062. IEEE.
Tang, T. Y., Winoto, P., and Chan, K. C. (2003). Scaling
down candidate sets based on the temporal feature of
items for improved hybrid recommendations. In IJ-
CAI Workshop on Intelligent Techniques for Web Per-
sonalization, pages 169–186. Springer.
Thorat, P. B., Goudar, R., and Barve, S. (2015). Survey on
collaborative filtering, content-based filtering and hy-
brid recommendation system. International Journal
of Computer Applications, 110(4):31–36.
Tintarev, N. and Masthoff, J. (2006). Similarity for news
recommender systems. In Proceedings of the AH’06
Workshop on Recommender Systems and Intelligent
User Interfaces. Citeseer.
Trinh, G., Rungie, C., Wright, M., Driesener, C., and
Dawes, J. (2014). Predicting future purchases with
the poisson log-normal model. Marketing Letters,
25(2):219–234.
Van Meteren, R. and Van Someren, M. (2000). Using
content-based filtering for recommendation. In Pro-
ceedings of the Machine Learning in the New Informa-
tion Age: MLnet/ECML2000 Workshop, volume 30,
pages 47–56.
Xu, G., Li, L., Zhang, Y., Yi, X., and Kitsuregawa, M.
(2011). Modeling user hidden navigational behavior
for web recommendation. Web Intelligence and Agent
Systems: An International Journal, 9(3):239–255.
Zhang, Z., Kudo, Y., and Murai, T. (2017). Neighbor
selection for user-based collaborative filtering using
covering-based rough sets. Annals of Operations Re-
search, 256(2):359–374.
ICE-B 2021 - 18th International Conference on e-Business
36
