
Towards Real Time Bottleneck Detection using Miniterms
J. Llopis
1,2 a
, A. Lacasa
1,2 b
, E. Garcia
1c
and N. Montés
2d
1
Ford Spain, Polígono Industrial Ford S/N, CP 46440, Almussafes, Valencia, Spain
2
Department of Mathematics, Physics and Technological Sciences, University CEU Cardenal Herrera,
C/ San Bartolome 55, Alfara del Patriarca, Valencia, Spain
Keywords: Bottleneck, Miniterm, Predictive Maintenance, Machine Effectiveness.
Abstract: The Sub-Bottleneck concept is introduced in this article for the first time. The literature defines the bottleneck
concept through the cycle time in which, as a general rule, the slowest machine with longer cycle time, is
classified as a bottleneck. Depending on the cycle time, the machine, the production line, the plant taken into
account, etc., the literature has defined the concept of bottleneck in plant, bottleneck in production line,
bottleneck in machine, etc. This article presents the Sub-Bottleneck concept for the first time. This concept
uses the mini-term, a cycle time of each component that makes up a machine to determine which is the slowest
and focus on future improvements that will optimize the efficiency of the production line. In order to validate
this proposal, the mini-terms have been implemented in a production line at the Ford factory in Almussafes
(Valencia, Spain), made up of 4 welding robots. The tests show the variable nature of the components and
that the typical bottleneck studied in the literature does not have to coincide with the Sub-Bottleneck concept.
1 INTRODUCTION
The industrial network of a country plays a very
important role in the country's own economy, this
network is nothing more than the set of processes that
are capable of transforming raw materials into a
product. These processes have their maximum
exponent in manufacturing lines where different
machines apply a series of operations to a product that
is transforming until it reaches its final condition
(Garcia, 2016).
It would be difficult to understand the successes
of any manufacturing company without taking into
account the manufacturing lines and their evolution
from the time of Henry Ford with the introduction of
chain production to the present day with the
revolution that new technologies are bringing about.
This development seeks to improve one of the most
important parameters of a production line: efficiency.
High efficiency is a competitive advantage over other
companies in the sector, the final objective is not only
to make the product, but to do it with the greatest
a
https://orcid.org/0000-0001-5543-2255
b
https://orcid.org/0000-0003-4379-0682
c
https://orcid.org/0000-0002-4210-9835
d
https://orcid.org/0000-0002-0661-3479
benefit possible and this benefit can be understood
under one premise: maximize the time that the
machine is productive.
Seeking to improve the efficiency of production
lines, the industrial revolution in the 19th century was
the point at which a new form of production emerged
in which workers began to have specialized functions
and use machines that increasingly helped to be more
efficient both in quality and in the production itself.
The manufacturing industry is one of the
industries where technology has had a great impact,
going from having machinery that helped workers
perform operations to having machines that are
capable today of performing jobs that were previously
carried out by several workers, again improving
efficiency.
As we have seen, efficiency has always been and
will always be one of the key points within this type
of companies, which is why a measure called Overall
Equipment Effectiveness (OEE) has been
implemented, the OEE is a parameter used in the vast
majority of the industries as it takes into account
various fundamental indicators in the manufacturing
Llopis, J., Lacasa, A., Garcia, E. and Montés, N.
Towards Real Time Bottleneck Detection using Miniterms.
DOI: 10.5220/0010552901650170
In Proceedings of the 18th International Conference on Informatics in Control, Automation and Robotics (ICINCO 2021), pages 165-170
ISBN: 978-989-758-522-7
Copyright
c
2021 by SCITEPRESS – Science and Technology Publications, Lda. All rights reserved
165

process, such as availability, performance and even
quality. Getting 100% OEE would mean that the
machine has been working the entire time at full
speed and without problems.
The concept of OEE was introduced in the OEE
as part of the Total Productive Maintenance (TPM)
methodology whose main objective pursues the
efficiency of the machines of an industry (Hedman,
Subramaniyan, & Almström, 2016).
Obtaining a 100% of OEE should be the objective
to be pursued, however, this objective is difficult to
achieve, especially when we talk about industries
whose machines have been working non-stop for
years and whose probability of failure increases
considering the life span of the same. Here is another
key concept, the maintenance of these machines
whose fundamental objective is keeping them in
optimal conditions.
For years when talking about maintenance within
the operations of a factory, what is known as
corrective maintenance and preventive maintenance
were treated from two points of view (Li & Ni, 2009).
The first happens as a result of a problem during the
operation of the machine, which may be a stoppage
or deterioration in the conditions of the machine that
make it impossible to achieve the manufacturing
objectives. The second concept aims to anticipate
these stops through a temporary planning in which
different checks are carried out on the machine, thus
being able to have it in optimal conditions, generally
for this reason. One of the keys to success to ensure
that the machine is in optimal condition is the
prioritization of maintenance orders (WO), the
industry has had limited resources especially in recent
times (Subramaniyan et al., 2020), in order to be able
to prioritize the WO and therefore for many years the
criterion has been based on the experts' opinion and
the analysis of repetitive failures of the machines
themselves along the time axis. These WOs will be
carried out on a scheduled basis throughout the
machine's useful life in opportunity windows (Chang,
Ni, Bandyopadhyay, Biller, & Xiao, 2007) in
maintenance, largely avoiding stops during
production.
In the time planning of the WO we can ask
ourselves: why carry out tasks on a scheduled basis?
New technologies offer us the possibility of
obtaining information from machines in real time,
which allows us to take a further step in maintenance
by introducing the concept of predictive maintenance.
Predictive maintenance proposes to carry out
maintenance only when the machine really needs it
and not on a scheduled basis like preventive
maintenance does.
2 PARADIGM OF THE
MAINTENANCE CURSE
In order to carry out an effective predictive
maintenance system, this system should be able to
monitor all the components in real time since, no
matter how insignificant a component may be, it can
fail and therefore cause a line stoppage. With current
systems this approach would be viable only through
the massive installation of sensors, vibration,
temperature, etc. However, in an industrial
environment this approach is completely unfeasible
due to the high cost it would entail. This is what has
been named as the paradigm of the maintenance
curse. The necessary technology and algorithms are
available but its massive use is unfeasible.
2.1 Short Terms
The works aimed at improving the efficiency carried
out to date focus on implementing programmed WOs
on an experience of failures of the machines
themselves, however one of the main characteristics
of production systems is their variability (Chang, Ni,
Bandyopadhyay, Biller, & Xiao, 2006), no process
remains constant over time due to the deterioration of
the machines that make up this process. The data
feedback given by the machines in real time manages
to provide tremendously useful information so as not
to depend on programmed WOs and to carry out
maintenance when the machine really needs it, thus
improving our efficiency not only at machine level
but also at the level of resources of the company itself.
2.2 Real-time Monitoring
One of the keys to predictive maintenance lies in the
ability to obtain information from the machines
themselves. For a long time, most factories have
worked with systems called Manufacturing
Execution System (MES) that allow gathering
information about production. However, nowadays
thanks to the advances of new technologies we are
able to collect a large amount of data about machines
that could provide us with information not on
production but on the health of the machine itself.
Being able to know why a failure occurred thanks to
the data collection allows us to pay special attention
to the elements that caused the failure (Arne, Ylipää
Torbjörn, & Bolmsjö Gunnar S., 2005).
If the way in which we consider this amount of
data is changed in order to try to analyse this data
immediately after it has been generated, this will
ICINCO 2021 - 18th International Conference on Informatics in Control, Automation and Robotics
166
allow us a new starting point within the maintenance
paradigm, and for this we must consider two main
steps (Chang et al., 2006):
• Real-time data collection and analysis.
• Dynamic corrections and WO planning
according to analysed data.
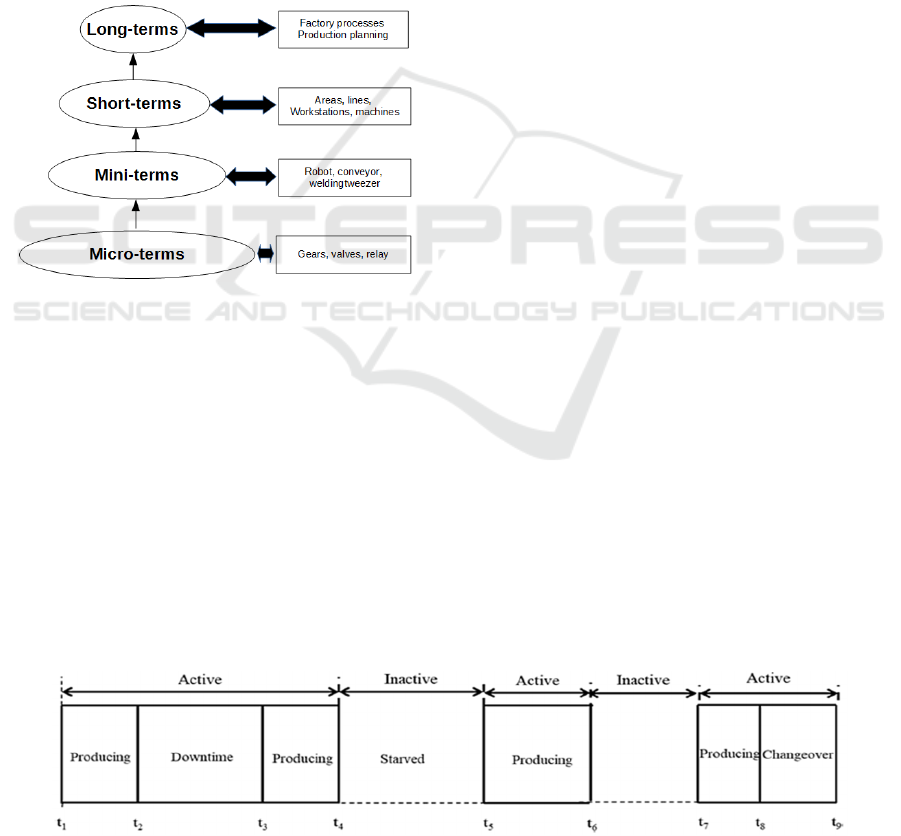
2.3 Mini-terms
So far all previous studies have classified the data
under two perspectives: long and short term.
Our line of work will be based on the use of a new
paradigm introduced with the redefinition of the short
term in smaller sub-periods, the Mini-terms, (Garcia,
2016; Garcia & Montés, 2018; Garcia & Montés,
2019).
Figure 1: Pyramid of terms.
While the short term is defined as the cycle time
it takes for a line, including a station, to perform its
task, the Mini-term is defined as the cycle time it
takes for the components of the line to do their task,
as for example, pneumatic grippers, robot arms,
clamps, cylinders, see figure 1.
Currently, the predictive maintenance approach
from the Mini-terms paradigm has its maximum
representation at Ford factory in Valencia where more
than 16,000 pieces of equipment are controlled in real
time. This control involves not only a 24-hour-a-day
surveillance of each of the equipment, but an
immediate response to the detection of deterioration
of some element of the monitored equipment thanks
to warnings generated in real time that reach the
maintenance teams, these warnings generate two
outputs simultaneously, one by email, and the other
by sending a message to any mobile device. In both
cases, an image at the time of deterioration and the
information corresponding to the line and station are
attached within these warnings, optimizing the
response time by the maintenance team (Garcia &
Montés, 2019).
3 BOTTLENECKS
As indicated in the introduction, production lines and
their components/ machines do not have an ideal
behaviour, and in addition, during their useful life
their behaviour may change. This implies that a
certain degree of imbalance is inevitable and
therefore, generating a time loss and turning the
element that suffers this time loss into what is known
as a bottleneck.
Most of the studies carried out to date try to
identify bottlenecks by associating them with
unplanned production shutdowns (Subramaniyan et
al., 2020), that is, shutdowns largely due to machine
failures. Trying to minimize these types of stops will
make the machine's OEE increase and therefore the
bottleneck will no longer happen.
Throughout the literature dedicated to the study of
bottleneck detection, different approaches have been
made (Betterton & Silver, 2012), showing two types
of states within the operation of a machine, active and
inactive state, (Subramaniyan et al., 2020) the first
being any state in which the machine is operating
without waiting, while in the second the machine is
stopped due to a wait either because it cannot
continue because the next operation is blocking it or
because it cannot start a new operation as it does not
have the necessary elements to start it: called starved,
see figure 2.
Currently, bottlenecks are always associated with
short and long-terms, therefore, the bottleneck from
the perspective of a line will be a station while from
the point of view of management it can be an entire
line or even a plant.
Figure 2: Operating states of a machine.
Towards Real Time Bottleneck Detection using Miniterms
167
In this article we propose to use the Mini-terms,
the cycle time of the components, to detect what has
been called Sub-Bottlenecks in order to determine
which component of the machine is behaving as a
bottleneck. Section 4 presents the definition of Sub-
Bottlenecks, section 5 presents the actual study
performed at a station where Sub-Bottlenecks have
been measured. Section 6 concludes with a discussion
of the preliminary and future results.
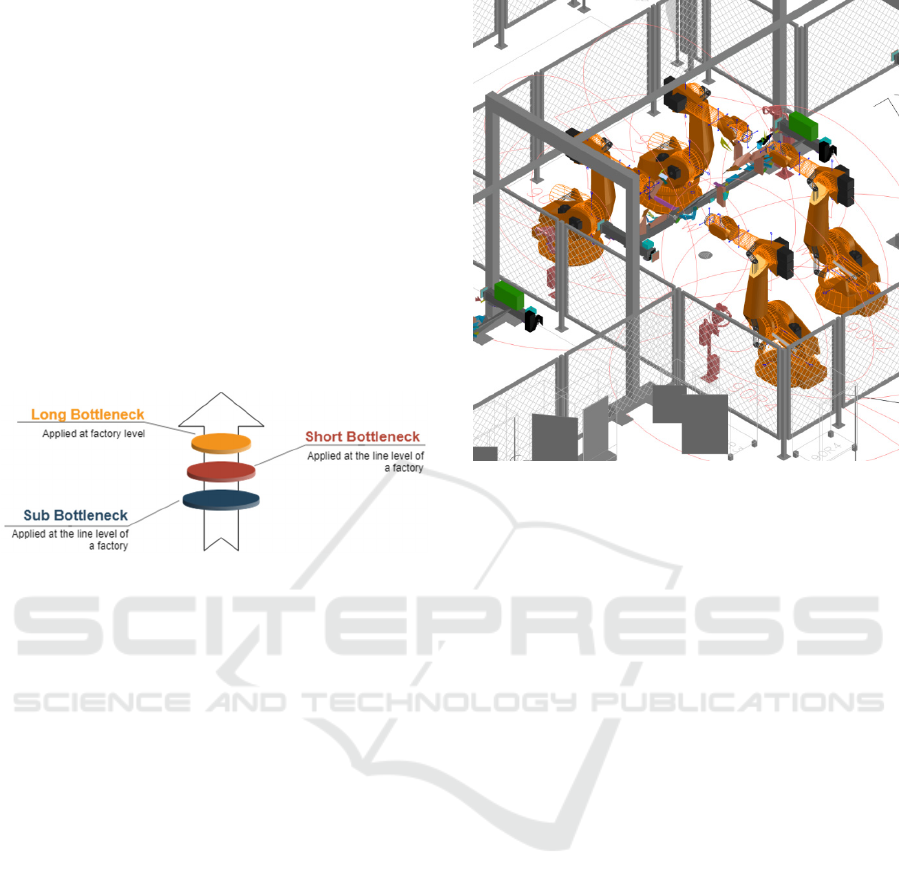
4 SUB-BOTTLENECKS
Based on the classification of cycle times defined in
Figure 1, we can define bottlenecks as shown in
Figure 3.
Figure 3: Pyramid of bottlenecks.
A Sub-Bottleneck can be defined as the
equipment that has a Mini-term longer than the rest of
the equipment in the line.
This article will focus on the analysis of the Sub-
Bottlenecks.
5 VALIDATION
To validate the relevance that Sub-Bottlenecks may
have in production, this study will focus on welding
stations. Welding units are one of the most commonly
used equipment in the automotive industry. This
usually consists of a robot arm and a welding clamp,
see figure 4. Welding lines usually consist of several
pieces of equipment that can work both in series and
in parallel. Although the welding units are made up
of the same components, their state of deterioration
may not be the same from one unit to another.
In this study, we have chosen a station of a
welding line at Ford Valencia automotive factory, this
manufacturing line called 7 includes one station
which consists of four welding robots, two placed in
the left part of part R1, R3 and two on the right side,
R2 and R4.
Figure 4: Weld line 7 – Ford Valencia.
In this station we have carried out the assembly of
a sub-set of the left side of one of the models
manufactured within the factory, this assembly begins
when a part enters the station and at that moment the
clamps close to ensure the position of the part, once
all the clamps have been closed, the work signal is
activated for the four robots. Each of the four robots
must perform a series of welding points on the part to
ensure its integrity.
We will redefine for each of these robots their
cycle time from the perspective of Mini-terms, with
which we will obtain that:
𝑇
𝑇
𝑇
𝑇
𝑇
Where:
• TC
,R1
: Cycle Time is the total time the robot
takes to do the necessary work on the station.
• THtW: Home to Wait Time is the time that the
robot uses from the first position, called Home
Position to the waiting position before starting
to work, this position is a safe position to
which the robot always goes back and it
happens before the part is correctly positioned.
•
TM
: Move On Time is the time in which the
robot is in motion from the start of the job until
it is finished.
•
TW
: Welding Time is the time in which the
robot is performing its work, in this case
making welding points on the part.
ICINCO 2021 - 18th International Conference on Informatics in Control, Automation and Robotics
168
• TSB: Starved
/
Blocked Time is the time in
which the robot is stopped waiting to be able
to carry out its work either due to lack of parts
(Starved) or because it cannot continue since
subsequent stations prevent the part from
coming out (Blocked).
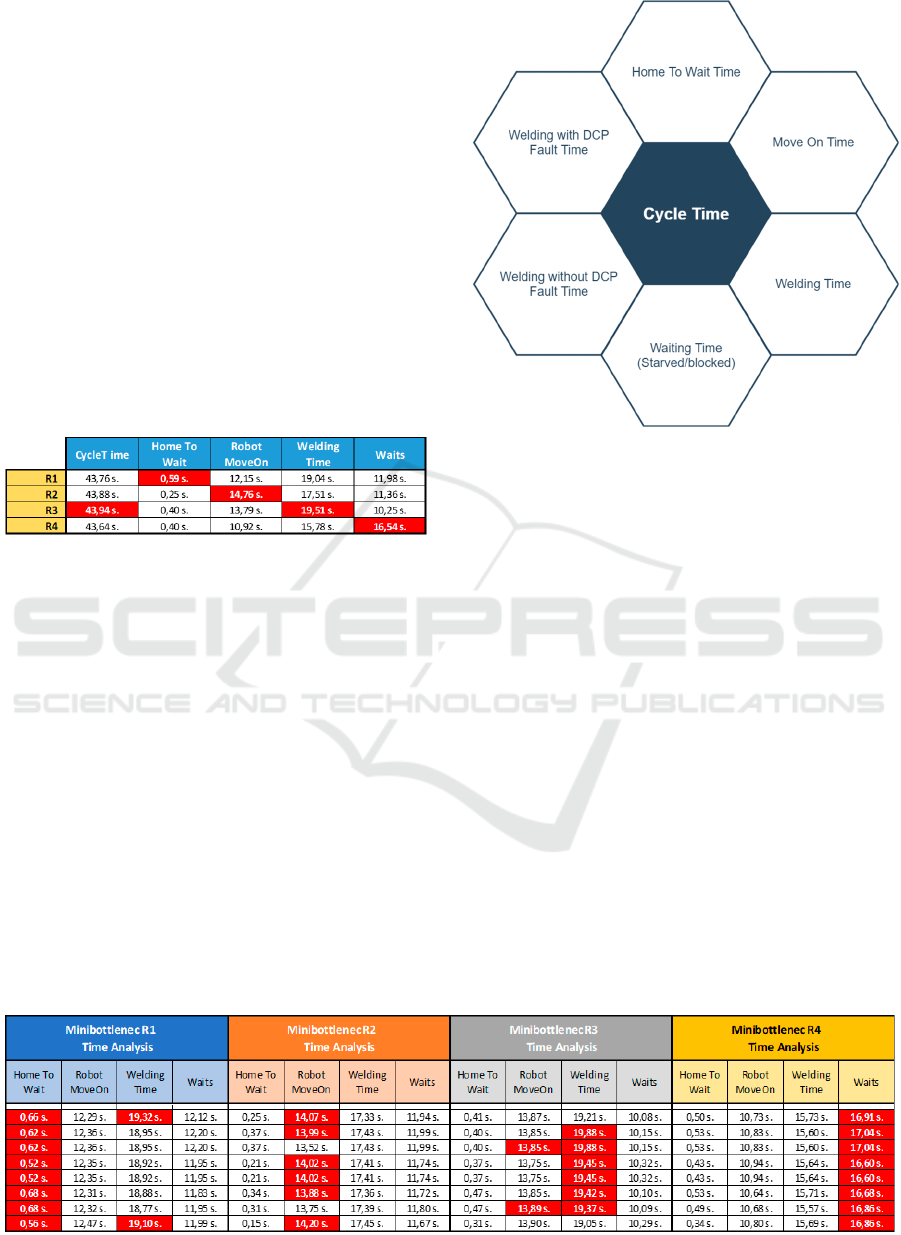
The diagram in Figure 5 shows the distribution of
sub-cycles times that make up the cycle time of a
welding station.
All Mini-terms are programmed in the line's PLC,
and the values obtained are sent to a NoSQL database
called Miniterm4.0 database. In table 1 we can see the
exact value of sub-cycle times of the station in line 7
in a specific cycle.
Table 1: Division of sub-cycle times of station in line 7. The
time marked in red indicates that this robot is the Sub-
Bottleneck.
With the current bottleneck methods, we would
only have the first column as data to analyse and
therefore the efforts would be focused on R3,
however, if we continue checking table 1 we can draw
conclusions that we could not even come up with
when using the current methods of bottlenecks.
By using each column as an independent variable
of the system, instead of analysing the R3 as the only
bottleneck to analyse we could analyse the different
bottlenecks according to the Mini-terms, that is, to
analyse the Sub-Bottlenecks so we could determine
that:
• Home To Wait: The R1 is the bottleneck.
• Robot Move On: The R2 is the bottleneck.
• Welding Time: The R3 is the bottleneck.
• Waits: The R4 is the bottleneck.
Figure 5: Sub-cycle time diagram.
Another characteristic we can observe throughout
several executions of the system is that the Sub-
Bottleneck is dynamic, so when depending on the set
of operations that take place in the station, it can vary
from cycle to cycle, however, despite the fact that this
variability exists we will consider as Sub-Bottleneck
the maximum time repeated. Next, we can see the
execution of several cycles of the station in line 7 and
the evolution of the Sub-Bottleneck throughout those
cycles, see table 2.
6 CONCLUSIONS
In this article, the Sub-Bottleneck concept, the
bottleneck component, has been defined for the first
time. The detection of Sub-Bottlenecks is a
fundamental step in predictive maintenance, it is not
only capable of identifying, thanks to the
fundamentals of Miniterms, which elements of a
Table 2: Evolution of SubBottleneck over several execution cycles. The red marking indicates that it is the SubBottleneck.
Towards Real Time Bottleneck Detection using Miniterms
169

manufacturing line are affecting the OEE in real time,
but it is also capable of opening a unique range of line
optimizations.
One of the conclusions that we can draw from the
present study is that the bottleneck examined in the
literature so far does not have to coincide with the
same one identified by the Sub-Bottlenecks, in fact in
a station we will only find the typical bottleneck and
a Sub-Bottleneck per Mini-Term analysed.
Being able to subdivide the times of each element
of the line as we have seen allows us to know, for
example, which robots have a higher workload,
welding time, despite not being the bottleneck, and
this could allow us to rebalance operations. We could
also identify which elements have longer waiting
times, to which we could apply speed reduction
algorithms in real time with the aim of providing a
lower consumption.
Our future work will be focused on two lines.
Firstly, the use of the information provided by the
Sub-Bottlenecks in order to improve the efficiency of
the production lines. Secondly, the improvement of
the subdivision of the welding line in mini-terms in
order to detect the Sub-Bottlenecks more efficiently.
For example, the times that there could be during the
welding process due to failure of this.
ACKNOWLEDGEMENTS
The authors wish to thank Ford España S.L. and in
particular the Almussafes Factory for the support in
the present research.
REFERENCES
Subramaniyan, M., Skoogh, A., Muhammad, A. S.,
Bokrantz, J., Johansson, B., & Roser, C. (2020). A data-
driven approach to diagnosing throughput bottlenecks
from a maintenance perspective. Computers &
Industrial Engineering, 150, 106851.
doi:https://doi.org/10.1016/j.cie.2020.106851
Betterton, C. E., & Silver, S. J. (2012). Detecting
bottlenecks in serial production lines – a focus on
interdeparture time variance. Int J Prod Res, 50(15),
4158-4174. doi:10.1080/00207543.2011.596847
Li, L., & Ni, J. (2009). Short-term decision support system
for maintenance task prioritization. International
Journal of Production Economics, 121(1), 195-202.
doi:https://doi.org/10.1016/j.ijpe.2009.05.006
Chang, Q., Ni, J., Bandyopadhyay, P., Biller, S., & Xiao, G.
(2007). Maintenance opportunity planning system.
Journal of Manufacturing Science and Engineering,
129(3), 661-668. doi:10.1115/1.2716713
Chang, Q., Ni, J., Bandyopadhyay, P., Biller, S., & Xiao, G.
(2006). Supervisory factory control based on real-time
production feedback. Journal of Manufacturing
Science and Engineering, 129(3), 653-660.
doi:10.1115/1.2673666
Arne, I., Ylipää Torbjörn, & Bolmsjö Gunnar S. (2005).
Reducing bottle‐necks in a manufacturing system with
automatic data collection and discrete‐event simulation.
Journal of Manufacturing Technology Management,
16(6), 615-628. doi:10.1108/17410380510609474
Hedman, R., Subramaniyan, M., & Almström, P. (2016).
Analysis of critical factors for automatic measurement
of OEE. Procedia CIRP, 57, 128-133.
doi:https://doi.org/10.1016/j.procir.2016.11.023
Garcia, E. (2016). Análisis de los sub-tiempos de ciclo
técnico para la mejora del rendimiento de las líneas de
fabricación. PhD
Garcia, E., Montes, N, (2018). Mini-term 4.0. A Real-time
Maintenance Support System to Prognosticate
Breakdowns in Production Lines. In Proceedings of the
16th International Conference on Informatics in
Control, Automation and Robotics (ICINCO 2019),
pages 180-187
Garcia, E., Montés, M. (2019). Mini-term, a novel
paradigm for fault detection. IFAC-PapersOnLine, vol.
52, n. 13. Part of special issue: 9th IFAC Conference on
Manufacturing Modelling, Management and Control
MIM 2019.
ICINCO 2021 - 18th International Conference on Informatics in Control, Automation and Robotics
170
