
A Network based Approach for Reducing Variant Diversity in
Production Planning and Control
Shailesh Tripathi, Sonja Strasser and Herbert Jodlbauer
University of Applied Sciences Upper Austria, Austria
Keywords:
Discrete Event Simulation, Network Analysis, Bipartite Graph, Community Detection, Production Planning
and Control, Data Mining.
Abstract:
This paper presents a network-based procedure for selecting representative materials using routings of mate-
rials as features and applies this procedure to a sheet metal processing case study which is used for parame-
terizing discrete event simulation models for PPC control. The discrete event simulation model (simgen) is a
generic and scalable model that is commonly used to deal with optimization problems in production planning
and control, such as manufacturing resource planning. The preparatory steps of discrete event simulations for
production planning and control are data preprocessing, parameterization, and experimental design. Given
the complexity of the manufacturing environment, discrete event simulation models must incorporate appro-
priate model details for parameterization and a practical approach to experimental design to ensure efficient
execution of simulation models in a reasonable time. The parameterization for discrete event simulation is not
trivial; it requires optimizing parameter settings for different materials dependent on routing, bill of materials
complexity, and other production process-related features. For a suitable parameterization that completes the
execution of discrete event simulation in an expected time, we must reduce variant diversity to an optimized
level that removes redundant materials and reflects the validity of the overall production scenario. We employ
a network based approach by constructing a bipartite graph and Jaccard-index measure with an overlap thresh-
old to group similar materials using routing features and identify representative materials and manufacturing
subnetworks, thus reducing the complexity of products and manufacturing routes.
1 INTRODUCTION
A competitive and changeable market scenario,
customized-, personalized-, large volume-production,
and complexity of the production environment
present various challenges for production systems’
efficiency, performance, and customer satisfaction.
Therefore, a production company must formulate a
production plan, optimize orders, and deliver in a
planned way to the expected time frame, maintain-
ing the quality and cost. In this regard, produc-
tion planning and control (PPC) activities play an
important role in managing production-related prob-
lems due to the production complexities driven by
changing market scenarios, and allows manufactur-
ers to monitor and control the whole process effi-
ciently. PPC strategies ensure that materials, assem-
bly parts, and other resources for different produc-
tion phases are provided in the right quantity, at the
correct time and location. Therefore such strategies
optimize resource availability at a reasonable cost in
accordance with production requirements. In such
scenarios, the main objectives of PPC are to mini-
mize idle time for machines and other resources, min-
imize bottlenecks in routing, optimize run times and
set up times, minimize inventory cost, keeping in-
ventory levels low, and maximize customer satisfac-
tion by ensuring to meet production-related commit-
ments regarding product quality, quantity, and well-
timed delivery. The major challenges in PPC are to re-
duce work in progress, minimize shop floor through-
put times and lead times, lower stockholding costs,
improve responsiveness to changes in demand, and
improve delivery date adherence (Stevenson* et al.,
2005; Tseng and Radke, 2011).
PPC activities should be investigated systemati-
cally, and for this purpose various modeling methods
are used; the main methods are conceptual models,
analytical models, AI models, and simulation models.
Among these methods, simulation models are consid-
ered the most suitable for PPC because they can be
practically implemented, can consider uncertainties,
Tripathi, S., Strasser, S. and Jodlbauer, H.
A Network based Approach for Reducing Variant Diversity in Production Planning and Control.
DOI: 10.5220/0010552402410251
In Proceedings of the 10th International Conference on Data Science, Technology and Applications (DATA 2021), pages 241-251
ISBN: 978-989-758-521-0
Copyright
c
2021 by SCITEPRESS – Science and Technology Publications, Lda. All rights reserved
241

and can be adapted to complex manufacturing sce-
narios. Three common simulation methods for PPC
are discrete event simulation (DES), system dynam-
ics simulation, and agent-based simulation.
DES is applicable to a wide range of PPC prob-
lems (Jeon and Kim, 2016), and one example of a
discrete-event simulation model is simgen, a generic
and scalable simulation model that is commonly used
to deal with optimization problems in PPC (Altendor-
fer et al., 2016; H
¨
ubl et al., 2011; Kronberger et al.,
2006). Simgen can be used for any production struc-
ture and uses a hierarchical production planning con-
cept divided into the following three levels:
– Long-term. Capacity investment decisions, re-
source planning, and aggregate production plan-
ning.
– Medium-term. Includes shift model, overtime,
PPC methods such as material requirement plan-
ning (MRP) and constant work in progress (CON-
WIP), and production system structures such as
flow shop and job shop.
– Short-term. Includes various day-to-day opera-
tional planning details such as dispatching rules.
An advantage of the simgen model is its practical
application due to its input parameters. The input
parameters selected from Enterprise Resource Plan-
ning (ERP) system data are processed and stored in a
database. These sets of parameters are known as mas-
ter data parameters. The main master data parameters
are the bill of materials (BOM), routing sequence of
materials, qualification matrix, production planning
parameters for each item, shift calendars, skill groups,
total available employees, production program, ex-
pected forecasts of the final items, the customer’s de-
mand in terms of order size, and the customer’s ex-
pected lead time. The combined BOM and material
routing table (named as WS Master) contains three
attribute types:
– Parent. Parents can have one or more child items.
End products are always parents, and product sub-
assemblies can be a parent or child.
– Child. These are material variants and product
sub-assemblies required to build a parent item.
– Machine/workstation group. The machines (as-
signed machine IDs) or groups of employees
working at the workstations (assigned workstation
IDs) where items are assembled or produced.
In simgen, transaction data are employed for another
set of parameters that characterize probability distri-
butions and the corresponding parameter estimations.
The estimated distributions’ parameters are used to
randomly initialize processing, setup, sales data vari-
ables, repair time, delivery time, and production plan-
ning variables. The parameter selections and experi-
mental design are then applied to discrete event sim-
ulations for various PPC scenarios.
The PPC simulation parameterization follows
three steps:
– Creation of a production structure from master
data;
– Generation of various random variables for pro-
cessing time, set-up-time, mean time to repair,
mean time between failures, customer demand,
sales details, and lead time (customer required, re-
plenishment, delivery), performed by characteriz-
ing probability distributions and their parameters
based on transaction data;
– Experimental design, by varying different combi-
nations of parameters to match the optimization
problem’s objectives.
The discrete event simulation results are compared
and validated with previous years’ real-world busi-
ness results, for example, previous years’ real-world
inventory, work in progress, and service level data
for a manufacturing company. Further, the results are
evaluated by business experts for managerial insights
related to various production scenarios.
One of the challenges in discrete event simulation
using simgen is the computational time complexity,
because there may be a large number of product vari-
ants, but similar characteristics, if modeled in combi-
nation with heuristic optimization methods, can lead
to long execution times without generating useful re-
sults.
In realistic production scenarios, a large number
of variants with similar features (BOM, routing) may
add inappropriate model details and cause a simula-
tion model to take a long time to optimize PPC tasks.
Therefore, we must reduce the numbers of materi-
als and resources to reasonable numbers of groups,
which is done by finding representative materials and
resources for various similar or redundant routing se-
quences from the routing data obtained from the ERP
database. The preliminary steps are thus data and pa-
rameter selection. These preparatory steps for master
data and transaction data for various parameter set-
tings used by simgen are not trivial tasks; expert in-
sight is required for data prepossessing and select-
ing BOM data, representative materials, other rele-
vant parameters, and experimental designs. The most
straightforward approach to selecting representative
materials in order to reduce high variant diversity is to
apply unsupervised learning to group materials with
similar features. We apply a graph-based community
DATA 2021 - 10th International Conference on Data Science, Technology and Applications
242

detection and path-overlap approach by creating a bi-
partite graph representing material and routing rela-
tionships to group materials with similar features.
This study applies a data-mining approach entail-
ing graph-based community detection by constructing
a bipartite graph and Jaccard index measure with an
overlap threshold to group similar materials together
using routing features that identify the unique routing
of materials, identifying representative material and
manufacturing subnetworks, thus reducing the com-
plexity of products and manufacturing routes.
The remainder of this paper is organized as fol-
lows. In Section 2, related work on unsupervised
learning methods for grouping product processes in
industrial manufacturing is discussed. Section 3 dis-
cusses a framework for detecting representative mate-
rials with the construction of a bipartite graph, routing
features, and community detection algorithms. Sec-
tion 4 presents a case study using sheet metal pro-
cessing data. The final section concludes the paper.
2 RELATED WORK
Clustering or grouping methods applied in industrial
scenarios seek to manage complexities by grouping
many entities with similar features into smaller sub-
sets, thus reducing complexity and enabling several
production and planning-related decisions to be made
with higher competence. Various types of similar-
ity and distance-based methods can be applied, ac-
cording to the features of products, customer seg-
mentation, tools, parts, and operations, in order to
cluster them for purposes of production planning, re-
source sharing, tooling, anomaly detection, customer
service support, and operation management. (Jiao*
et al., 2005) proposes a method to develop a product-
process variety grid by integrating BOM data and
routing information. The product-process variety grid
allows configuration of product design in terms of
BOM and production process for a customer order.
The integration of product and process information
also allows the grouping of similar variants for vari-
ous purposes in industrial manufacturing (Choudhary
et al., 2009; Lin et al., 2017; Dogan and Birant, 2020;
Li et al., 2019).
References (Macchiaroli and Riemma, 1996;
Macchiaroli and Riemma, 1994) discuss clustering
methods to group operations that are shared by dif-
ferent parts on different machines. In a flexible man-
ufacturing process, each part requires a set of tools for
performing operations that are shared by other distinct
parts. For a part to be processed on the same machine,
tool exchange should be minimized, which lowers
the tools’ unavailability for parts. Clustering aims to
identify the group of part programs that require the
same tools. A clustering that identifies the same set of
operations allows effective production planning and
reduces manufacturing cost and time. Shabaka and
ElMaraghy (Shabaka and ElMaraghy, 2007) perform
clustering to group operation sequences that are to be
executed on the same set of machines. Hochd
¨
orffer
et al. (Hochd
¨
orffer et al., 2017) propose cluster-
ing methods for product variety management to re-
duce planning complexity when designing produc-
tion networks. References (Romanowski and Nagi,
2005; Chowdhury and Nayak, 2013) use a network-
based approach to estimate a symmetric difference
metric between unordered BOM trees where for the
same components and parts, the structure for different
BOM trees differs. The distance between BOM trees
is used to calculate a distance measure for clustering
similar BOM trees.
(Chowdhury and Nayak, 2014) uses an augmented
adjacency matrix of BOM data to compute a co-
sine similarity measure for grouping similar products.
Strasser et al. (Strasser and Peirleitner, 2017) use
cosine similarity for clustering materials into differ-
ent groups in order to identify representative materi-
als. However, the approach does not consider routing
paths and assumes that the workstation orders are the
same. Several studies (Bianchesi et al., 2019; Aksoy
et al., 2017; Dao et al., 2020) evaluate various clus-
tering, complex-network, and bipartite-network com-
munity evaluation methods, using benchmark data
that provide a general understanding to enable dif-
ferent clustering and community detection algorithms
to be applied effectively. The present study applies
a network-based approach to determine the represen-
tative materials and set of workstation networks used
for routing different groups of materials. The graph-
based approach has some advantages over standard
similarity measures and clustering. First, our data
are sparse in nature because the data contain < 0.02%
non-zero entries of a m×n data matrix where m and n
represent materials and routing features respectively.
Thus, a graph provides a simplified way of process-
ing the data for visualization, exploration, and non-
euclidean domain analysis. Additionally, the repre-
sentation by graph allows us to analyze various com-
plex characteristics of the networks such as neighbors,
paths, communities, node importance (page rank),
and various local and global measures. Various com-
munity detection algorithms are also used to reduce
the computational complexity when applying com-
munity detection methods. Various network-based
studies have proven such algorithms’ usefulness for
optimizing maintenance schedules, work-in-progress
A Network based Approach for Reducing Variant Diversity in Production Planning and Control
243

buffer extensions, flow controls, process planning,
and resource allocation in workstation/manufactur-
ing/production system networks (Yang et al., 2010;
Becker et al., 2011; Becker et al., 2014; Chen et al.,
2018). The objective of the analysis is to reduce
many materials into different groups that follow sig-
nificantly different routings and identify subcommu-
nities used to obtain a reduced number of materials
that represent a manageable variant diversity for sim-
ulation modeling. Additionally, we wish to develop
an approach that can be used as a quick and efficient
means of identifying communities in data represented
in various networks for visual exploration and analy-
sis by domain experts.
3 METHODS
Before discussing community detection and group
selection for representative materials, we define the
workstation network and bipartite network.
Workstation Network: For the workstation net-
work, we first construct a directed path graph, G
m
p
=
(V
m
p
, E
m
p
), of the routing sequence of each mate-
rial. The vertex set of each material m
p
is a set of
workstations, V
m
p
= {v
1
, ..., v
n
}, and edges, E
m
p
=
{e
1
, ..., e
n−1
} show routing, where e
k
= (v
k
, v
k+1
) for
every 1 ≤ i ≤ (n−1). The final network is constructed
as follows: G
ws
= G
m
1
∪ G
m
2
·· ·∪G
m
p
.
Routing Features: We use the edges of workstation
network, W
0
f tr
= E(G
ws
), as routing features to con-
struct bi-partite graph given below.
Construction of Bipartite-graph: Suppose we have
a set of work stations, V = {v
1
, v
2
, v
3
, . . . , v
n
}, and
material-set, M = {m
1
, m
2
, . . . , m
k
} of |M| materials.
Let G
m
p
= (V
m
p
, E
m
p
), a directed path graph of the
routing sequence of material m
p
. E
m
p
is the edge-
set, where, E
m
p
= {e
1
, . . . , e
n
} and e
k
= (v
k
, v
k+1
).
We use W
0
f tr
as a routing feature set, and construct
a bipartite-graph, G = (M,W
0
f tr
, E
m,w
); an edge, e
a
∈
E
m,w
, is drawn between m
p
∈ M and w
0
q
∈ W
0
f tr
if
w
0
q
∈ E(G
m
p
), where G
m
p
is the path graph for mate-
rial m
p
. To avoid confusion we use W
0
f tr
as a vertex set
which uniquely labels edges of graph G
ws
as a routing
feature.
3.1 Community Detection
In graphs, communities are subsets of nodes of a
graph that are connected strongly (high edge den-
sity) compared to the other nodes of the graph. Vari-
ous algorithms including graph clustering algorithms
are used to detect communities in various types of
network (Pes
´
antez-Cabrera and Kalyanaraman, 2017;
Tripathi et al., 2016; Zhang et al., 2019; Han et al.,
2017). Community detection algorithms identify
communities by partitioning vertices in a manner that
maximizes the modularity of the network. Modular-
ity measures for bipartite graphs include Newman’s
(Newman, 2006), Barbers’ (Barber, 2007), and Mur-
ratas’ modularity (Murata, 2009). Our analysis uses
three community detection algorithms: LP-BRIM,
LPAwb+, and biLouvain community detection algo-
rithms, applied for weighted, unweighted, and bipar-
tite graphs. The main purpose of selecting three algo-
rithms is that these algorithms are applicable for com-
munity detection in large bipartite graphs (Pes
´
antez-
Cabrera and Kalyanaraman, 2017) efficiently. The
second purpose is to compare the communities that
each algorithm identifies and the time complexity of
detecting communities in the networks. The third pur-
pose is to select an algorithm that can perform faster
for large bipartite graphs for interactive visual explo-
ration of bipartite graphs. Below we provide brief
overviews of the selected algorithms.
3.1.1 LP-BRIM
LP-BRIM (Liu and Murata, 2010) is a combination
of the label propagation (LP) algorithm and BRIM
(bipartite recursively induced modules) algorithm for
large bipartite graphs. In the first step, the LP al-
gorithm provides an initial partition of the bipartite
graph, and in the second step, the partition is refined
by the BRIM algorithm using Barber’s modularity.
LP is divided into following steps:
1. Let G = (U,V, E) be a bipartite graph.
2. Assign unique labels to nodes in U.
3. Propagate labels from U to V and vice versa, until
modularity increases.
4. Label each node with the label with highest num-
ber in its neighbourhood.
5. Divide U and V into, C = {C
1
,C
2
, . . .C
k
}, k, com-
munities.
BRIM is divided into following steps:
1. Let S = [R
|U|×|C|
, T
|V |×|C|
]
T
, where S is an index
matrix which denotes the values of U and V be-
longing to particular partitions of C. Let N denote
total iterations.
2. Calculate Barber’s modularity using partition ma-
trix S acquired from LP.
3. Use the partition of R vertices and induce a new
partition of T .
DATA 2021 - 10th International Conference on Data Science, Technology and Applications
244

4. Calculate Barber’s modularity with the new parti-
tion and compare with step 2; if the modularity is
higher, update the partition C.
5. Repeat until N iterations.
Barber’s Modularity is calculated as follows: The
adjacency matrix for the bipartite graph of block-off
diagonal is defined as:
A =
"
0
|U|×|U|
e
A
|U|×|V |
e
A
T
|V |×|U |
0
|V |×|V |
#
.
Let P define the probability matrix of randomly
connected vertices U and V .
P =
"
0
|U|×|U|
e
P
|U|×|V |
e
P
T
|V |×|U |
0
|V |×|V |
#
,
where
f
P
i j
=
k
i|i∈U
k
j| j∈V
|E|
, k
i
is the degree of the i
th
node.
Barbers’ modularity for a bipartite graph is:
Q =
1
|E|
|U|
∑
i=1
|V |
∑
j=1
f
B
i j
δ(c
i
, c
j
),
where
e
B =
e
A −
e
P, C
i
, C
j
are the communities of i
th
and j
th
nodes where i ∈ U and j ∈ V.
3.1.2 LPAwb+
The LPAwb+ algorithm (Beckett, 2016) follows two
steps to perform community detection. The first step
is the bottom-up approach using the LP method by
asynchronous updating of labels that maximize mod-
ularity locally of the bipartite graph, as described in
Section 3.1.1.
The second step is the top-down approach where
two communities C
a
and C
b
, both of which consist of
U and V labels, are merged if the Barbers’ modularity
statistic is highest when comparing C
a
and C
b
with
all other communities. This merging step is repeated
between all communities if the resulting modularity
is improved.
3.1.3 BiLouvain
This algorithm provides a faster implementation of
community detection for bipartite graphs (Pes
´
antez-
Cabrera and Kalyanaraman, 2017) using the follow-
ing steps:
1. Let G = (U,V, E, w) be a bipartite graph, assign
nodes in U and V with n
1
and n
2
community la-
bels, i.e., n
1
= |U| and n
2
= |V |, and calculate ini-
tial modularity.
2. For each u
i
∈U and v
j
∈V, for each node (U ∪V ),
find candidate communities for which merging
the node into that community would result in a
modularity gain.
3. From the candidate communities, select a com-
munity that maximizes the modularity gain and
exceeds a defined threshold.
4. Perform a graph compaction, i.e., generate a new
graph, G
0
= (U
0
,V
0
, E
0
, w
0
), where U
0
, V
0
are ver-
tices that are created by collapsing vertices in the
same community, and edges E
0
between com-
munities are generated by collapsing edges con-
necting two communities c
i
(U) and c
j
(V ). Edge
weight w
0
is the sum of total edges between com-
munities c
i
(U) and c
j
(V ).
5. Repeat from step 1 for G
0
.
3.2 Jaccard Index
The shared routing features of material m
a
and m
b
,
using a Jaccard index (Jaccard, 1901), are calculated
as follows:
J(m
a
, m
b
) =
|W
0
(m
a
) ∩W
0
(m
b
)|
|W
0
(m
a
) ∪W
0
(m
b
)|
.
Here, W
0
(m
a
),W
0
(m
b
) ⊂ W
0
, provide a set of rout-
ing features of materials m
a
and m
b
from the directed
path-graphs, G
m
a
and G
m
b
.
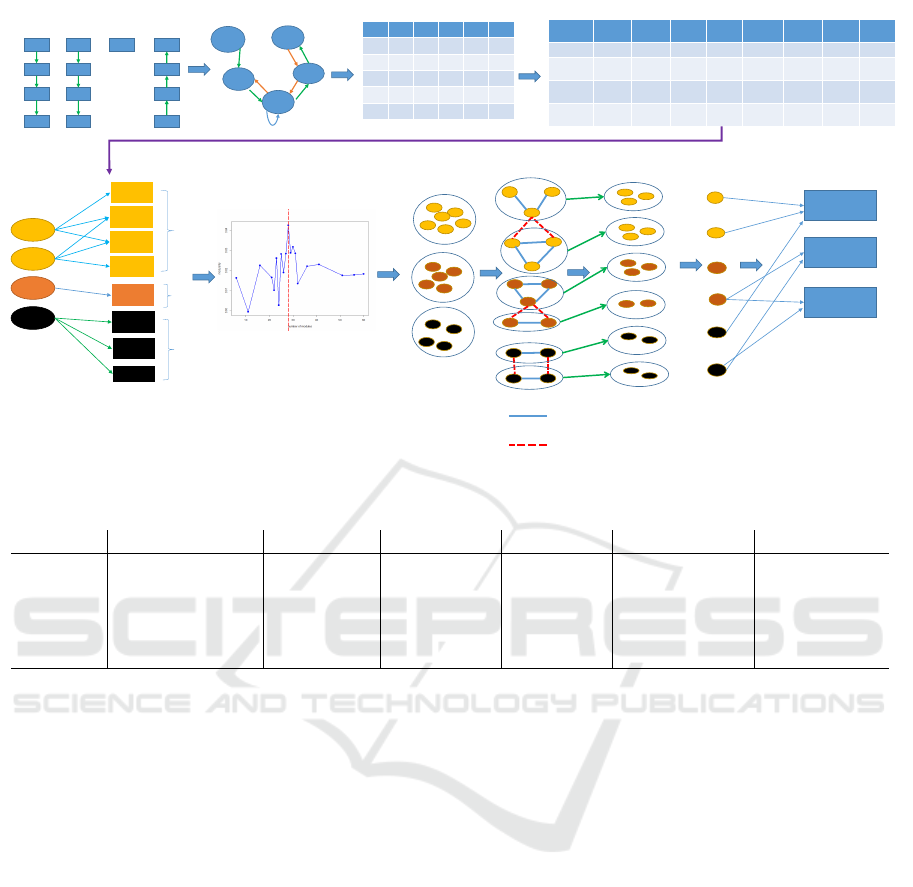
3.3 Representative Material Selection
The idea of using representative materials is to reduce
a large set of materials into a smaller subset of repre-
sentative materials with similar production character-
istics and reflecting the overall routing of workstation
networks similar to the complete workstation network
G
ws
. A simple approach to representative material se-
lection is to apply unsupervised learning or commu-
nity detection algorithms, using routing as features to
group similar materials. The representative material
selection approach is divided into five main steps.
The first step is to construct workstation networks
and use edges of the workstation networks as routing
features. The second step is to construct a bipartite
graph that connects each material m
i
to the routing
features (e
j
) if the material m
i
is processed between
the workstations represented as an edge feature, e
j
.
The third step is to identify communities in bipartite
graphs that provide different groups of materials and
workstation subnetworks. Each subnetwork and the
related materials in the group describe a load of mate-
rials in different subnetworks. The identified commu-
nities also allow us to identify different end-items and
their allocation in different subnetworks; the commu-
nities of subnetworks can be utilized to restructure the
workstation routing for different materials. The fourth
step is to identify path-overlaps of materials within
A Network based Approach for Reducing Variant Diversity in Production Planning and Control
245

the groups identified by community detection algo-
rithms and further identify subgroups with path over-
laps larger than the defined threshold (α). The differ-
ent subgroups can be optimized based on the selec-
tion of α, which identifies overlaps between routing
of two materials of a group. The fifth step is to map
groups of materials used for manufacturing end items
and select a representative material from each group.
A schematic diagram is shown in Figure 1. The al-
gorithmic implementation of the approach is shown
in Algorithm 1. The advantage of this approach is
that it explores materials, workstation subnetworks,
and path-overlap faster than the traditional approach
of clustering. The approach can produce represen-
tative materials based on the routing of the materi-
als and can generate several simulation scenarios for
workstation subnetworks. Additionally, routing in the
workstation-subnetworks can be rearranged and reas-
signed to different materials for efficient processing
for future manufacturing and can be used for discrete
event simulation purposes.
With this approach, a domain expert can utilize
network-based approaches to visualize and explore
the workstation network for routing various materials
and can select individual materials as representative
materials with other relevant details useful for PPC
optimization.
4 CASE STUDY
4.1 Data
Our analysis uses real-world manufacturing data from
a sheet metal processing operation. First, we export
data from the ERP system relating to BOM, routing
data with processing time at each workstation, and
other production planning parameters required for the
discrete event simulation. The BOM data contain ma-
terial IDs (unique), sub-assembly IDs, and the end
products and lot size policy for each material. Lot
size policies can be fixed order period (FOP), fixed
order quantity (FOQ), or consumption-based (CB).
The routing data contain material IDs, worksta-
tion IDs (unique), expected time spent at the corre-
sponding workstation, and operation sequence num-
bers defined by integer values. Individual material
IDs have multiple rows in the routing data with dif-
ferent sequence numbers, representing the complete
routing sequence of the material.
The BOM data and routing sequence data are in-
tegrated by joining both tables using the material ID
as the primary key. The joined table is called a master
table; an example master table is shown in Table 1.
Algorithm 1: Algorithm for communities and material
grouping.
Preprocess the data, D, by integrating BOM data
and routing data.
Construct a workstation network G
ws
= (V
ws
, E
ws
),
where e
i
= (v
i
, v
j
)|e
i
∈ E
ws
is an ordered set of ver-
tices.
Construct a bipartite graph, G = (M,W
0
f tr
, E
m,w
)
from D.
Perform the community detection algorithm on G.
Let there be C = {C
1
,C
2
, . . .C
k
}, k non-overlapping
communities of materials and routing features
identified.
L = {} empty list
for i = 1 to k do
Let set M
i
contain materials of community C
i
for j = 1 to |M
i
| − 1 do
e
a
= W
0
f tr
(m
j
)
for l = (j+1) to |M
i
| do
e
b
= W
0
f tr
(m
l
)
ji = jaccard(e
a
, e
b
)
if ji ≥ α
L = append(L, {m
j
, m
l
})
end for
end for
end for
Use L as an edge list and construct graph G
m
(L).
Cmp= BFS(G
m
(L)) and obtain a set of discon-
nected components of G
m
(L). BFS (breadth first
search) returns the set of disconnected components
as subgraphs from G
m
(L)
Total groups of material are |Cmp|.
Let I = I
1
, I
2
, . . . I
p
end items; each end item is a set
of materials grouped in different communities.
Let Cmp(I
p
) ⊂ Cmp be a subset of subgraphs
where materials for end item I
p
are grouped
Select the highest degree material from each
Cmp(I
p
), where p = {1, 2, . . . , |I|}, as representa-
tive material.
This preparation step yielded 387,367 items of data,
which comprise 127 vertices (workstations) and 657
edges (routing features).
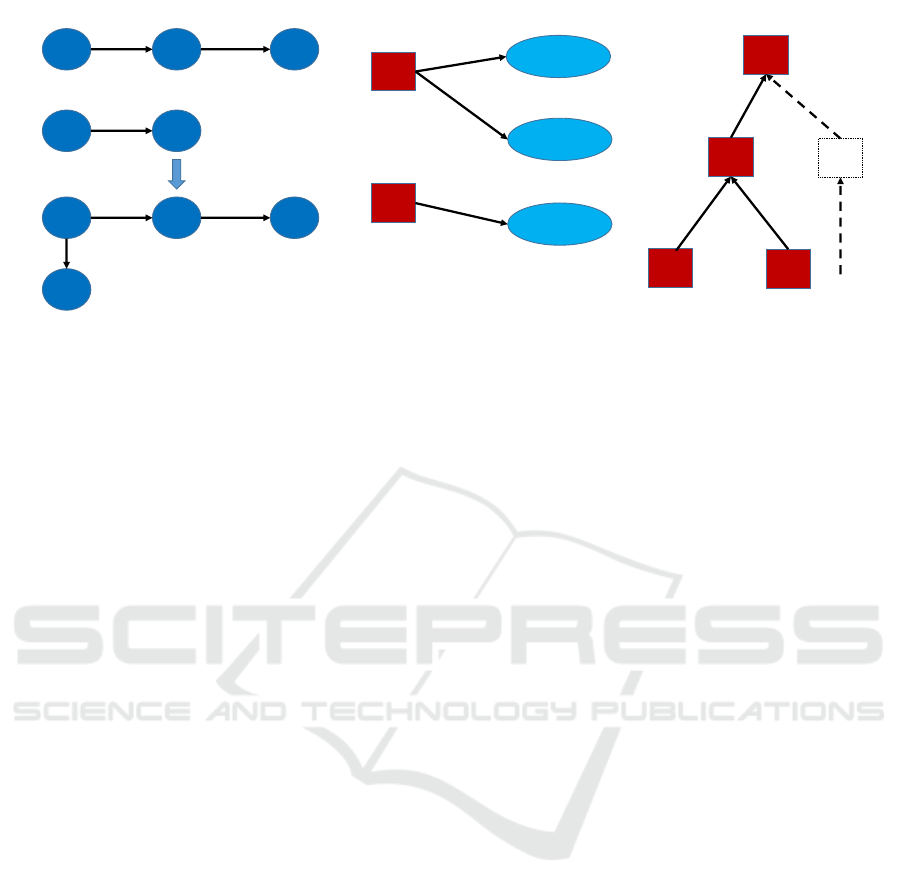
In the master data set, the workstation network is
constructed using data from the Workstation column
and corresponding process IDs to decide the direc-
tionality (routing) of each item. The bipartite net-
work, G, is constructed using data from the Material
ID column and the routing features of the workstation
network, obtained by ordered pairs of process IDs for
each material and shown as edges in the workstation
network. The BOM network, G
BOM
, is constructed by
combining the End item, Subassembly ID, and Mate-
rial ID columns. Examples are shown in Figure 2.
DATA 2021 - 10th International Conference on Data Science, Technology and Applications
246
W1 W2 W3 W4 W5
W1 1
W2 1
W3 1 1 1
W4 1 1
W5 1
w1
w2
w3
w4
w2
w3
w4
w5
w3 w2
w3
w4
w5
Material 1 Material 2
Material 3
Material 4
w3
w1
w2
w4
w5
Adjacency matrix
w1->w2 w2->w3 w3->w4 w4->w5 w3->w3 w2<-w3 w3<-w4 w4<-w5
Material 1 1 1 1 0 0 0 0 0
Material 2 0 1 1 1 0 0 0 0
Material 3 0 0 0 0 1 0 0 0
Material 4 0 0 0 0 0 1 1 1
routing features (to seprate reverse routes)
w1
->w2
w2
->w3
w3
->w4
w4
->w5
w3<
-w4
w3
->w3
w4<
-w5
w2<
-w3
m1
m2
m3
m4
Bipartite Graph
Community 1
Community 2
Community 3
Apply community detection algorithms
(e.g. Bilouvain)
Select communities based on modularity
Workstation Network
Calculate jaccard index between materials of
the community based on routing features
Communities
(materials)
Jaccard index>= α
Jaccard index< α
Sub communities
(materials)
Selecting a representative
from each subcommunity
Representative
materials
End item 1
End item 2
End item 3
Map representative
materials to the end
items if the
corresponding
subcommunity consists
material which is used
for the end item
Figure 1: Schematic diagram of representative material analysis from ERP data.
Table 1: Example master table joining BOM data and routing sequence data.
End item Subassembly ID Material ID Workstation Process ID Lot size policy Standard time
A SA1 M00001 W1 1 FOP1 0.20
A SA1 M00001 W2 2 FOP1 0.25
A SA1 M00001 W3 3 FOP1 0.25
A SA1 M00002 W1 1 FOP2 0.15
A SA1 M00002 W4 2 FOP2 0.20
For representative material selection, different groups
of materials are mapped to corresponding end items
where the material of the end item resides and the
prominent material is selected as the representative
material for each end item.
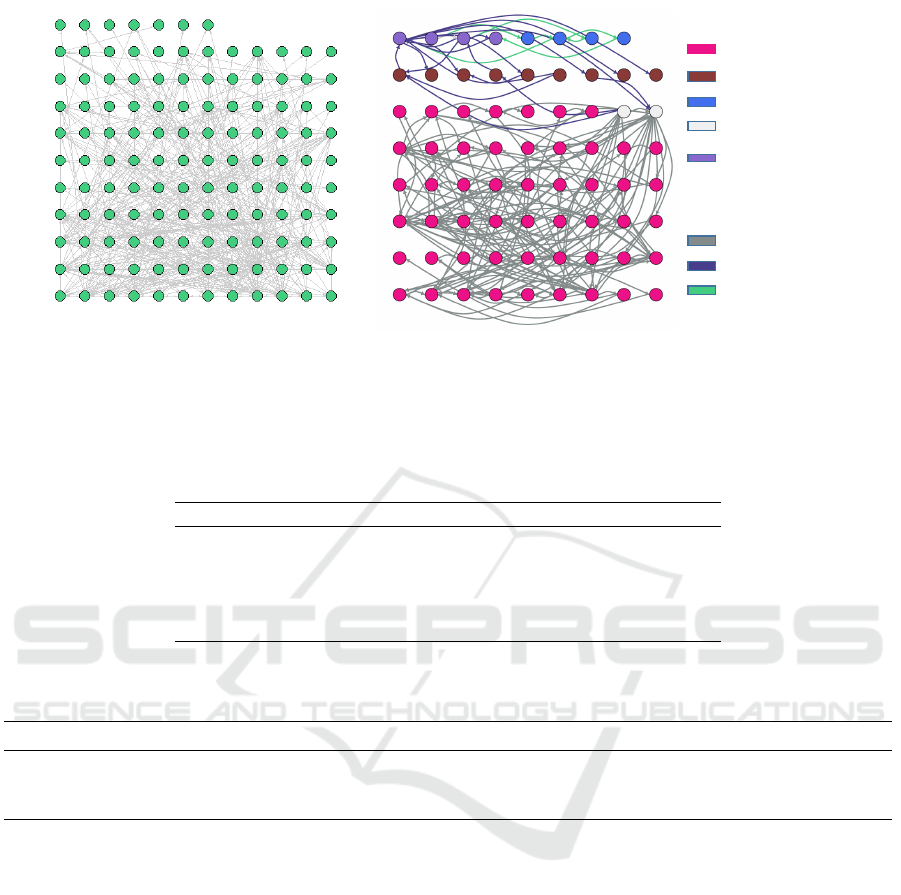
4.2 Results
After the data preprocessing steps, we constructed
a workstation network and bipartite network. The
workstation network G
ws
contains 127 vertices and
657 edges shown in Figure 3 (A). Thus we have 657
routing features for constructing the bipartite graph G,
which has vertices based on |M| = 29, 612 (materials)
and |W
0
f tr
| = 657 (routing) features. The three bipar-
tite graph algorithms were applied for obtaining mod-
ules in the bipartite network. The results are shown in
Table 2. The high modularities estimated by all three
algorithms show the presence of communities, which
do not overlap significantly with each other, imply-
ing that we can divide groups of materials and work-
station features into relatively independent sets (com-
munities). One example is shown in Figure 3(B). The
figure show subnetworks of three communities which
are obtained from the routing features in three differ-
ent communities from total of 76 communities iden-
tified by the biLouvain algorithm. The communities
are highlighted in different colors, denoting different
subnetworks of workstations constructed by selecting
routing features grouped in three different communi-
ties of the bipartite graph. The total number of mate-
rials processed in each of the three communities are
2, 219, 135, and 10 materials. Among the three algo-
rithms used, the biLouvain algorithm performs best;
its execution is faster and achieves higher modularity
than the other two algorithms. We next computed the
normalized mutual information (NMI) (Danon et al.,
2005) between communities obtained by the three bi-
partite algorithms, to examine the differences in the
sets of communities obtained. We compute NMI for
both types of vertices (M (materials) and W
0
f tr
(routing
features)) of the bipartite graph. The results are shown
in Table 3. The high NMI values between all al-
gorithms show that the detected communities exhibit
significant similarity for both types of vertices; how-
ever, they are not entirely the same because the num-
ber of detected communities and modularity measures
are not equal. This method may yield different re-
sults for subcommunity analysis. However, given the
performance information for the community detection
A Network based Approach for Reducing Variant Diversity in Production Planning and Control
247
W1 W2 W3
W1 W4
W1 W2 W3
W4
M01:
M02:
M01
M02
W1 ->W2
W2 ->W3
W1 ->W4
A
SA1
M01
M02
A1
Workstation network
Bipartite graph
BOM Structure
Figure 2: Different types of networks created from the master data shown in Table 1.
algorithms, the biLouvain algorithm performs better
and faster than the other two; therefore, it can be ap-
plied for identifying communities of bipartite graphs
constructed from materials and routing features of the
large ERP data.
In the next step, after obtaining the communi-
ties, we applied the Jaccard index to detect sub-
communities in each community based on routing
path overlap. We use path overlap α = 0.8, i.e.,
if two materials show an overlap in terms of Jac-
card index α ≥ 0.80, they both belong to the same
sub-community. We identified 1, 077, 1, 162, and
1, 154 sub-communities using LP-BRIM, LPAwb+,
and biLouvain algorithms, respectively. We select a
single material from each sub-community for repre-
sentative material selection, selecting that with the
maximum average path-overlap value (Jaccard in-
dex). However, one could adopt another method for
selecting the representative material from each sub-
community based on the material’s prominence or
other relevant features chosen based on domain un-
derstanding. The number of reduced materials is be-
tween 1, 000 and 1, 200, which is suitable for discrete
event simulation with simgen for representative mate-
rials. The other advantage of this approach is that we
can select each community, routing the community’s
subnetwork and the corresponding end-items existing
in the community for representative materials selec-
tion only from the community, using path overlap. We
can generate required parameters from master data for
each community for discrete event simulation and re-
duce the parameter space. The discrete event simula-
tion for independent communities can be applied for
simulation by selecting representative materials from
a single community.
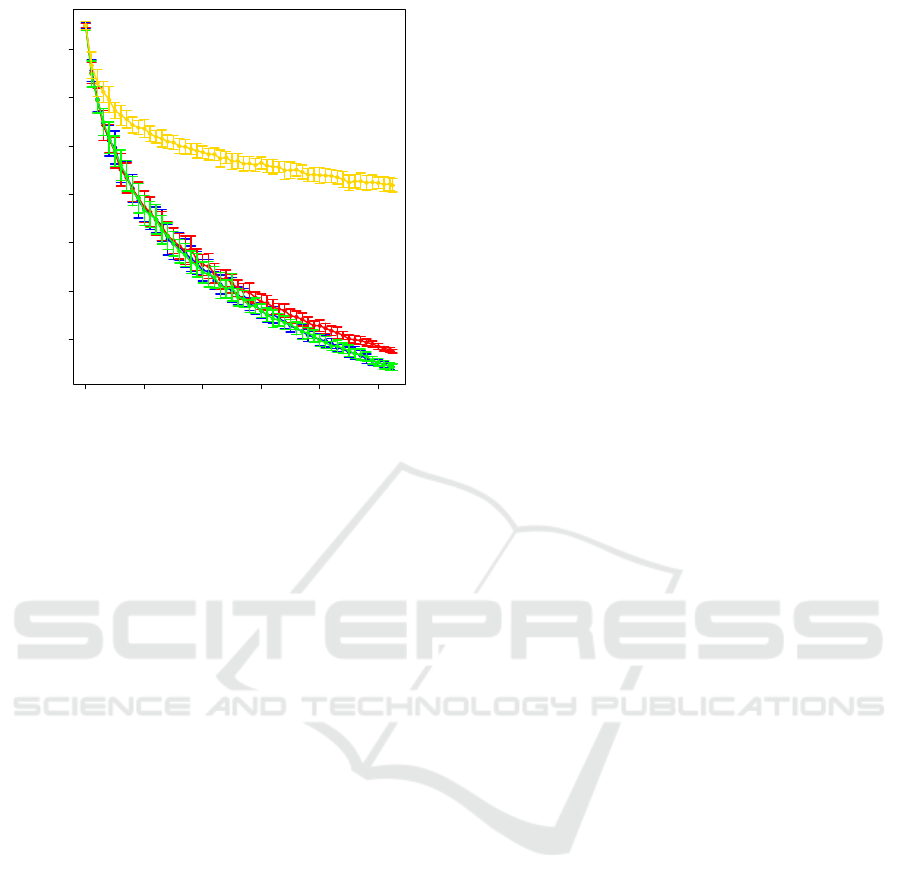
In the next step, we provide a comparative analy-
sis by calculating graph edit distance (GED) (Bunke
et al., 2007), we applied GED only for insertions
and deletions of vertices and edges, between work-
station network (G
ws
) and workstation subnetwork of
M
r
representative materials G
ws
(M
r
)|G
ws
(M
r
) ⊂ G
ws
from the subcommunities obtained from the commu-
nities identified by different community detection al-
gorithms and randomly selected materials (M
random
)
from the data. In this approach we first select a set
of representative materials, M
r
= {m
1
, m
2
, . . . m
n
}, by
randomly selecting a single material from each sub-
community and the corresponding routing features to
create subnetworks, G
ws
(M
r
), of workstations as dis-
cussed in Section 3. Similarly we select materials
randomly from the data and construct subnetworks,
G
ws
(M
random
), where |M
r
| = |M
random
|. We compute
GED between G
ws
and G
ws
(M
r
) and between G
ws
and G
ws
(M
random
); the results are shown in Figure
4. The idea of representative material selection is
to select representative materials from a large num-
ber of variants that follow similar production features
(routing) and reflect an overall routing of the work-
station network that is similar to the complete work-
station network G
ws
, when GED(G
ws
, G
ws
(M
r
)) ∼ 0.
The representative materials should be selected when
arg min
|M
r
|
GED(G
ws
, G
M
r
). From the analysis, we
see that the random selection does not converge to
GED ∼ 0 and is significantly higher than when the
same number of materials are selected based on the
three community detection algorithms.
5 CONCLUSIONS
In this paper, we applied a network-based approach
to identify groups of similar materials, considering
routing of materials as features of a manufacturing
company. The paper’s main aim is to design an ef-
DATA 2021 - 10th International Conference on Data Science, Technology and Applications
248
Vertices
Edges
Community 1
Community 2
Community 3
Common in
community 1 and community 2
Common in
community 2 and community 3
Community 1
Community 2
Community 3
(A) workstation network
(B) Subnetwork of workstation network
with three communities
Figure 3: Visualization of (A) the workstation network and (B) the routing of three communities of materials identified by the
biLouvain community detection algorithm.
Table 2: Total communities, maximum size community, modularity, and execution time of different bi-partite graph algo-
rithms.
Algorithm LP-BRIM LPAwb+ BiLouvain
Total communities 89 329 76
Total subcommunities 1077 1162 1154
Maximum size community 11235 8317 12081
Modularity 0.67 0.61 0.68
Time (minutes) ∼ 40 ∼ 4320 < 2
Table 3: Comparison of module detection algorithms between different algorithms, we measure NMI of communities for both
set of vertices (M,W
0
f tr
) between two algorithms for the bipartite graph.
Algorithms NMI of materials in modules (M) NMI of workstation features in modules (W
0
f tr
)
LP-BRIM, LPAwb+ 0.810 0.708
LP-BRIM, BiLouvain 0.790 0.709
LPAwb+, BiLouvain 0.697 0.662
ficient approach to identifying a set of representa-
tive materials for discrete event simulation using sim-
gen. The detected communities and subcommunities
within each community are used to identify a set of
representative materials that perform better than a ran-
dom selection of materials. The community detection
algorithms identify groups of materials according to
their routings, and the subcommunities identify ma-
terials with similar routing based on a threshold se-
lected by a user. The selection of this optimizing
threshold for path overlap requires domain insight.
We compare the performance of three algorithms and
conclude that the biLouvain community detection al-
gorithm allows users to obtain the superior results
faster than other methods. The community identifi-
cation approach can also be used for ERP data explo-
ration for similar products and independent worksta-
tion sub-networks by domain experts. Similarly, vi-
sual exploration can help identify loads in workstation
networks and allow re-routing of various materials.
Given the complexity of the real-world manu-
facturing environments, a discrete event simulation
method must consider various product features, vari-
ant diversity, BOM structures, and routing to estimate
efficient PPC results. The network-based approach
provides a useful and efficient solution for the model-
ing of real-world manufacturing problems.
In our future research, the proposed approach will
be applied to different real-world manufacturing sce-
narios and will be compared to to other heuristic
approaches for representative material selection for
larger datasets. We will also compare the results of
discrete event simulations using representative mate-
rials of each community independently, and will fur-
ther evaluate how discrete event simulation (simgen)
performs using representative materials selected us-
A Network based Approach for Reducing Variant Diversity in Production Planning and Control
249
0 200 400 600 800 1000
100 200 300 400 500 600 700
#Materials (|M
r
|)
GED(G
ws
, G
ws
(M
r
))
Figure 4: Comparison of graph edit distance between G
ws
and G
ws
(M
r
), when we select M
r
materials from sub-
communities of communities, biLouvain (blue), LP-BRIM
(red), LPAwb+ (green), and randomly from the data (yel-
low).
ing routing information. We will also apply network-
based approaches for ERP data exploration, repre-
sentative material selection, and visual modeling us-
ing the interactive platform for discrete event sim-
ulation by using multilayer networks that integrate
BOM structure complexity (BOM network) and work
station network (routing) for selection of materials,
routes, and resource allocation to understand the com-
plexity of PPC challenges and prepare parameters
efficiently with the collaborative effort of business
experts from different industrial-production domains
within a company.
ACKNOWLEDGEMENTS
This paper is a part of X-pro project. The project is
financed by research subsidies granted by the govern-
ment of Upper Austria.
REFERENCES
Aksoy, S. G., Kolda, T. G., and Pinar, A. (2017). Measuring
and modeling bipartite graphs with community struc-
ture. Journal of Complex Networks, 5(4):581–603.
Altendorfer, K., Felberbauer, T., and Jodlbauer, H. (2016).
Effects of forecast errors on optimal utilisation in ag-
gregate production planning with stochastic customer
demand. International Journal of Production Re-
search, 54(12):3718–3735.
Barber, M. J. (2007). Modularity and community de-
tection in bipartite networks. Physical Review E,
76(6):066102.
Becker, T., Beber, M., Windt, K., and H
¨
utt, M. (2011). Flow
control in production logistic networks. In Proceed-
ings of the 44th CIRP International Conference on
Manufacturing Systems.
Becker, T., Meyer, M., and Windt, K. (2014). A manu-
facturing systems network model for the evaluation of
complex manufacturing systems. International Jour-
nal of Productivity and Performance Management.
Beckett, S. J. (2016). Improved community detection in
weighted bipartite networks. Royal Society open sci-
ence, 3(1):140536.
Bianchesi, N. M. P., Romao, E. L., Lopes, M. F. B.,
Balestrassi, P. P., and De Paiva, A. P. (2019). A de-
sign of experiments comparative study on clustering
methods. IEEE Access, 7:167726–167738.
Bunke, H., Dickinson, P. J., Kraetzl, M., and Wallis, W. D.
(2007). A graph-theoretic approach to enterprise net-
work dynamics, volume 24. Springer Science & Busi-
ness Media.
Chen, N., Yin, Y., and Liu, Q. (2018). Research on com-
plex network modeling of cellular manufacturing sys-
tem. In 2018 International Conference on Intelli-
gent Transportation, Big Data & Smart City (ICITBS),
pages 528–531. IEEE.
Choudhary, A. K., Harding, J. A., and Tiwari, M. K. (2009).
Data mining in manufacturing: a review based on the
kind of knowledge. Journal of Intelligent Manufac-
turing, 20(5):501–521.
Chowdhury, I. J. and Nayak, R. (2013). A novel method
for finding similarities between unordered trees us-
ing matrix data model. In International Conference
on Web Information Systems Engineering, pages 421–
430. Springer.
Chowdhury, I. J. and Nayak, R. (2014). Identifying product
families using data mining techniques in manufactur-
ing paradigm. In AusDM, pages 113–120.
Danon, L., Diaz-Guilera, A., Duch, J., and Arenas, A.
(2005). Comparing community structure identifica-
tion. Journal of statistical mechanics: Theory and ex-
periment, 2005(09):P09008.
Dao, V. L., Bothorel, C., and Lenca, P. (2020). Community
structure: A comparative evaluation of community de-
tection methods. Network Science, 8(1):1–41.
Dogan, A. and Birant, D. (2020). Machine learning and
data mining in manufacturing. Expert Systems with
Applications, page 114060.
Han, X., Cao, S., Shen, Z., Zhang, B., Wang, W.-X.,
Cressman, R., and Stanley, H. E. (2017). Emer-
gence of communities and diversity in social net-
works. Proceedings of the National Academy of Sci-
ences, 114(11):2887–2891.
Hochd
¨
orffer, J., Laule, C., and Lanza, G. (2017). Prod-
uct variety management using data-mining meth-
ods—reducing planning complexity by applying clus-
tering analysis on product portfolios. In 2017 IEEE
International Conference on Industrial Engineering
DATA 2021 - 10th International Conference on Data Science, Technology and Applications
250

and Engineering Management (IEEM), pages 593–
597. IEEE.
H
¨
ubl, A., Altendorfer, K., Jodlbauer, H., Gansterer, M., and
Hartl, R. F. (2011). Flexible model for analyzing pro-
duction systems with discrete event simulation. In
Proceedings of the 2011 Winter Simulation Confer-
ence (WSC), pages 1554–1565. IEEE.
Jaccard, P. (1901). Distribution de la flore alpine dans le
bassin des dranses et dans quelques r
´
egions voisines.
Bull Soc Vaudoise Sci Nat, 37:241–272.
Jeon, S. M. and Kim, G. (2016). A survey of simu-
lation modeling techniques in production planning
and control (ppc). Production Planning & Control,
27(5):360–377.
Jiao*, J., Zhang, L., and Pokharel, S. (2005). Coordinat-
ing product and process variety for mass customized
order fulfilment. Production Planning & Control,
16(6):608–620.
Kronberger, G., Weidenhiller, A., Kerschbaumer, B., and
Jodlbauer, H. (2006). Automated simulation model
generation for scheduler-benchmarking in manufac-
turing. In Proceedings of the International Mediter-
ranean Modelling Multiconference (I3M 2006), pages
45–50.
Li, Y., Wang, Z., Zhong, X., and Zou, F. (2019). Identifi-
cation of influential function modules within complex
products and systems based on weighted and directed
complex networks. Journal of Intelligent Manufactur-
ing, 30(6):2375–2390.
Lin, Y., Zhang, R., Li, C., Yang, L., and Hanzo, L. (2017).
Graph-based joint user-centric overlapped clustering
and resource allocation in ultradense networks. IEEE
Transactions on Vehicular Technology, 67(5):4440–
4453.
Liu, X. and Murata, T. (2010). Community detection in
large-scale bipartite networks. Transactions of the
Japanese Society for Artificial Intelligence, 25(1):16–
24.
Macchiaroli, R. and Riemma, S. (1994). Clustering meth-
ods for production planning and scheduling in a flexi-
ble manufacturing system. In Proceedings of the 1994
IEEE International Conference on Robotics and Au-
tomation, pages 3155–3160. IEEE.
Macchiaroli, R. and Riemma, S. (1996). Clustering algo-
rithms to optimize the tool handling system manage-
ment in an fms. International journal of flexible man-
ufacturing systems, 8(2):183–201.
Murata, T. (2009). Detecting communities from bipartite
networks based on bipartite modularities. In 2009
International Conference on Computational Science
and Engineering, volume 4, pages 50–57. IEEE.
Newman, M. E. (2006). Modularity and community struc-
ture in networks. Proceedings of the national academy
of sciences, 103(23):8577–8582.
Pes
´
antez-Cabrera, P. and Kalyanaraman, A. (2017). Effi-
cient detection of communities in biological bipartite
networks. IEEE/ACM transactions on computational
biology and bioinformatics, 16(1):258–271.
Romanowski, C. J. and Nagi, R. (2005). On compar-
ing bills of materials: a similarity/distance measure
for unordered trees. IEEE Transactions on Systems,
Man, and Cybernetics-Part A: Systems and Humans,
35(2):249–260.
Shabaka, A. and ElMaraghy, H. A. (2007). Generation of
machine configurations based on product features. In-
ternational Journal of Computer Integrated Manufac-
turing, 20(4):355–369.
Stevenson*, M., Hendry, L. C., and Kingsman, B. G.
(2005). A review of production planning and control:
the applicability of key concepts to the make-to-order
industry. International journal of production research,
43(5):869–898.
Strasser, S. and Peirleitner, A. (2017). Reducing variant di-
versity by clustering. In Proceedings of the 6th Inter-
national Conference on Data Science, Technology and
Applications, pages 141–148. SCITEPRESS-Science
and Technology Publications, Lda.
Tripathi, S., Moutari, S., Dehmer, M., and Emmert-Streib,
F. (2016). Comparison of module detection algorithms
in protein networks and investigation of the biological
meaning of predicted modules. BMC bioinformatics,
17(1):129.
Tseng, M. M. and Radke, A. M. (2011). Production plan-
ning and control for mass customization–a review of
enabling technologies. In Mass Customization, pages
195–218. Springer.
Yang, T., Zhang, D., Chen, B., and Li, S. (2010). Analysis
of mixed production line based on complex weighted
network. In 2010 International Conference on Intel-
ligent Computation Technology and Automation, vol-
ume 1, pages 667–670.
Zhang, N., Yang, Y., Zheng, Y., and Su, J. (2019). Mod-
ule partition of complex mechanical products based
on weighted complex networks. Journal of Intelligent
Manufacturing, 30(4):1973–1998.
A Network based Approach for Reducing Variant Diversity in Production Planning and Control
251
