
Multi-domain Modeling and Simulation of an Oximeter:
PVT Variations Impact of Opto-electronic Devices
on the SpO
2
Quantification
Songlin Li
1a
, Julien Denoulet
1b
, Olivier Tsiakaka
2,3 c
and Sylvain Feruglio
1d
1
CNRS UMR 7606, LIP6, Sorbonne Université, Paris, France
2
CERVO, University of Laval, Quebec, Canada
3
Biomedical Microsystems Laboratory, Université Laval, Quebec, Canada
Keywords: Heterogeneous System, Modeling, Monte-Carlo Simulation, Multi-domain, Near-Infrared Spectroscopy
(NIRS), Oxygen Saturation (SpO
2
), PhotoPlethysmoGraphy (PPG), PVT (Process, Voltage, Temperature),
SystemC(-AMS).
Abstract: Oxygen concentration quantification in the blood (SpO
2
) has been used as a mean to diagnose and prevent
critical medical conditions thanks to pulse oximetry. In spite of its theoretical precision, this method suffers
from intrinsic deviations from the components used in such monitoring devices (PVT) that can lead to SpO
2
measurement errors. In this paper, we propose a multi-domain modeling of a NIRS-based blood oxygen
saturation monitoring system and its biological environment using SystemC(-AMS) for virtual prototyping,
to analyze the impact of PVT variations of opto-electrical components, thanks to Monte-Carlo simulation
correlated with transient analysis. We simulated the blood flow of the finger tissue and the dynamic
attenuation of the red and infrared light passing through the tissue. The Monte-Carlo simulation method was
used to analyze different PVT parameters that may cause measurement deviations separately. Finally, we
found that the red/IR LED peak wavelength deviation and the temperature of the system have an important
impact on the SpO
2
quantification, especially red LED peak wavelength deviation. This result shows that the
choice of the red-light source is of prime importance for accurate SpO
2
quantification.
1 INTRODUCTION
SpO
2
(oxygen saturation)
index is measured to show
the level of oxygenation in blood using an oximeter
device. It is based on Near-InfraRed Spectroscopy
(NIRS) and on PhotoPlethysmoGraphy (PPG)
technologies (Webster, 1997). Typically, as shown in
Fig.1, two colored light sources (red and infrared) are
used on body parts, usually a finger, to detect
volumetric changes of blood. However, deviations
always occur when performing a measurement.
Therefore, device calibration is indispensable to
obtain an acceptable error rate (Maxim, 2019).
Many well-known factors have an impact on the
SpO
2
measurement, for instance motion artifacts,
ambient light, skin color, etc. However, so far,
influences coming from the system itself haven’t been
a
https://orcid.org/0000-0003-4717-1328
b
https://orcid.org/0000-0003-1354-961X
c
https://orcid.org/0000-0001-8723-7825
d
https://orcid.org/0000-0002-6444-2671
carefully studied. We propose to contribute to this
field through the study of the impact of PVT (Process,
Voltage, Temperature) variations in the SpO
2
monitoring system. To do this, we intend to model
and simulate the embedded system in association with
the monitored biological tissue.
Evaluating PVT variations is difficult to achieve
through experimental methods, because it is not easy
to vary certain parameters in the monitoring system
(such as the peak wavelength of the red/IR LED
spectrum, the spectral sensitivity of the photo-
detector, etc.) to evaluate their impact on SpO
2
quantification. Parasitic signals and noise might also
influence the results. Therefore, we will add these
features in our modeling methodology, to give us a
better knowledge of the measurement device.
Li, S., Denoulet, J., Tsiakaka, O. and Feruglio, S.
Multi-domain Modeling and Simulation of an Oximeter: PVT Variations Impact of Opto-electronic Devices on the SpO2 Quantification.
DOI: 10.5220/0010548903030310
In Proceedings of the 11th International Conference on Simulation and Modeling Methodologies, Technologies and Applications (SIMULTECH 2021), pages 303-310
ISBN: 978-989-758-528-9
Copyright
c
2021 by SCITEPRESS – Science and Technology Publications, Lda. All rights reserved
303

Figure 1: The principle of oximeter.
We chose the SystemC and SystemC-AMS
modeling tools to develop our models due to three
main advantages compared to other modeling
tools/languages, which are summarized in Table 1:
Multi models of computation: SystemC/
SystemC-AMS offer several Models of
Computation (MoC) with Discrete Event (DE),
Timed Data Flow (TDF), Linear Signal Flow
(LSF) and Electrical Linear Networks (ELN).
Each MoC operates at different abstraction
levels and can therefore be chosen according to
the desired precision;
Fast simulation: with well-chosen abstraction
level and simulation time step, simulation run
time can be shortened as much as possible;
Open source: SystemC and SystemC-AMS are
freely distributed C++ libraries, which means
we have access to these tools as well as all C++
supported functions. If necessary, it is also
relatively easy to integrate other software in our
model by implementing interfaces.
Other advantages, like high data accuracy,
lightweight installation and simplicity of usage, are
also reasons why we chose this tool. We used
versions 2.3.2 of SystemC and 2.1 of SystemC-AMS.
Both of these libraries can be freely downloaded on
Accellera's website (Accellera, n.d.).
SystemC/SystemC-AMS was proposed as an
efficient tool for modeling complex systems,
especially in the biomedical domain (Pecheux, et al.,
2010), but it doesn’t natively include Monte-Carlo
(MC) statistical analysis method (Menčík, 2016).
Indeed, this analysis is particularly relevant to
observe the impact of key parameters on the system
behavior. Therefore, a MC simulation method in
SystemC-AMS must be developed.
Nowadays, modeling and simulation analysis
methods have been widely used in the field of
biomedicine (e.g., bionic nervous systems modeling
(Cacciapuoti, 2015)) and the research of medical
device (Mundt, 2000). The interaction modeling
between medical device and the human body also
exists, such as the interaction between ears and
cochlear implants (Tran, 2015), and the interaction
simulation between the cardiac rhythm and
pacemakers (Greenhut, 1993).
In this context, the main objective of this article is
to present our modeling and simulation approach of a
highly multi-domain application with open-source
tools, and to explore impacts of PVT variations in this
biomedical device.
The paper is organized as follows. In section 2, we
present our model structure. Then, the simulation
process and the model validation method are shown
in section 3. PVT variation analysis is described in
section 4. Finally, we conclude in the last section.
2 MODEL STRUCTURE
There are mainly two parts in our model: the
monitoring system, with opto-electrical components
and the biological environment. Figure 2 shows the
model block diagram (with the MoC used for each
sub-block), with the finger as the monitored
biological medium.
Table 1: SystemC/SystemC-AMS versus other modeling tools.
SIMULTECH 2021 - 11th International Conference on Simulation and Modeling Methodologies, Technologies and Applications
304
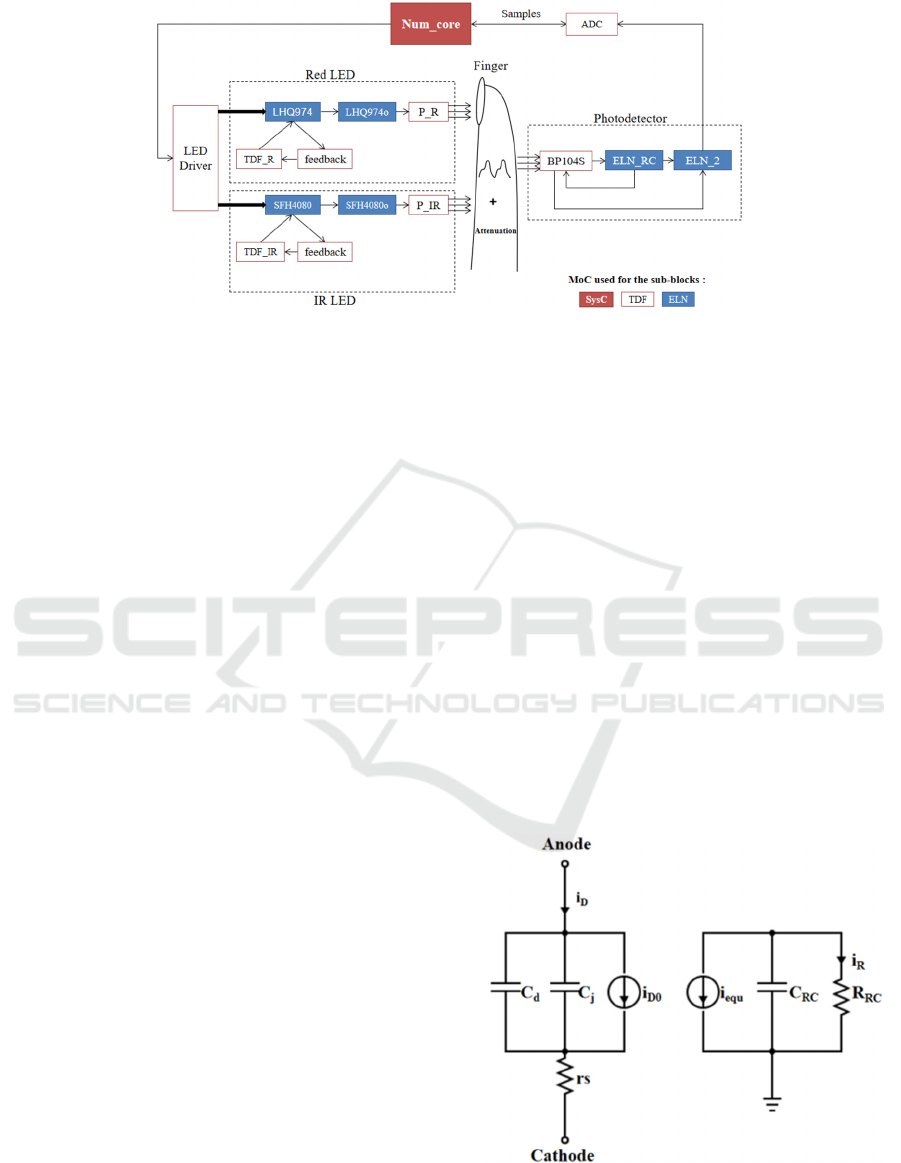
Figure 2: Model structure to emulate oximeter on finger in SystemC/SystemC-AMS.
In this figure, Num_core block was modeled in
SystemC, and a state machine was implemented to
emulate a micro-controller. This block was also used
to provide pulsed power supply for both LEDs by
controlling a LED Driver, and to receive data from
the ADC channel.
2.1 LED
A red LED (LHQ974) and an IR LED (SFH4080)
manufactured by OSRAM were modeled in
SystemC-AMS (note that any other type of light
source can subsequently be modeled, as long as
parameters describing it are available). Both LED
models are similar, except for their optical and
electronic parameters. The LED model is divided into
five sub-blocks to simulate static and dynamic
behaviors, in association with its optical
characteristics. Sub-block TDF_R, simulates the
static behavior described by Shockley equation (Sze,
et al., 2006), mainly. Blue sub-blocks are
implemented with the ELN MoC to simulate the
dynamic behavior of the LED. Figure 3 (left) shows
the physical equivalent circuit of both LHQ974 and
SFH4080 sub-blocks. In this equivalent circuit, C
d
and C
j
represent the diffusion and the junction
capacitance, respectively. i
D0
is the equivalent current
source, which takes the value of the output current of
TDF_R and TDF_IR. The feedback sub-blocks are
used to transfer two
feedback
parameters: the current
i
D
and the voltage V
D
of the LED, from LHQ974 to
TDF_R or from SFH4080 to TDF_IR. Figure 3 (right)
represents the equivalent circuit of LHQ974o and
SFH4080o, which are used to take into account the
intrinsic opto-electrical effect of the device. i
equ
is
equal to i
D
. The RC pole, represented by the
resistance R
RC
and the capacitance C
RC
, designates the
frequency characteristic of the LED (Bian, et al.,
2008). Then, the P_R and P_IR sub-blocks are used
to convert the output current i
R
of LHQ974o and
SFH4080o into luminous intensity in Watt. The
actual spectral distribution of both LEDs is usually
modeled by a Gaussian curve (Tsiakaka, et al., 2020)
and the total radiant flux is the integral of the entire
spectrum.
For the oxygen rate calculation, since the molar
extinction ε(λ) varies according to the wavelength,
the attenuation for different wavelengths of light is
calculated separately, when a beam of light passes
through the biological tissue. Therefore, we should
separate the luminous intensity of each wavelength in
the LED model. Still, we cannot consider all
wavelengths of the LED spectrum, since it would
greatly increase the amount of calculation and,
therefore, the simulation time. As a result, we
approximated the LED spectrum by dividing it into
five intervals around the peak wavelength. For the red
LED (LHQ974), the peak wavelength is ideally
660nm. Thus, we chose five wavelengths from
Figure 3: Equivalent circuit of LED in dynamic mode. On
the left is the physical equivalent circuit. The block on the
right has no physical reality, but is used to consider the
device intrinsic opto-electrical effect.
Multi-domain Modeling and Simulation of an Oximeter: PVT Variations Impact of Opto-electronic Devices on the SpO2 Quantification
305
640nm to 680nm with an interval of 10nm. For the IR
LED (SFH4080), with its peak at 880nm, the chosen
range was 860nm to 900nm, with the same interval.
2.2 Photo-detector
A model of the BP104S photo-detector (PD), also
manufactured by OSRAM, was developed. The PD
operates in reverse bias. It provides a spectral
sensitivity in accordance with the spectrum of the
received light to convert the light intensity into
electric power. The current generated by the PD
mainly consists of two parts:
I
ph
: the photonic current generated by the light
received from the external environment by the
PD, which carries the detection information;
I
dc
: the parasitic dark current generated by the
PD in the absence of wanted light.
Sub-block BP104S in Fig.2 is used to describe the
PD spectral sensitivity and the dark current. ELN_RC
and ELN_2 are made to simulate the dynamic
behavior, as in Fig.3. The PD output is sent to the
ADC block, so that the pulsed current can be sampled,
after amplification and voltage conversion, and data
can be registered in Num_core.
2.3 Biological Environment
A model of a finger was constructed to simulate the
oxygen concentration variation in the blood and its
detection with lights through the tissue. In the blood,
there are mainly two chromophores that impact the
measurement of SpO
2
: HbO
2
(oxy-hemoglobin) and
HHb (deoxy-hemoglobin). The light attenuation by
the biological tissue is given by the Beer-Lambert
Law, shown in equation (1):
dHHbHbO
HHbHbO
eII
])[][(
0
2
2
)()(
(1)
with I
0
(λ) the input light intensity at the wavelength λ,
I(λ) the output light intensity passing through and
attenuated by the biological tissue, ε
HbO2
, ε
HHb
the
molar extinction of HbO
2
and HHb, respectively,
[HbO
2
] and [HHb] the concentration of HbO
2
and
HHb, and d the length of optical path.
The change of blood volume according to time is
simulated by the normalized equation (2), where f
0
is
the cardiac frequency in Hz.
)22sin(
4
1
)2sin(
2
1
00
tftfA
(2)
3 SIMULATION PROCESS AND
MODELS VALIDATION
This section first introduces the simulation process.
Then, in subsection 3.2, the accuracy of our models
(at the device and at the system level) is evaluated by
comparing our simulation with other experimental
results in the existing literature.
3.1 Simulation Process
Once all models were implemented, basic transient
simulation was performed to get two PPG signals that
represent the red and IR responses generated by the
PD after passing through the biological medium.
Then, as shown in Figure 2, data was sampled every
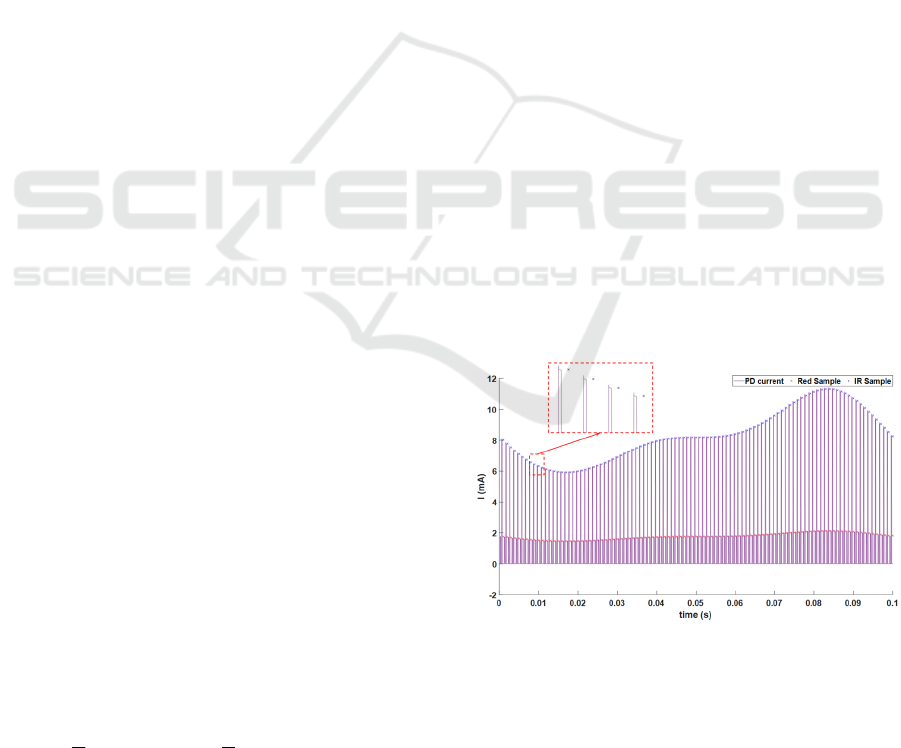
1ms by the ADC block. The result is presented in
Figure 4, where inputs for each LED are light pulses
of 150µs every 1ms. The simulation step was set to
1µs, to be able to observe the devices transient
behaviors. The heart rate was set to 10Hz (10 times
higher than in reality), to reduce the simulation time.
In this figure, the pink signal is the pulsed current
generated by the PD. The top envelope corresponds
to the IR LED, while the bottom envelope is due to
the red LED. The red LED signal amplitude is lower
because the luminous intensity of red light is
relatively weaker, when the same voltage is applied
to both LEDs. The crosses (in the zoomed block) are
samples of LED signals. On a laptop with an Intel
Core i5 9
th
Gen processor (2.4GHz, 8 CPUs) and
8192M of RAM,
it takes 29s to simulate a 0.1s
duration.
Figure 4: Red signal (bottom), IR signal (top) generated by
photo-detector and the samples of the signals (crosses on
the top and on the bottom).
Then, after detecting the peak and valley of the
red/IR signals by signal processing (filtering and
extremum detection, mainly), we can calculate the
SIMULTECH 2021 - 11th International Conference on Simulation and Modeling Methodologies, Technologies and Applications
306
R
OS
(Ratio-of-ratio) value with the following
equation (Webster, 1997):
H
L
H
L
OS
IR
IR
R
R
R
ln
ln
(3)
Here, R
L
,
R
H
are the valley and peak value of the red
signal, respectively, and IR
L
,
IR
H
correspond to the
valley and peak value of the IR signal.
SpO
2
value was set before simulation run-time, by
setting [HbO
2
] and [HHb] in the biological
environment, according to equation (4) (Webster,
1997). We set [HbO
2
] + [HHb] = 0.3mM, which is an
approximate value for the human body (Dash, et al.,
2010). In any case, in the simulation, the value of
SpO
2
can be easily and dynamically changed by
modifying the ratio of [HbO
2
] and [HHb].
%100
][][
][
2
2
2
HHbHbO
HbO
SpO
(4)
With a single period of both PPG (red and IR
responses), only one R
OS
value can be obtained for
one specific SpO
2
value. However, to obtain a
quadratic SpO
2
-R
OS
curve (Maxim, 2019), we need to
vary this SpO
2
value. In our simulation, we varied this
parameter from 90% to 100% (a below 90% SpO
2
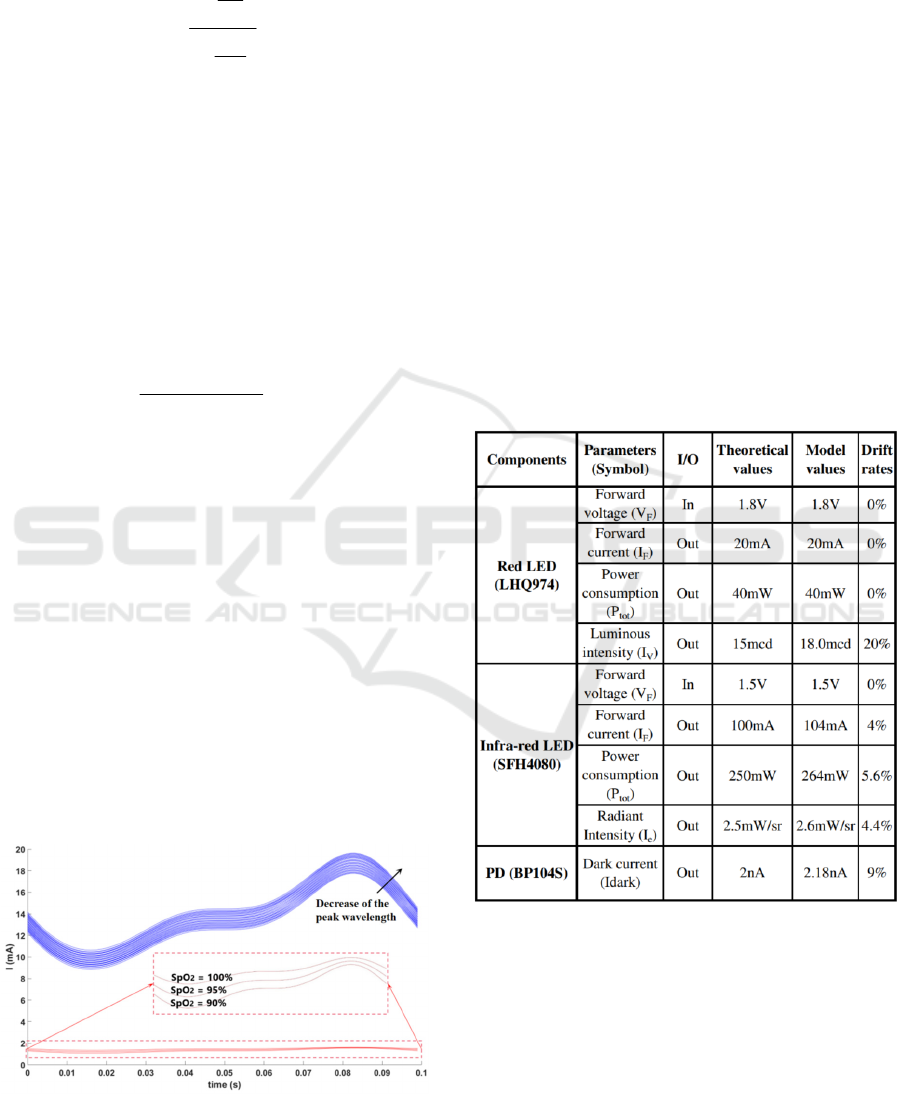
value means the person is in a danger state). Figure 5
shows several simulation periods. Red lines
correspond to PPG due to the red source for three
different SpO
2
settings (90%, 95%, and 100%). For
IR responses (blue curves), a shift of the peak
wavelength has also been taken into account, to
illustrate PVT variation, albeit in a basic manner. We
chose four values above and four values below the
880nm nominal value, each with a 5nm step
increment, to constitute nine peak wavelength values
in the [860nm; 900nm] interval. Combined with the
Figure 5: PPG obtained with red and IR sources for three
SpO
2
value. IR LED curves (in blue) also feature variation
of the peak wavelength.
three different SpO
2
parameter values, we were able
to simulate twenty-seven configurations. Section 4
will present a more thorough approach to evaluate the
influence of PVT variations.
3.2 Models Validation
There are two steps to validate our models. First, we
individually validate each component (i.e., both
LEDs and PD) by comparing the simulation output
data with key-parameters in the datasheets. These
results are summarized in Table 2 (obtained by time
domain simulation). Only the optical parameters
weren’t modeled very well, but with acceptable
errors
according to datasheets
. We assume that it was due to
approximations made to model certain
characterizations and also to the fact that we had the
influence of the other parameters.
In any case, we can
calibrate this error rate by ourselves in the modeling, to be
closer to the datasheet value.
Table 2: Models key-parameters compared to datasheets.
The second step is to validate the whole system by
comparing our simulation data with previous results
(Tsiakaka, et al., 2020), where authors used six
different pairs of red/IR LED to plot six SpO
2
-R
OS
curves. We were able to measure these LEDs optical
and electrical characteristics, in order to simulate
these devices with our developed model. For the PD,
a model of the BP104S was used. As for the
biological medium, we applied the same finger model.
Results are presented in Figure 6.a. It shows the “110-
Multi-domain Modeling and Simulation of an Oximeter: PVT Variations Impact of Opto-electronic Devices on the SpO2 Quantification
307
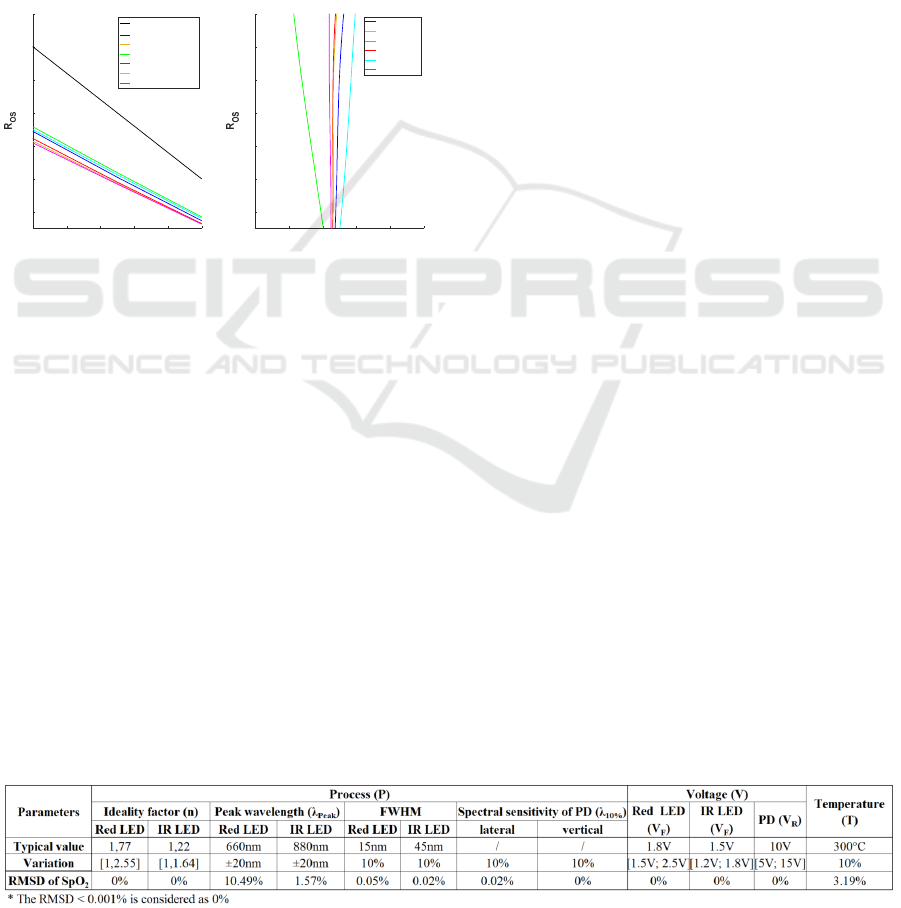
25R
OS
” curve, as it is a widely used reference to
basically estimate SpO
2
. We then compared our
simulations to Figure 9.b in (Tsiakaka, et al., 2020),
with the only difference being the used PD (BP104S
for us and FDS100 for the previous work). Figure 6.b
shows the SpO
2
deviation curves between our models
and the previous results, for all six red/IR LED pairs.
We can notice that the absolute value of ΔSpO
2
is
always less than 1%. Then, we also calculated the
SpO
2
Root-Mean-Square Deviation (RMSD) for each
pair of SpO
2
-R
OS
curves in both works. It ranges from
0.22% to 0.77%, which proves that our simulation
results correlate well with the previous results. In this
way, our whole system model is validated.
Figure 6: a) Simulation result with our models for the six
different red/IR LED pairs; b) SpO
2
deviation curves
between our works and (Tsiakaka, et al., 2020).
4 PVT VARIATION ANALYSIS
The dispersion of the IR LED peak wavelength, as
simulated in Figure 5, relies on a deterministic
approach. For a more in-depth analysis of the impact
of PVT variations, it is necessary to introduce a
randomness factor. As a result, we performed a MC
analysis on our system, based on the variation of
selected parameters. As their impact on SpO
2
quantification can be rather unpredictable, a Corner
simulation will not necessarily give us enough
information. Therefore, MC analysis will allow us to
get a more complete view of the system behavior.
4.1 MC Simulation in SystemC-AMS
In this analysis, we varied selected parameters in a
reasonable range, with a chosen Probability Density
Function (PDF) of amplitude centered in a specific
value. Since this feature isn’t natively included in
SystemC-AMS, we had to develop our own code.
Firstly, we wrote a function to generate a set of
numbers varying within a certain range in a specific
distribution around 1. In this article, we used a
Gaussian distribution. However, other PDF are
possible (e.g., uniform). Then, these numbers were
multiplied by the nominal value of the parameter to
be varied. It constituted a set of input values. Then,
we assigned these input values to a SystemC signal
and connected it to the systemC-AMS input port of
the target parameter. A loop was then implemented in
the top file, where we assigned the random input
values to the SystemC signal, one by one, to do
repeated simulations. Finally, we generated a .dat file
to save the output data.
4.2 Introduction of Different PVT
Parameters in the System
PVT considers the variation of selected parameters in
an electronic system: Process (P) dispersion due to
manufacturing, mainly, supply Voltage (V) of the
various system components, and the operating
Temperature (T) of the device. The parameters we
took into account are presented in Table 3, with their
typical values and variation ranges.
T-variation in the device is mainly due to self-
heating during operation and also to the light sources
during emission. Note that a variation of more than
4K is generally unacceptable in a medical device.
A device power supply voltage is often affected
by many factors causing instability and fluctuations
(IR-drop due to current draw, crosstalk because of
electromagnetic interference, etc.). Moreover, in an
embedded system with battery, the voltage supply
decreases with the battery usage. Such instability may
impact the accuracy of our SpO
2
measure. In this
study, we focused on the power supply of both LEDs
and of the PD, knowing that the V
REF
for the ADC
doesn’t result in any error at all.
Table 3: PVT parameters to be varied and analyzed in the system.
90 92 94 96 98 100
SpO
2
(%)
0.3
0.4
0.5
0.6
0.7
0.8
0.9
a)
Approx 110-25R
OS
Typical
VSMD66694
SMT660/890
SFH7050
led#1
led#2
-2 -1 0 1 2 3
ΔSpO
2
(%)
0.3
0.4
0.5
0.6
0.7
0.8
0.9
b)
Typical
VSMD66694
SMT660/890
SFH7050
led#1
led#2
SIMULTECH 2021 - 11th International Conference on Simulation and Modeling Methodologies, Technologies and Applications
308
P-variation is the deviation of component
attributes during fabrication. For both LEDs, n is the
ideality factor, a key parameter describing the diode
junction and a solar cell’s electrical behavior (Hadj,
et al., 2018). n can slightly vary during fabrication. As
shown in equation (5), it has an influence on the
forward current I, which is directly proportional to the
optical power of the light source. V
F,
the threshold
voltage of the LED is also affected by manufacturing
dispersion. Both parameters can be concatenated in a
same Gaussian PDF.
)1(
T
F
Vn
V
S
eII
(5)
In equation (5), I
S
is the saturation current, and V
T
the thermal voltage. We found in the datasheets that
the maximal V
F
for the red and IR LED is 2.5V and
1.8V, respectively. From simulations, we estimated
the maximal value of n for both LEDs. It is 2.55 and
1.64, respectively, and can’t be less than 1 (Sze, et al.,
2006). So, we varied n from 1 to 2.55 for the red LED
and from 1 to 1.64 for the IR LED.
Deviation of the LED peak wavelength is another
relevant parameter. Even for the same type of LED,
the peak wavelength of the optical spectrum is subject
to deviation due to the fabrication process. We found
a typical range of ±20nm for the peak wavelength of
both LEDs in their datasheets.
The FWHM (Full Width at Half Maximum)
parameter of the optical spectrum can also be
impacted by process dispersion. Based on
experimental results found in (Filippo, et al., 2017),
we chose a range of ±10% of the typical value.
Finally, the PD spectral sensitivity is also affected
by an offset due to process variation. Thus, we studied
the impact of this factor by shifting the PD optical
response spectrum vertically and laterally.
4.3 Simulation Results
To get an idea of the influence of each of the
parameters presented above, we first performed the
MC simulation (consisting of 200 runs), varying only
one single parameter. We were then able to calculate
for this parameter the maximal SpO
2
RMSD for its
two extreme values. These results are presented in the
last line of Table 3. We found that the main factors
that impact the SpO
2
quantification come from the
deviation of both LED peak wavelengths (RMSD is
11.31% for the red LED and 1.79% for the IR LED)
and from temperature (RMSD is 3.19%). The gap
between both LED RMSD values can be explained by
the fact that around the red-light band (660nm), the
slope of molar extinction curves of HbO
2
and HHb is
greater than around the IR light band (880nm). The
impact of other parameters is negligible.
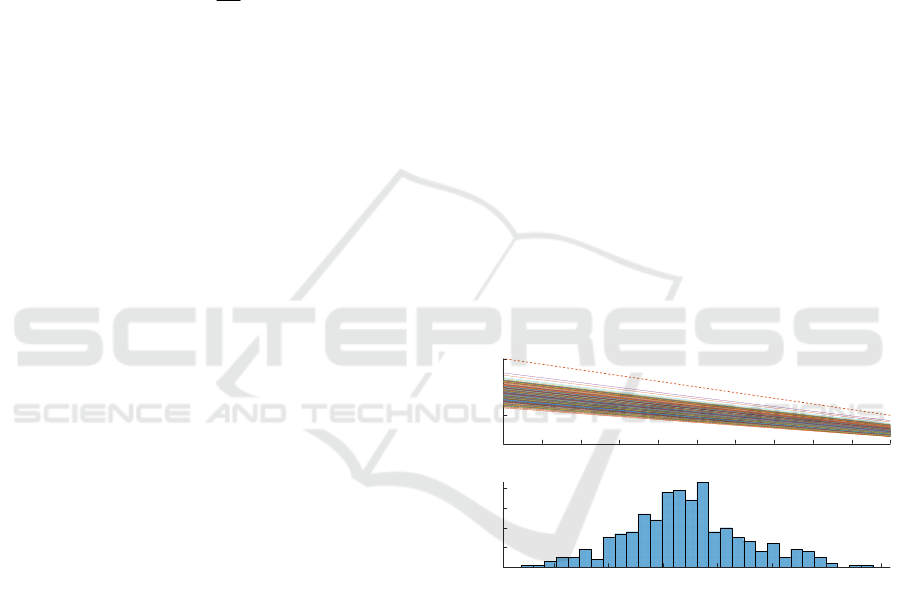
After that, we investigated the combined
influence of several parameters dispersion on the
quantification of SpO
2
. Figure 7 presents the result of
the MC simulation correlated with the transient
analysis. We varied three key parameters (both LED
peak wavelengths and T). We performed 400 runs
(i.e., different configurations) to obtain 400 SpO
2
-R
OS
curves, as in Figure 7.a. To get these results, the
simulation time was around 11h. Figure 7.b shows the
distribution of SpO
2
when R
OS
is equal to 0.4. The
RMSD of SpO
2
for the two extreme cases is 9.32% in
the critical 90–100% saturation window, which is
close to the dispersion value associated to the red
LED peak wavelength variation. Consequently, it
could be said that the red LED peak wavelength
variation has the greatest impact.
We can conclude from the above results that in the
oximeter manufacturing process, it is necessary to
tightly control the peak wavelength deviation of the
light source, to avoid an otherwise necessary
calibration. At the same time, the device operating
temperature influence on the SpO2 measurement
accuracy cannot be ignored. For other parameters of
our discussion, there is no strict requirement.
Figure 7: Simulation result of the variation of three key
factors at the same time.
5 CONCLUSIONS
In this paper, the process to quantify SpO
2
on the
finger with an oximeter is simulated with an opto-
electronic model built in SystemC/SystemC-AMS.
Then, the impact of PVT variations in the device on
the SpO
2
quantification is explored, through a MC
method combined with transient simulation,
performed on the developed models. We found that
the main influence parameters of PVT variations on
the quantification of SpO
2
were the red/IR LED peak
90 91 92 93 94 95 96 97 98 99 100
SpO
2
(%)
0.2
0.4
0.6
0.8
R
OS
a)
b)
93 94 95 96 97 98 99
SpO
2
(%)
0
10
20
30
40
number
110-25R
OS
Multi-domain Modeling and Simulation of an Oximeter: PVT Variations Impact of Opto-electronic Devices on the SpO2 Quantification
309

wavelength deviation and temperature. Other factors
seem to have a negligible impact individually.
This modeling method in SystemC/SystemC-
AMS, which associates the monitoring system,
including its opto-electronic components, and the
biological environment, is proved fast, accurate and
flexible. This methodology can be employed for any
cyber-physical system to estimate its performances,
to optimize the design phase, and to help the
understanding of measurement data (e.g., reproduce
results close to the experimental measurements in the
simulation and vary certain parameters to understand
their impacts).
REFERENCES
Webster, J.G., ed. 1997. Design of Pulse Oximeters. Bristol;
Philadelphia: Institute of Physics Pub, doi:
10.1201/9780367802592.
Maxim, 2019. Guidelines for SpO2 measurement using the
Maxim MAX32664 sensor hub. https://pdfserv.maxim
integrated.com/en/an/SpO2-Measurement-Maxim-
MAX32664-Sensor-Hub.pdf
Accellera. (n.d.). SystemC. Retrieved February 27, 2021,
from https://www.accellera.org/downloads/standards/
systemc
Pecheux, F., et al., 2010. Is SystemC-AMS an Appropriate
“Promoter” for the Modeling and Simulation of Bio-
Compatible Systems? IEEE ISCAS, doi:
10.1109/ISCAS.2010.5537669.
Menčík, J., 2016. Concise Reliability for Engineers. InTech,
doi: 10.5772/62009.
Cacciapuoti, A.S., et al., 2015. Receiver Design for a Bionic
Nervous System: Modeling the Dendritic Processing
Power. IEEE Internet of Things Journal, 11, doi:
10.1109/JIOT.2015.2438098
Mundt, C.W., et al., 2000. Applications of SPICE for
Modeling Miniaturized Biomedical Sensor Systems.
IEEE Transactions on Biomedical Engineering, 47(2):
149–54, doi: 10.1109/10.821733.
Tran, P., et al., 2015. Development of HEATHER for
Cochlear Implant Stimulation Using a New Modeling
Workflow. IEEE Transactions on Biomedical
Engineering, 62(2): 728–35, doi: 10.1109/TBME.
2014.2364297.
Greenhut, S.E., et al., 1993. A Stochastic Network Model of
the Interaction between Cardiac Rhythm and Artificial
Pacemaker. IEEE Transactions on Biomedical
Engineering, 40(9): 845–58, doi: 10.1109/10.245605.
Bian, J., et al., 2008. A Novel Spice Model of Photodetector
for OEIC Design, edited by Liwei Zhou, 66211E.
Beijing, China, doi: 10.1117/12.790834.
Tsiakaka, O., et al., 2020. Source–Detector Spectral
Pairing-Related Inaccuracies in Pulse Oximetry:
Evaluation of the Wavelength Shift, MDPI Sensors,
20(11), doi: 10.3390/s20113302.
Dash, R.K., et al., 2010. Erratum to: Blood HbO2 and
HbCO2 Dissociation Curves at Varied O2, CO2, PH,
2,3-DPG and Temperature Levels. Annals of
Biomedical Engineering, 38(4), doi: 10.1007/s10439-
010-9948-y
Hadj, B., et al., 2018. Theoretical Models for Anomalously
High Ideality Factor in a Au/SnO2-Si(n)/Al Solar Cell,
Silicon, 10(3), doi: 10.1007/s12633-017-9572-7.
Sze, S.M., 2006. Physics of Semiconductor Devices:
Sze/Physics. Hoboken, NJ, USA: John Wiley & Sons,
Inc., doi: 10.1002/9780470068328.
Filippo, R., et al., 2017. LEDs: Sources and Intrinsically
Bandwidth-Limited Detectors, MDPI Sensors 17(7),
doi: 10.3390/s17071673.
SIMULTECH 2021 - 11th International Conference on Simulation and Modeling Methodologies, Technologies and Applications
310
