
Optimized Line-of-Sight Assessment Algorithm for 5G mmW Network
Design using LiDAR Information
Reza Soosahabi and Magdy Bayoumi
Department of Electrical & Computer Engineering, University of Louisiana at Lafayette, Lafayette, LA 70504, U.S.A.
Keywords:
5G-NR, mmW Network Design, Fixed-Wireless Access, Line-of-Sight Assessment, LiDAR Application,
Visibility Algorithm.
Abstract:
Utilizing mmW carrier frequency bands (aka above-6 GHz) at the network edge, is a key enabling factor to
achieve near Gbps throughput in 5G-NR technology. The propagation characteristics of mmW signals in out-
door environment complicates 5G mmW network design. Previously used in backhaul networks, the service
availability of mmW radio technologies significantly relies on the Line-of-Sight (LoS) signal path between the
communicating radios. LiDAR is considered a popular source of high-resolution aerial survey data suitable
for accurate LoS assessment. Maintaining low radio mounting height is another cost-related factor in practical
5G mmW network design. In this work we present a comprehensive LoS assessment problem incorporating
radio mounting height. Then we propose a new LoS assessment algorithm using LiDAR data that is compu-
tationally optimized for the practical aspects of 5G mmW network design. Empowered by a novel method to
topologically sort terrain data, it achieves constant-time, O(1), complexity to execute LoS assessment per user
location, whereas the complexity of retrofitted LoS algorithms for the same task grows linearly with respect to
the data dimensions. The improvements in the run-time efficiency are verified in numerical results for a real
deployment scenario.
1 INTRODUCTION
Superseding the Long-Term Evolution wireless tech-
nology, 5G is envisioned to be the prominent unify-
ing connectivity solution for a wide range of applica-
tions in the present decade. In terms of mobile and
broadband services, it is designed to offer near Gbps
throughput over wireless links at extremely low la-
tency. This is achieved by 5G-NR advanced radios
utilizing transmission bandwidths in the scale of hun-
dreds of MHz available in millimeter-wave (mmW)
carrier frequency bands (aka above-6 GHz) as well
as other physical layer advancements, such as beam-
forming and massive MIMO (Ghosh et al., 2019).
The propagation characteristics of mmW signals
in outdoor environment complicates 5G mmW net-
work design, particularly for broadband application
scenarios such as Fixed Wireless Access (FWA).
This requires deploying a higher number of cell sites
meticulously designed with respect to both terrain
and expected user locations data (Medin and Louie,
2019). As in legacy applications of the mmW in back-
haul networks, the Line-of-Sight (LoS) signal path
between both ends of a wireless link is the key factor
in service availability determination. Thus, a practical
approach to the complex design problem involves per-
forming LoS assessment between the candidate cell
site locations and expected user locations using high-
resolution areal survey data.
Light Detection and Ranging (LiDAR) is a re-
mote sensing technology offering very high resolution
aerial survey data invaluable in many applications.
Becoming popular in recent years, LiDAR has been
adopted by operators and software vendors engaged
in 5G network design. Basic LoS assessment (aka
viewshed or visibility problem) in large terrain envi-
ronment has been subject of extensive studies in com-
puter science due its relevance to other fields (Floriani
and Magillo, 2003).
In this work we present a more comprehensive
LoS assessment problem incorporating radio mount-
ing height that is a key practical variable in select-
ing 5G mmW cell sites. Keeping the required radio-
mounting height at minimum leads to significant re-
duction in the infrastructure cost. Then we propose a
new LoS assessment algorithm using LiDAR data that
is computationally optimized for the practical aspects
of 5G mmW network design. It achieves remarkable
Soosahabi, R. and Bayoumi, M.
Optimized Line-of-Sight Assessment Algorithm for 5G mmW Network Design using LiDAR Information.
DOI: 10.5220/0010548100170024
In Proceedings of the 18th International Conference on Wireless Networks and Mobile Systems (WINSYS 2021), pages 17-24
ISBN: 978-989-758-529-6
Copyright
c
2021 by SCITEPRESS – Science and Technology Publications, Lda. All rights reserved
17
computational efficiency compared to the retrofitted
LoS assessment algorithms that operate in linear-time
complexity at best with respect to the terrain size.
Empowered by a novel method to topologically sort
terrain data, it takes constant-time, O(1), complexity
to execute LoS assessment per user location.
The rest of this article organized as follows: LoS
assessment problem investigated in Section 2 fol-
lowed by Section 3 outlining possible solutions using
LiDAR data. Section 4 is designated to mathematical
details of proposed algorithm followed by numerical
results and conclusion, respectively in Sections 5 and
6.
2 SCOPE OF PROBLEM
This section is dedicated to the practical challenges
of designing 5G mmW networks in outdoor environ-
ment. Although being used in other wireless applica-
tions, the propagation characteristics of mmW signals
in outdoor environment poses significant design over-
head in terms of infrastructure cost and the computa-
tional complexity of coverage prediction models. The
problem of LoS assessment using high-resolution ter-
rain data is outlined towards the end of this section. It
captures a common design methodology used in cur-
rent deployments to properly select the radio installa-
tion sites.
2.1 Characteristics of mmW Signals
Utilizing mmW frequency bands is a key advance-
ment in 5G new radio (NR) technology. Radios op-
erating in mmW carrier frequency have the luxury of
larger transmission bandwidths with smaller antenna
elements. Therefore, they can house large antenna
arrays in the same form-factor as their sub-6 GHz
counterparts. Antenna arrays can be used for creat-
ing multiple highly-directional beams for both trans-
mitting and receiving the radio signals. However,
mmW radio signals suffer much higher attenuation
(path-loss) in the environment compared to their sub-
6 GHz counterparts that is attributed to their shorter
wavelengths. They cannot penetrate most obstacles
nor benefit much from multipath reflections to reach
far distances without a LoS signal path. Focusing
on the link throughput, some of these propagation
losses are compensated for by utilizing higher band-
width and the beam-forming gains. Presence of LoS
signal path coupled with beam-forming can signifi-
cantly boost per-user throughput and overall cell ca-
pacity by enabling SDM (Spatial Diversity Multiplex-
ing) in common point-to-multi-point scenarios. It en-
ables reusing time-frequency resources across multi-
ple beams, given sufficient angular spread among the
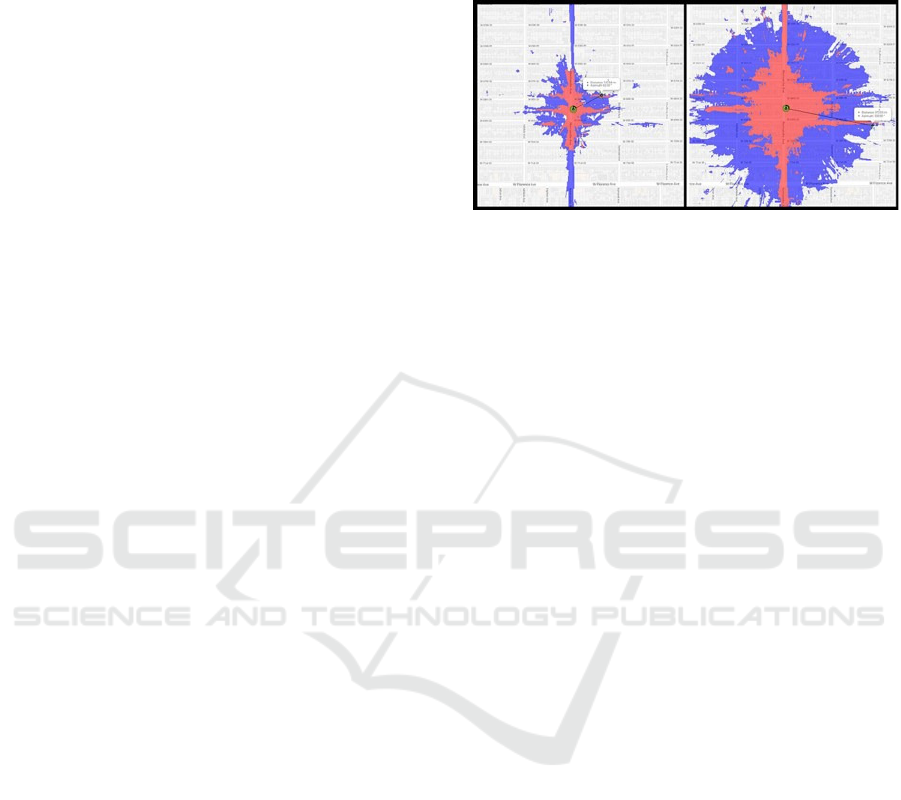
users. Figure 1 (excerpted from (Medin and Louie,
Figure 1: Comparing 5G-NR Coverage: above-6 GHz (left)
v.s sub-6 GHz (right) excerpted from (Medin and Louie,
2019). Red and Blue shades indicate high-throughput and
low-throughput areas, respectively.
2019)) depicts the throughput comparison between
identical 5G cell deployments in 28 GHz (mmW
band) and 3.4 GHz (sub-6 band) in the same serving
area, where the red and blue shades respectively de-
note the maximum achievable throughput in 1.0 Gbps
and 100 Mbps ranges. The key observations about
5G cell deployments in mmW band compared to sub-
6 band are:
• Smaller Serving Area Per Cell: this could be
confused as a disadvantage in the first glance,
however smaller cells means the achievable cell
capacity is divided among fewer users leading
to higher average throughput per-user. To cover
the same geographical area more cells are de-
ployed with less inter-cell interference, thanks to
the fast attenuation of mmW signals. Utility poles
and other alternative radio mounting structures are
discussed in (Medin and Louie, 2019) as common
choices for the operators deploying 5G mmW
cells, whereas the technologies in sub-6 bands can
still rely on the existing designated telecom tow-
ers.
• Significance of LoS Signal Path: unlike the sub-
6 band, the presence of LoS signal path signifi-
cantly correlates with service availability. There-
fore, the signal quality undergoes drastic varia-
tion depending on LoS signal path availability at
instantaneous user location, particularly near the
cell edge. This phenomenon has already been
incorporated in 3GPP standard channel model
(3GPP, 2018a) and still subject of study as in
(Haneda et al., 2016).
2.2 Design Problem Objectives
Here we consider the problem of designing 5G mmW
radio network infrastructure for a given geographic
WINSYS 2021 - 18th International Conference on Wireless Networks and Mobile Systems
18

area without any prior 5G service deployment. There
are two typical deployment scenarios: mobility and
Fixed-Wireless Access (FWA). Mobility services are
offered to mobile user devices (UE) while FWA is
offering broadband connectivity over mmW links to
subscriber devices (CPE) installed on subscribers’
properties (typically in sub-urban / rural areas).
The design process in both scenarios starts with
collecting: topographical survey information (e.g.
terrain, buildings map), property information (e.g.
residential, commercial, public venues), and candi-
date cell deployment sites (e.g. telecom towers, util-
ity poles). Then the desired coverage targets are de-
termined for each scenario considering the following
factors:
• 5G Mobility Coverage Targets: this includes
polygons representing the areas with high user
density / traffic. Since the users are mobile, there
is no need for guaranteed service at any particu-
lar location in the polygon. This is a design relief
since existing approximate predictions model can
still be used to guarantee average service across
each polygon.
• 5G FWA Coverage Targets: Since the wireless
link is used to offer broadband services equiv-
alent to wired technologies (e.g. fiber and ca-
ble modems), the guarantee of service per user
is a more stringent requirement in this scenario.
Thus, the service availability for each subscriber
property (residential, or commercial) should be
individually evaluated in the design phase. there
should be at least a CPE installation point on each
target property with guaranteed service connectiv-
ity.
Although applicable to both scenarios, the proposed
solution in this work is optimized more towards the
more challenging problem of 5G-FWA design.
Maintaining low radio mounting height is another
key practical design objective. Depending on CU-
DU split scenario (3GPP, 2018b) a combination of
directional antennas and other radio hardware com-
ponents should be mounted on candidate site loca-
tions, preferably above the foliage (aka clutter line) to
provide connectivity to the surrounding user devices.
These hardware components exert structural loads
such as wind-loading on their bearing structure (Tra-
vanca et al., 2019). The structural load is proportional
to the mounting height, so the higher the mounting
height, the higher structural reinforcement cost (De-
Grasse, 2013). Considering the increased number of
cells in 5G mmW and the height and load limitations
on the cell candidates (such as utility poles), the struc-
tural cost can become prohibitive without controlling
the mounting height in the design phase.
The 5G mmW design problem is a complex inte-
ger programming task whose output includes a set of
cell site coordinates, mounting height and the angular
orientation of antennas.
2.3 LoS Assessment Problem
As stated in Section 2.1, Existence of LoS signal path
between the user devices and the serving radio can
be accounted as a reliable service availability metric.
This evidently becomes a trade-off based on the fact
that the higher the mounting height, the more user lo-
cations with LoS signal path (Haneda et al., 2016).
Hence, a solution to the sophisticated cellular design
problem will depend on solving the following prob-
lem for each cell site candidate:
Problem 1. (LoS Query): For a given cell deploy-
ment coordinate (on XY -plane) and any user location
point (in XYZ-space), compute the minimum radio
mounting height at the cell site (minRMH) to achieve
LoS between the user and the cell radio.
Computing minRMH for every combination of
candidate site location and user point is a prerequisite
to any design decision. Solving Problem 1 requires
very high-resolution Digital Elevation Model (DEM)
of the serving area that come in considerable data vol-
umes. Hence, any solution algorithm should be effi-
cient in terms of computation complexity per query
since this computation can be repeated in several iter-
ations per each cell site candidate through the design
process.
3 SCOPE OF SOLUTION
This section details the required data source and the
process to solve Problem 1, including: geometric
formulation of LoS problem in terms of minRMH
and they elements of the existing and proposed algo-
rithms.
3.1 Creating DEM from LiDAR Data
Light Detection and Ranging (LiDAR) offers com-
prehensive areal survey data with very high reso-
lution suited for accurate LoS assessment. It is a
high-resolution remote sensing technology using the
pulsed laser transceiver typically mounted under an
aircraft to scan the surface below a raster flight path.
Similar in concept to radar technology, the character-
istics of the returned pulses are used to estimate the
coordinates of the reflection points. The output of
raw LiDAR scan is commonly called a point-cloud
Optimized Line-of-Sight Assessment Algorithm for 5G mmW Network Design using LiDAR Information
19
which is a scattered set of 3D points (in UTM co-
ordinate system) (Wandinger, 2005). Projected in
3D XY Z-space, the points are distributed almost uni-
formly on XY -plane (base-plane) with a fixed step
size. Due to its high demand in various survey appli-
cations in some countries, the government agencies
(e.g. (USGS, 2018)) collect and publicly distribute
LiDAR data on periodic basis for most of the areas.
The raw LiDAR data are normalized and pre-
sented in the form of a Cartesian DEM to study the el-
evation information, where Z-axis values show the el-
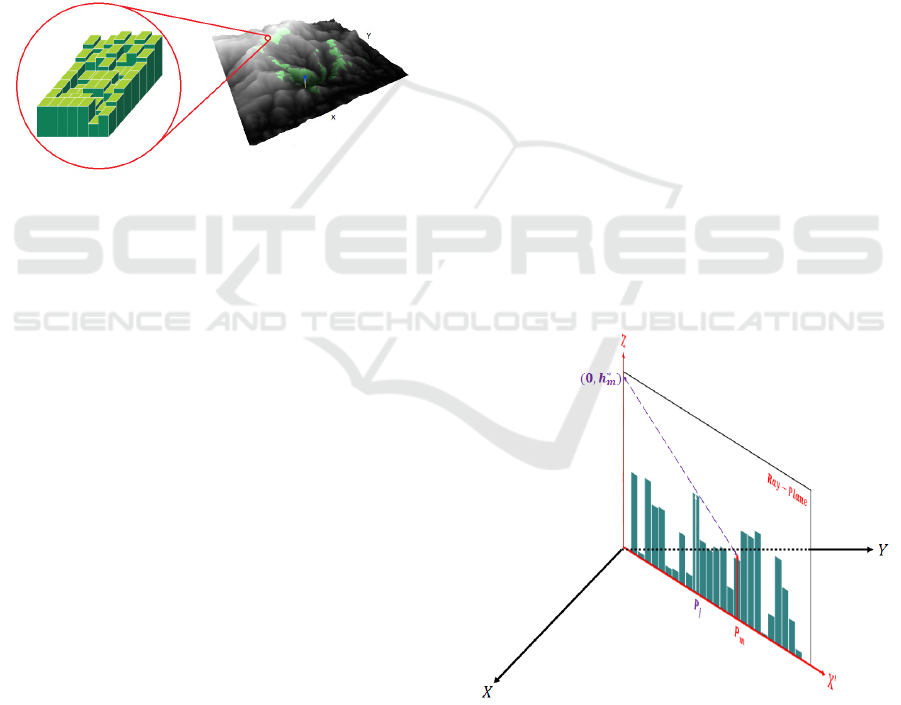
evation across the base plane. An example of outdoor
DEM displayed in Fig. 2. In each iteration of LoS as-
sessment, the candidate cell site is usually mapped to
the origin of XY -plane with possible radio mounting
points along the Z-axis.
Figure 2: Example of outdoor DEM.
LiDAR provides ample resolution compared to
common clutter models using terrain approximation.
For example, the public data provided by USGS offers
70cm leading to a DEM with an enormous data set in
most survey projects. Therefore, efficient algorithms
are required to perform LoS assessment task. DEMs
representing LiDAR data have disproportionate value
range across their dimensions. In a Cartesian system,
expanding the area under study pushes the limit along
X-axis and Y -axis in the scales of kilometers, while
the elevations along Z-axis remain within the range
of hundreds of meters in most topographies.
Remark. To incorporate the scale of DEM size in
algorithm complexity notation, it is modeled as an
N ×N grid of elevation values quantized into K digi-
tal levels. In the subsequent analysis, the algorithmic
complexities are expressed in orders of N while K is
considered an O(1) constant.
3.2 LoS Assessment Geometry
Problem 1 is a classic 3D visibility problem that can
be reduced to a 2D sub-problem in the following sec-
tion.
3.2.1 Creating 2D Sub-problem
Considering a DEM in Cartesian space where the ra-
dio mounted along ”Z-axis, a ray is a line connect-
ing a point on the Z-axis to a user location under
study. This ray together with the Z-axis will form
a half-plane that we refer to as a ray-plane. A ray
indicates a LoS (visibility) condition, if it is not ob-
structed with any other DEM object in between its
two end-points. Hence, examining the DEM points
residing on the ray-plane should be sufficient to deter-
mine LoS condition. More sophisticated propagation
models evaluate LoS conditions for a cluster of rays to
predict signal levels which is outside the scope of this
work. Since the ray-plane will always be perpendicu-
lar to the XY -plane (base-plane), it is simple to iden-
tify the DEM points intersecting with the ray-plane
by projecting the ray onto XY -plane and selecting the
DEM grid points it crosses. Once selected through
this process, the DEM points on the ray-plane can be
represented in a new 2D Cartesian coordinate system
X
0
Z, where a values on X
0
-axis shows the distance of
the point from the Z-axis, and the Z values are pre-
served as the radio mounting height. An example of
ray-plane has been illustrated in Fig. 3 constructed
with Z-axis and a DEM point P
m
.
Henceforth, P = {P
0
, P
1
, P
2
, ··· , P
N
} denotes an
enumerated set of N DEM points P
j
= (x
0
j
, z
j
) in a
ray-plane indexed in asceding order according to their
x
0
j
values for 0 ≤ j ≤ N. The origin is fixed at P
0
and
P
N
denotes farthest point along the X
0
axis, i.e. the
horizon. Here we assume that all elevation values are
normalized by the lowest possible value. The base
ground elevation is assumed to be 0.
Figure 3: Visualizing the ray-plane and a solution for Prob-
lem 2.
Now the LoS query problem for each point in the
ray-plane can be formulated as:
Problem 2. (2D LoS Query): Given the set of ray-
plane points P , and a point P
m
∈ P , compute the
WINSYS 2021 - 18th International Conference on Wireless Networks and Mobile Systems
20

Figure 4: Proposed LoS assessment algorithm.
minRMH value h
∗
m
to reach LoS between the pair of
points: P
m
and (0, h
∗
m
) on X
0
Z-plane.
The value h
∗
m
should be computed such that none
of the intermediate DEM points appear above the line
connecting (0, h
∗
m
) to P
m
. The minimality condition
implies that there would be at least a DEM point P
j
with 0 < j < m barely residing on this line. The
dashed purple line in Fig. 3 demonstrates an exam-
ple solution to Problem 2.
3.2.2 Solving 2D Sub-problem
One can show that each point independently con-
tributes in the value of h
∗
m
. Let h
∗
(m, j) denote the
minRMH for P
m
given the condition that all the inter-
mediate points are eliminated except P
j
, 0 < j < m.
One can draw a line connecting P
m
and P
j
represent-
ing the ray which barely meets LoS. Extending this
line towards Z axis lands at (0, h
∗
(m, j)), where
h
∗
(m, j) =
z
j
x
0
m
−z
m
x
0
j
x
0
m
−x
0
j
(1)
. Applying the max-min technique, it can be shown
that
h
∗
m
= max{h
∗
(m, i)}
m−1
i=1
(2)
3.3 Using Existing Visibility Algorithms
Discovering LoS for pairs of points in a 3D space is a
classic computational geometry problem with wide-
ranging applications (Floriani and Magillo, 2003).
The most common algorithms are optimized to com-
pute what known as viewshed, where all the points in
a DEM with LoS path to a single point are discov-
ered. They are not optimized to accurately compute
minRMH queries as articulated in Problem 1. Re-
purposing viewshed algorithms for this problem may
require iteratively computing viewshed for all possi-
ble radio-mounting values, in O(K), and extracting
minRMH for user locations. In doing so, one of the
best known algorithm developed by Van Kreveld in
(Van Kreveld, 1996) that results in a solution com-
plexity in order of O(KN
2
logN).
R3 algorithm proposed in (Sorensen and Lanter,
1993) is one of the early algorithms that operates in
query fashion and can be modified to solve Problem
2. The computational complexity of (2) is O(N) per
query since (1) should be computed for all the preced-
ing points to P
m
. Put in perceptive to (Van Kreveld,
1996), computing minRMH for the entire DEM using
R3 will result in O(N
3
) complexity.
3.4 Elements of Proposed Algorithm
The proposed algorithm is optimized to process the
Problem 2 queries in constant time, O(1), indepen-
dent to the distance of the query point from the tower
location, proportional to N. Exhaustively solving (2)
for all the DEM points in a ray-plane leads to a O(N
2
)
complexity. The key distinction of the proposed al-
gorithm is using a fast-constructable data structure in
form of a Directed Acyclic Graph (DAG) to reduce
computation complexity of (2). As illustrated in Fig-
ure 4, the proposed algorithm comprised of and extra
offline processing step to construct the DAG and an
online query-handling process.
The reprocessing steps starts with common data
normalization and DEM creation. Then given the can-
didate cell site location, the DEM points are grouped
into a set of possible ray-planes. The set of all pos-
sible ray-planes can be created by considering each
point at the fringe of the DEM and the cell site at the
origin. Then each ray-plane independently undergoes
DAG construction process.
The query handling consists of two steps: ray-
plane determination and minRMH computation. The
first step requires a simple ray-plane look-up based
on the angular orientation of the query point on the
base plane. The second step involves computing (1)
for a collection of points while traversing the pre-
constructed ray-plane DAG.
4 Proposed Algorithm
The key elements of proposed LoS assessment al-
gorithm are detailed in this section by focusing on
the components of an optimal solution to Problem 2
within a given ray-plane.
4.1 DAG Construction
The following proposition provides the key insight to
skip the redundant iteration in (2).
Optimized Line-of-Sight Assessment Algorithm for 5G mmW Network Design using LiDAR Information
21
Proposition 1. Given a point Pm ∈P and a pair of its
preceding points P
i
and P
j
such that 0 < x
0
i
< x
0
j
< x
0
m
,
satisfying h
∗
(m, i) > h
∗
(m, j) requires z
i
> z
j
.
It is straightforward to prove Proposition 1 using
the formula in (1). Since the max operation is used
across h
∗
(m, i) values to compute h
∗
m
, this can be used
in its negative form to ignore points that produce in-
significant h
∗
(m, i) values. Starting from P
m
and iter-
ating backwards to P
0
, after computing h
∗
(m, j) for a
point P
j
, we shall jump to computing h
∗
(m, i) for the
next preceding point P
i
with greater elevation z
i
> z
j
.
We need to continue these jumps until there is no pre-
ceding point with higher elevation. This can save lots
of computation cycles by skipping low intermediate
points in between the jumps. Since this operation may
be repeated to compute minRMH for any points in
a ray-plane, it would be beneficial to determine the
preceding higher point to each point in a single pre-
processing step. This will be a simple variation of
the classic nearest smallest point problem in computer
science, where extremely efficient solution algorithms
are available in (Berkman et al., 1993) and (Berkman
et al., 1998).
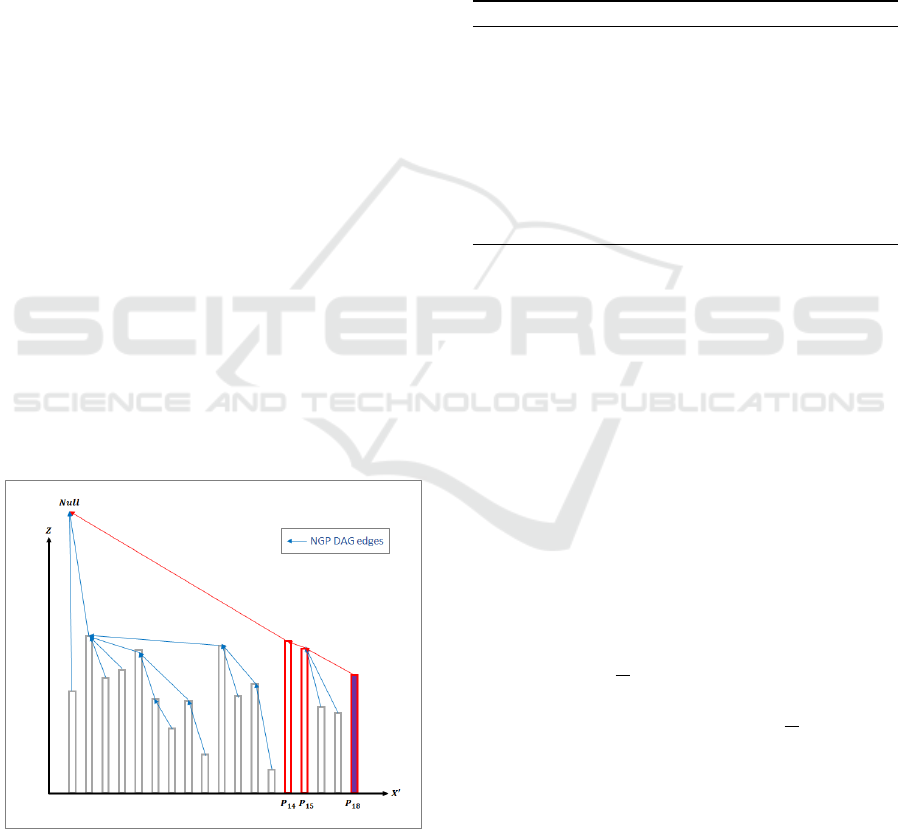
In the context of a ray-plane, the enumerated set
of points in P are augmented in the format of P
i
=
(x
0
i
, z
i
, p
i
) for 0 < i ≤N, where p
i
stands for a pointer
(index) the next-greater-elevation-point (NGP) pre-
ceding P
i
. In each ray-plane there could be some peak
points where p
i
= Null, implying the minimum radi-
ation center be zero. The augmented P can be graph-
ically represented as a DAG demonstrated in Fig. 5,
where the blue arrows show the added pointers, i.e.
DAG edges.
Figure 5: NGP-DAG visualization in a ray-plane.
4.2 DAG Traversal
After constructing the DAG for a given ray-plane with
augmented point set P , the minimum radiation cen-
ter h
∗
m
is computed for each P
i
∈ P by only travers-
ing DAG predecessors of P
i
and computing (1) whose
maximum value reported as minRMH. This proce-
dure is outlined in Algorithm 1.
The red arrows in Fig. 5 depict the DAG traversal
path to compute minRMH for a sample point P
18
. It
shows that Problem 2 can be efficiently solved in 2 it-
erations (evaluating (1) for P
15
and P
14
) using the pro-
posed algorithm, whereas an exhaustive algorithms
requires 17 iterations to evaluate (1) for all the points
P
1
to P
17
.
Algorithm 1: Proposed DAG-traversal Algorithm.
1: procedure (2D LoS Query): P
m
, P
2: h
∗
m
← 0
3: i ← m
4: while p
i
6= Null do
5: h
∗
m
← max(h
∗
(m, i), h
∗
m
)
6: i ← p
i
7: end while
8: return h
∗
m
9: end procedure
4.3 Complexity Analysis
Using the algorithm outlined in (Berkman et al.,
1993) the DAG can be constructed in a near-
constant time O(loglogN) one-shot operation that can
be further improved to an absolute constant order
O(logloglogK) utilizing a hyper-threaded computing
environment (Berkman et al., 1998).
The complexity of the Algorithm 1 determined by
the expected number of the while-loop iterations. The
loop continues as long as there is an NGP with higher
elevation. Therefore, the total number of loop iter-
ations is bounded by the constant K, the number of
possible elevation levels in the DEM. It can be shown
that the expected number of loop iterations is rela-
tive to the expected length of the underlying longest-
increasing-sequence of elevations in each ray-plane,
proved to be O(
√
K) in (Odlyzko and Rains, 2000).
Remark. Combining the two steps, the proposed al-
gorithm achieves a constant-time O(
√
K) solution to
compute minRMH queries in Problem 1.
This algorithm can also be used to compute
minRMH for the entire DEM points (viewshed mode)
in some scenarios such as mobility applications in
municipal areas. The table in Figure 6 summarizes
the performance of the proposed algorithm compared
to the existing algorithms discussed in Section 3.3 for
both scenarios.
WINSYS 2021 - 18th International Conference on Wireless Networks and Mobile Systems
22
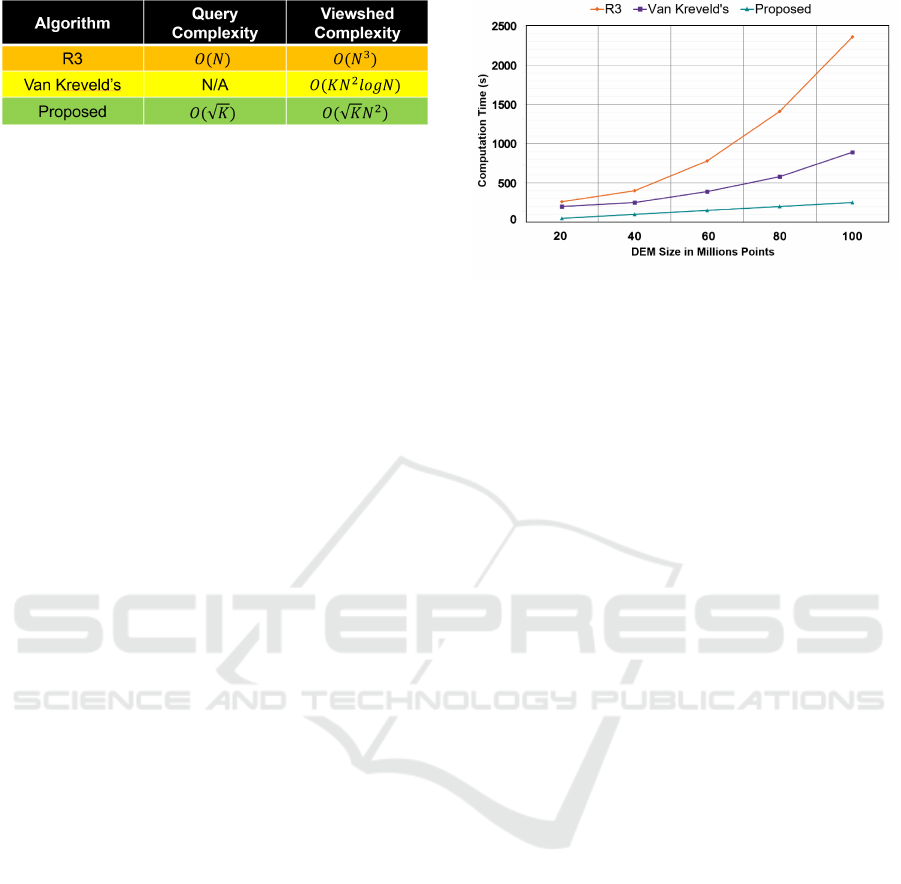
Figure 6: Algorithms’ computational complexities.
5 NUMERICAL RESULTS
In this section, we present the implementation de-
tails for the proposed LoS Assessment algorithm for
a commercial 5G-FWA deployment scenario. Then
compare the computation time with the existing algo-
rithms described in Section 3.3 in the same settings to
demonstrate the predicted efficiency gains.
5.1 Test Environment
The public LiDAR data set for a suburban residen-
tial neighborhood in the central area of the State of
Mississippi are obtained from Mississippi Automated
Resource Information System (MARIS) at (Woolpert,
2014). All algorithms are implemented in C++14
using PDAL (https://pdal.io) utility API to pre-
process the LiDAR data set and create a basic DEM.
The subsequent codes are compiled with gcc -Ofast
utility into executable libraries. The run-time envi-
ronment hosted on a RHEL
r
Linux virtual machine
with access to 16 GB of RAM and 2 Intel XEON
r
processors.
5.2 Test Scenario
The DEM has been created for a maximum of 8 km
radius area around a cell tower of maximum height
60 m as a potential deployment site for 5G FWA in
n257 band ( 28 GHz). To achieve a fair comparison
with (Van Kreveld, 1996), the analysis is performed
in viewshed mode for the proposed algorithm and R3
in (Sorensen and Lanter, 1993). We have computed
minRMH for all the DEM points within a circle cen-
tered at the origin with different radii to achieve dif-
ferent number of point queries shown Figure 7. The
execution time in seconds has been plotted in Figure
7 for all 3 algorithms for different number of DEM
points. Considering the values in horizontal axis is
proportional to N
2
, the execution times follow the ex-
pected complexity trends indicated in Figure 6 table
for the viewshed scenario.
Figure 7: Comparing execution time of the algorithms.
6 CONCLUSION
Considering the practical challenges of 5G mmW net-
work design, we present a comprehensive LoS assess-
ment problem incorporating radio mounting height.
Then we propose a new LoS assessment algorithm
using LiDAR data that is computationally optimized
for the practical aspects of 5G mmW network design.
Empowered by a novel method to topologically sort
terrain data, it achieves constant-time, O(1), com-
plexity to execute LoS assessment per user location,
whereas the complexity of retrofitted LoS algorithms
for the same task grows linearly, O(1) with respect to
the data dimensions. The improvements in the run-
time efficiency are verified in numerical results for
a real deployment scenario. It is worth investigat-
ing means of leveraging this algorithm to reduce the
computational complexity of coverage prediction al-
gorithms based on ray-tracing.
ACKNOWLEDGMENTS
We would like to express our appreciation to Infolink-
USA Inc. staff for providing the opportunity to study
the practical challenges in deploying 5G-FWA net-
works and motivating us to deploy our solution as a
joint venture with their clients.
REFERENCES
3GPP (2018a). LTE; 5G; Study on channel model for fre-
quency spectrum above 6 GHz. Technical Specifica-
tion (TS) 38.900, 3rd Generation Partnership Project
(3GPP). Version 15.0.0.
3GPP (2018b). Study on Central Unit (CU) - Distributed
Unit (DU) lower layer split for NR. Technical
Specification (TS) 38.816, 3rd Generation Partnership
Project (3GPP). Version 15.0.0.
Optimized Line-of-Sight Assessment Algorithm for 5G mmW Network Design using LiDAR Information
23

Berkman, O., Matias, Y., and Ragde, P. (1998). Triply-
logarithmic parallel upper and lower bounds for mini-
mum and range minima over small domains. Journal
of Algorithms, 28(2):197–215.
Berkman, O., Schieber, B., and Vishkin, U. (1993). Optimal
doubly logarithmic parallel algorithms based on find-
ing all nearest smaller values. Journal of Algorithms,
14(3):344–370.
DeGrasse, M. (2013). Tower loading chal-
lenges wireless infrastrucure providers.
https://www.rcrwireless.com/20131002/network-
infrastructure/tower-loading-challenges-wireless-
infrastrucure-providers. Accessed: 2017-09-30.
Floriani, L. and Magillo, P. (2003). Algorithms for visibility
computation on terrains: a survey. Environment and
planning B: Planning and design, 30(5):709–728.
Ghosh, A., Maeder, A., Baker, M., and Chandramouli, D.
(2019). 5g evolution: A view on 5g cellular technol-
ogy beyond 3gpp release 15. IEEE Access, 7:127639–
127651.
Haneda, K., Zhang, J., Tan, L., Liu, G., Zheng, Y., Asplund,
H., Li, J., Wang, Y., Steer, D., Li, C., et al. (2016). 5g
3gpp-like channel models for outdoor urban microcel-
lular and macrocellular environments. In 2016 IEEE
83rd vehicular technology conference (VTC spring),
pages 1–7. IEEE.
Medin, M. and Louie, G. (2019). The 5g ecosystem: Risks
and opportunities for dod. Technical report, Defense
Innovation Board Washington DC United States.
Odlyzko, A. and Rains, E. (2000). On longest increasing
subsequences in random permutations. Contemporary
Mathematics, 251:439–452.
Sorensen, P. A. and Lanter, D. (1993). Two algorithms for
determining partial visibility and reducing data struc-
ture induced error in viewshed analysis. Photogram-
metric Engineering and Remote Sensing, 59:1149–
1160.
Travanca, R., de J. Souza, T., and Andr
´
e, J. (2019). Struc-
tural safety assessment of 5g network infrastructures.
Wiley 5G Ref: The Essential 5G Reference Online,
pages 1–21.
USGS (2018). Lidar Base Specification. Standard 11-B4,
U.S. Geological Survey Standards. Version 1.3.
Van Kreveld, M. (1996). Variations on sweep algorithms:
efficient computation of extended viewsheds and class
intervals, volume 1996. Utrecht University: Informa-
tion and Computing Sciences.
Wandinger, U. (2005). Introduction to lidar. In Lidar, pages
1–18. Springer.
Woolpert (2014). United States Geological Sur-
vey NRCS Laurel MS 0.7 NPS LIDAR.
https://www.maris.state.ms.us/HTML/DATA/
data Elevation/REPORTS/Lidar%20Rpt USGS%
20LaurelMS%20Lidar Dec2014.pdf.
WINSYS 2021 - 18th International Conference on Wireless Networks and Mobile Systems
24
