
EPredictor: An Experimental Platform for Community Evolution
Prediction Tests
Narimene Dakiche
1 a
, Fatima Benbouzid-Si Tayeb
1
, Karima Benatchba
1
, Yahya Slimani
2
,
Abdelouahab Khelifati
1
and Hadjer Chabane
1
1
Laboratoire des M
´
ethodes de Conception de Syst
`
emes (LMCS), Ecole Nationale Sup
´
erieure d’Informatique (ESI),
BP 68M, 16270 Oued Smar, Alger, Algeria
2
Computer Science Department, ISAMM, Institute of Manouba, 2010 Manouba, Tunisia
Keywords:
Dynamic Social Network, Community Detection, Community Evolution, Evolution Prediction.
Abstract:
This paper presents “EPredictor” an experimental platform which enables testing, verifying and validating
models related to community evolution prediction in dynamic social networks. Community evolution pre-
diction is one of the most interesting issues in the field of social network analysis. It is usually handled by
following four main steps: (1) split the network into timeframes; (2) detect communities in each timeframe;
(3) track their evolutionary behavior and (4) build a predictive model to forecast the future events. The main
objective of EPredictor is to provide a flexible environment that handles the entire process of community evo-
lution prediction with a rich set of literature methods for each step; thus enabling researchers to make valuable
comparisons and consistent analysis.
1 INTRODUCTION
Social networks have become ubiquitous and increas-
ingly popular. They have interesting properties that
gave rise to the very active field of Social Network
Analysis (SNA). SNA exploit network and graph the-
ories in order to understand the relationship between
members involved in an interaction for numerous use-
ful purposes. Social networks are usually represented
by graphs in which the nodes represent the social en-
tities (e.g., individuals) and the edges describe so-
cial interactions (e.g., friendship, collaboration, trust,
etc) (Tabassum et al., 2018). A further abstraction of
the network concept is the dynamic network in which
changes occur over time. These changes happen when
new nodes join the network, existing ones leave it, or
when existing pairs of nodes establish a new relation
or terminate an existing one over time.
One important characteristic of social networks is
community structure, i.e., groups of nodes closer to
each other in comparison to other nodes of the net-
work. On a community scale, network dynamics re-
sult in certain evolutionary events such as growth,
merge, split and survive (Br
´
odka et al., 2013). Model-
ing and detecting community evolution have become
a
https://orcid.org/0000-0003-2371-616X
a subject of great interest and many researchers have
contributed to the understanding of the phenomena
(Dakiche et al., 2018). Indeed, the study of commu-
nity evolution plays a prominent role in understand-
ing the changes of networks and predict their future
(Saganowski et al., 2019).
In the related literature, the main issues are how to
detect critical events a community can undergo, how
to track communities over time and how to predict
their future. Existing approaches of predicting com-
munity evolution (Br
´
odka et al., 2013; Takaffoli et al.,
2014; Diakidis et al., 2015;
˙
Ilhan and
¨
O
˘
g
¨
ud
¨
uc
¨
u, 2016;
Pavlopoulou et al., 2017; Saganowski et al., 2019; Ra-
jita et al., 2020; Dakiche et al., 2021) are typically ad-
dressed through the same main steps: (1) split the net-
work into timeframes also called snapshots; (2) detect
communities in each timeframe; (3) track their evolu-
tionary behavior and (4) build a predictive model to
forecast the future events.
For each one of the listed steps, there exist several
literature methods that can be used. However, to the
best of our knowledge, no research tool that handles
the entire process for predicting community evolution
were proposed.
Dakiche, N., Benbouzid-Si Tayeb, F., Benatchba, K., Slimani, Y., Khelifati, A. and Chabane, H.
EPredictor: An Experimental Platform for Community Evolution Prediction Tests.
DOI: 10.5220/0010547502950302
In Proceedings of the 11th Inter national Conference on Simulation and Modeling Methodologies, Technologies and Applications (SIMULTECH 2021), pages 295-302
ISBN: 978-989-758-528-9
Copyright
c
2021 by SCITEPRESS – Science and Technology Publications, Lda. All rights reserved
295

In this paper, we present “EPredictor” an exper-
imental platform that enables testing, verifying and
validating models related to predicting community
evolution in dynamic social networks. Our challenge
is to provide a flexible environment to conduct com-
munity evolution prediction with a rich set of litera-
ture methods for each step; thus enabling researchers
to make valuable comparisons and consistent analy-
sis. Besides, EPredictor can be enriched by adding
other options and methods in each step.
The remainder of this paper is organized as fol-
lows. Section 2 briefly introduces the community evo-
lution prediction approach. Section 3 presents the
EPredictor platform and illustrates its features and
functionalities. Finally, Section 4 gives a resume and
outlines future developments.
2 COMMUNITY EVOLUTION
PREDICTION
Community evolution prediction is usually handled
as a supervised learning task, where the history of a
community is used to predict its future. Often, three
or four past instances are used to train a classifier.
It consists of four main steps as shown in Fig.1: (1)
The dynamic social network data are segmented into
a series of timeframes also called snapshots; (2) Each
timeframe is partitioned using a community detection
algorithm and for each community a set of features,
mostly related to the link structure, such as the size,
cohesion, and density are computed; (3) Then evolu-
tion events of communities in consecutive timeframes
are identified; (4) Finally, a predictive model to fore-
cast community future occurring events is built. The
rest of this section deals with a detail description of
Figure 1: Community evolution prediction process.
these steps.
2.1 Network Splitting
A dynamic social network G = (V, E
t
) is defined by
a set of nodes V and a set of time-stamped edges
describing the interactions among them. Each edge
e ∈ E
t
represents an interaction between two nodes
u, v ∈ V at time t (Holme and Saram
¨
aki, 2012).
In order to analyze the dynamic network G, it is
split into τ consecutive timeframes, thus obtaining a
set of graphs G = (G
0
, ..., G
τ
)., where G
i
= (V
i
, E
i
)
represents a graph with only the set of nodes and
edges that appears in the interval (t
i
,t
i+1
).
2.2 Community Detection
Partitioning a network into communities is a diffi-
cult task; thus, several methods have been proposed
during the last decade, each one of them tailored to
extract communities carrying specific characteristics
(El Moussaoui et al., 2019).
Formally, given a dynamic social network G =
(G
0
, ..., G
τ
) as input, for each snapshot, its corre-
sponding communities are detected. The k commu-
nities detected in the i
th
snapshot are denoted by C
i
=
(C
1
i
,C
2
i
, ...,C
k
i
) where community C
p
i
∈ C
i
, 1 ≤ p ≤ k,
is also a graph denoted by (V
p
i
, E
p
i
).
2.3 Community Matching
The crucial goal of this phase is to detect commu-
nity evolution between consecutive snapshots. It con-
sists in finding series of similar communities in differ-
ent snapshots. Thus, a dynamic community is repre-
sented by its constituent communities ordered by time
snapshots. Formally, the dynamic community is de-
noted by DC = {C
t
0
,C
t
1
, ...,C
t
τ
}, where t
0
< t
1
< ... <
t
τ
and C
t
i
represents its instance community at time
t
i
. Besides, the evolution is represented by the events
a community may undergo from one snapshot to an-
other i.e., events like splitting, growing, merging, dis-
solving and so on. This raises the problem of finding
a given community at time t
i
among those of time t
i+1
.
There are several taxonomies in the literature that
categorize the changes which are likely to occur to
a community. For example, Asur et al. (2009) dis-
tinguish five possible events, i.e., the communities
may dissolve, form, continue, merge and split; while
Br
´
odka et al. (2013), in turn, describe seven no-
ticeable event types: continuing, shrinking, growing,
splitting, merging, dissolving and forming. The com-
munity evolution can then be defined as a sequence
of communities ordered by time, from the timeframe
SIMULTECH 2021 - 11th International Conference on Simulation and Modeling Methodologies, Technologies and Applications
296

Figure 2: Community evolution in a dynamic network (Br
´
odka et al., 2013).
where it first appears to the timeframe where it is last
observed (Fig. 2).
2.4 Prediction
In this step, the predictive model is built. The fea-
tures previously computed and the identified evolu-
tion events are used to create community evolution
sequences. A collection of community evolution se-
quences is the final form of the data used for training
and testing the classifiers.
A community evolution sequence contains a com-
munity and its several past instances from the previ-
ous frames. Formally, it consists of the current com-
munity C
p
t
i
, the p
th
community of timeframe t
i
, and
its previous instances C
p
t
i−1
, C
p
t
i−2
, ..., C
p
t
i−n
. It looks as
follows:
input = (C
p
t
i−n
, ...,C
p
t
i−2
,C
p
t
i−1
,C
p
t
i
) (1)
Each community instance at a specific timeframe is
described by its structural features and its identified
evolution event. Vector (2) represents the structure of
each community instance.
C
p
t
i
= [ f
1
p,t
i
, f
2
p,t
i
, ..., f
k
p,t
i
, event] (2)
The goal of classification is to predict the next
event for a given community. In what follows, we
present in details the EPredictor platform.
3 THE EPredictor PLATFORM
EPredictor
1
is an experimentation platform (Fig.3)
which handle the entire prediction process. It is ded-
icated to test and validate community evolution pre-
diction models. The main objective of EPredictor is
to provide a variety of community evolution predic-
tion experimental scenarios for various real social net-
works. This experimental platform allows to conduct
the prediction process passing through its main steps,
offering for each step the possibility to use different
literature methods. Thus, it offers the possibility to
get a significant number of experiments for only one
network. Besides, it is possible to enrich the platform
by adding other options and methods in each step.
Moreover, EPredictor allows to conduct the predic-
tion process by starting from any step, importing and
1
https://github.com/NarimeneDakiche/EPredicror
exporting multiple kinds of data and visualizing re-
sults of different methods.
Figure 3: The EPredictor platform.
The EPredictor architecture is based on the com-
munity evolution prediction process steps as shown
in Fig.4. It is composed of the following six modules:
a data input/output module allowing to start commu-
nity evolution prediction from any step of the predic-
tion process; a network segmentation module to split
the network into several timeframes; a community de-
tection module to identify corresponding communi-
ties of each timeframe; an attribute computation mod-
ule to compute communities structural features; an
evolution identification module to provide communi-
ties evolution events; a prediction module to forecast
communities future events and a visualization mod-
ule to visualize the results of each one of the previous
modules. In the following subsections, we detail the
functionalities of each module.
3.1 Data Input/Output Module
EPredictor offers the possibility to load different for-
mats and types of data: dynamic network data, time-
frame data, community data, and learning data.
• Loading data from a dynamic network in order to
be split into several timeframes.
As it is shown in Fig.5, EPredictor allows to vi-
sualize some lines of the data source file in order to
observe the information carried on each edge. In-
deed, the edges must be time-stamped and this times-
tamp can have different types. It can be recorded as
EPredictor: An Experimental Platform for Community Evolution Prediction Tests
297
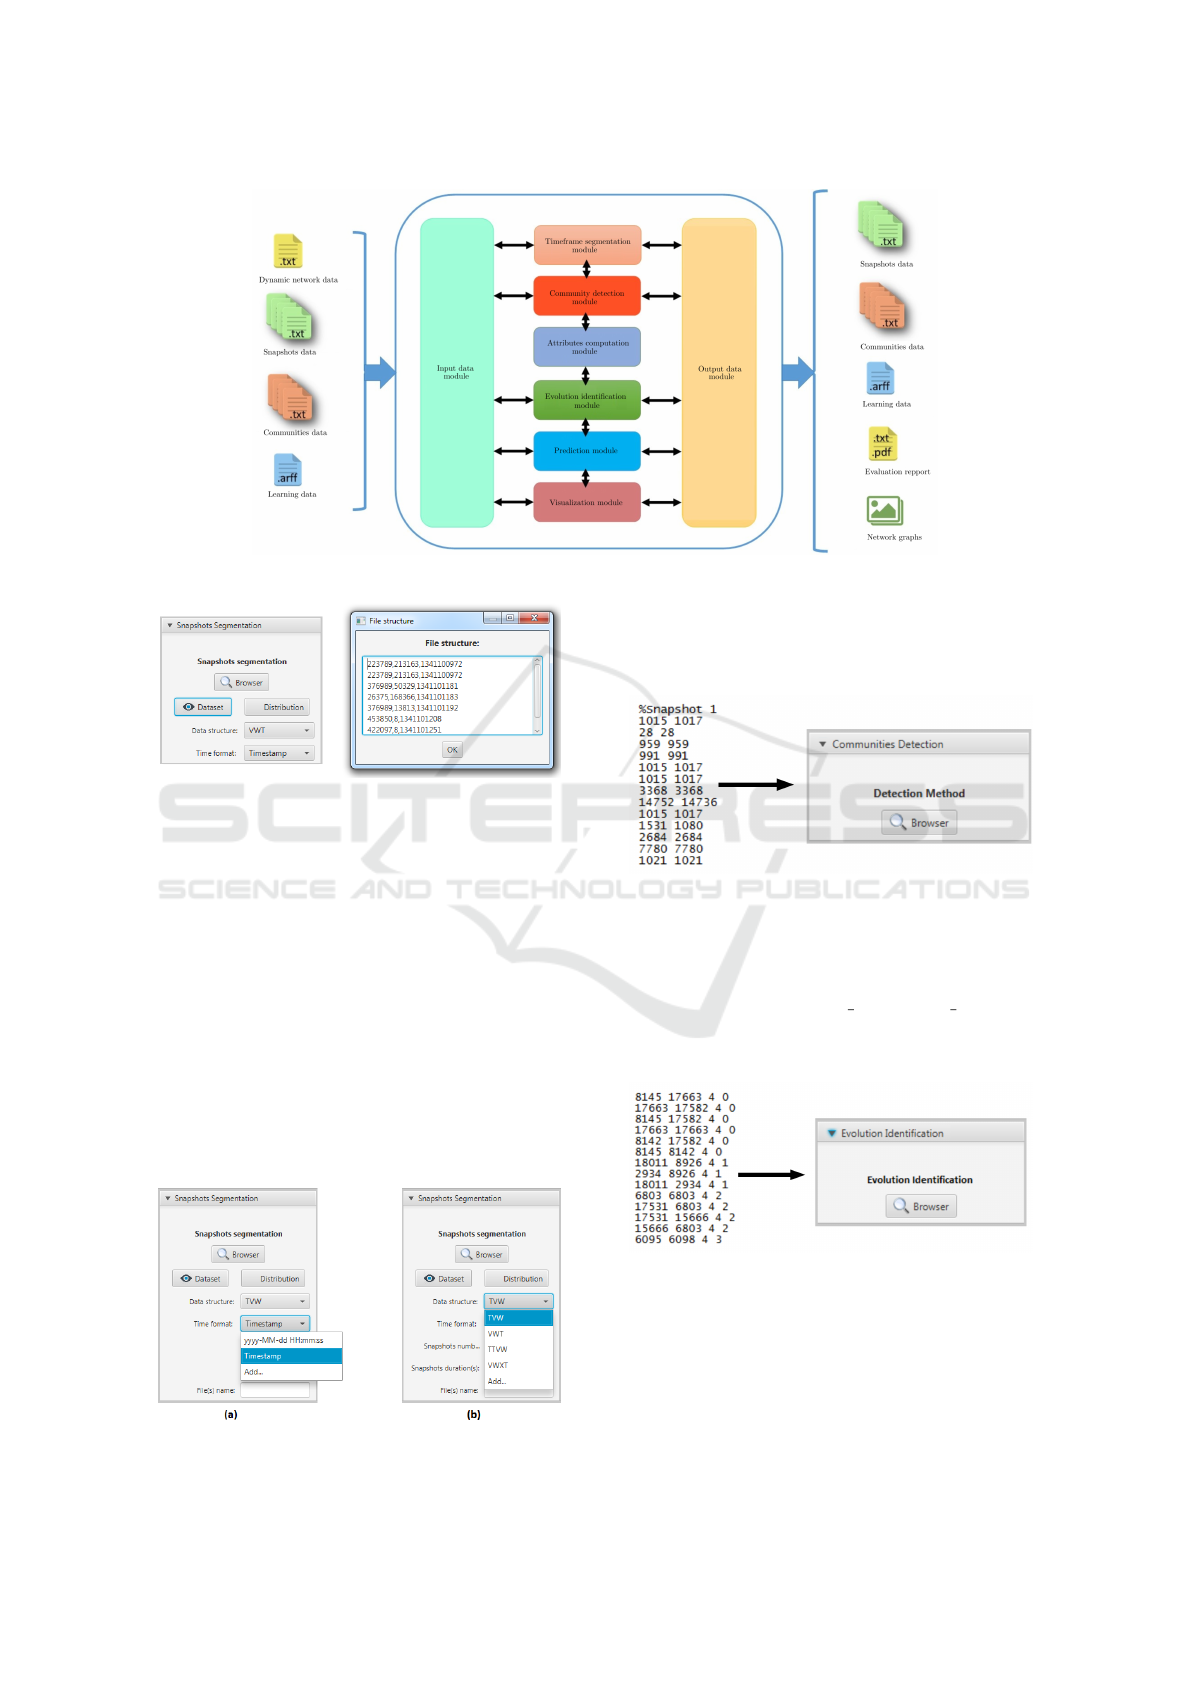
Figure 4: The EPredictor modules.
Figure 5: Loading dynamic network data.
a unix-timestamp “1284101485” or as a human date
“2010-09-10 06:51:25”. It is also possible to add a
new type if needed (see Fig.6-(a)). To correctly pro-
cess the network splitting, the user should specify the
adequate type describing the edges. Besides, the order
of information carried on each edge is important and
should be indicated carefully. For example, an edge
between two nodes V and W can be stored according
to different formats such as node1|node2|Stamp or
Stamp|node1|node2. For this reason, the user should
specify how these three elements are stored in the file
data. The first node is represented by ’V’, the second
node by ’ W’, time by ’T’ and any other information
by ’X’. It is also possible to add a new structure of
data if needed (see Fig.6-(b)).
Figure 6: Timestamp and network data types.
• Loading data from timeframe files (Fig.7): each
file contains data of one snapshot. This data is
used in the step of community detection.
Figure 7: Loading timeframe data.
• Loading data from community files (Fig.8): each
file contains data of detected communities into
one timeframe according to the following format:
node1|node2|community id|snapshot id. This
data is used to compute community attributes and
to identify their evolution events.
Figure 8: Loading community data.
• Loading data from an ARFF file (Hall et al., 2009)
containing the learning instances to be used in the
prediction model.
• Loading a prediction model (.log file) containing
all the methods used in the different steps with all
their required parameters (Fig.9).
SIMULTECH 2021 - 11th International Conference on Simulation and Modeling Methodologies, Technologies and Applications
298
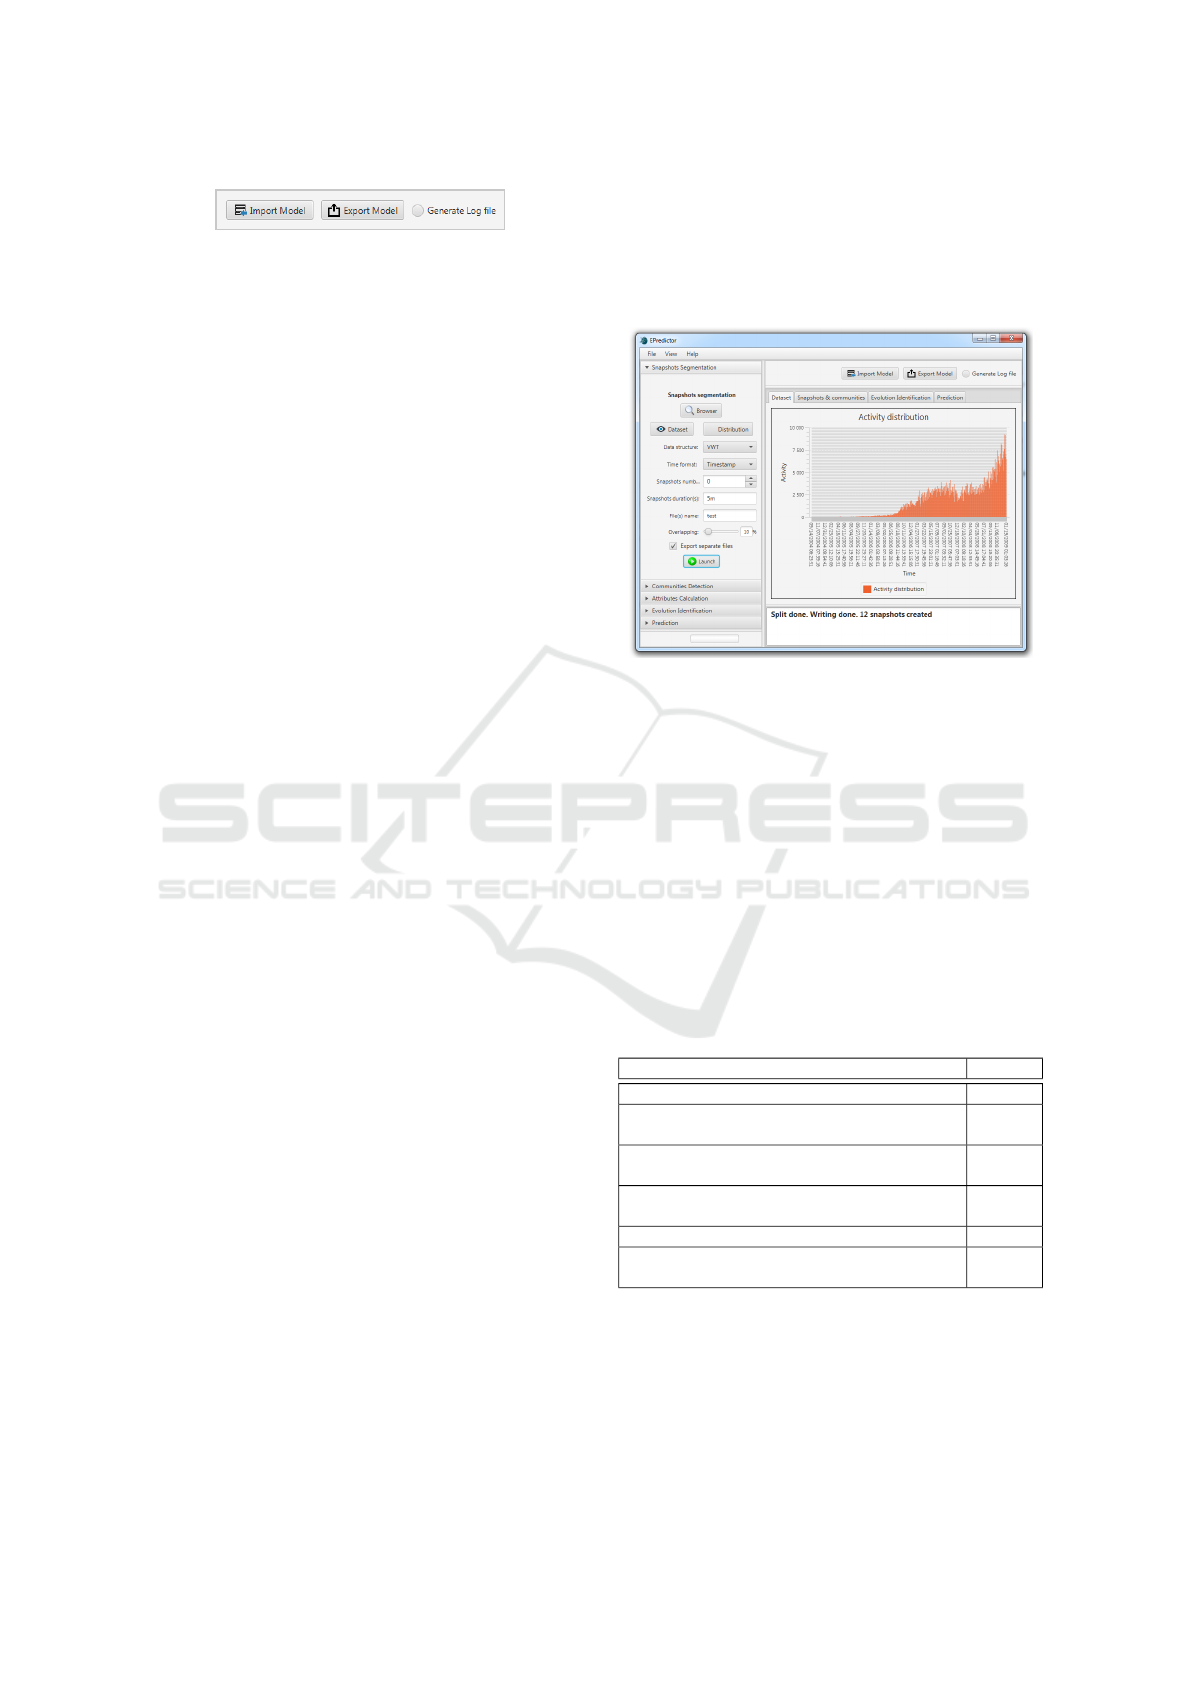
Figure 9: Import / Export of a prediction model.
At the end of each step the results are automat-
ically exported into a folder in the directory of the
executable such as timeframe files, detected commu-
nities, evolution sequences, learning instances and the
final evaluation report.
3.2 The Timeframe Segmentation
Module
This module allows starting the community evolution
prediction from the first step which consists of split-
ting the network data into several timeframes. EPre-
dictor offers several parameters to perform the seg-
mentation which is done according to one or more of
the given parameters as shown in Fig.10. The most
important are the following:
• Timeframe number where EPredictor generates a
set of timeframes covering equal durations.
• Timeframe duration which is an alternative op-
tion to the previous one; indeed, instead of giving
the resulting number of timeframes, the segmenta-
tion can be done according to the duration of each
timeframe. There are two scenarios for using this
parameter:
– One time duration. Giving a single duration
as a parameter means that the durations of all
timeframes must be equal to this duration.
– Multiple durations. The network data may
not be uniformly distributed, so the segmented
timeframes with equal duration can result in a
sequence of empty timeframes. To solve this,
splitting can be done using unequal durations
and thus gathering the successive empty time-
frames in a single one.
Furthermore, EPredictor supports different time
units. In order to introduce a duration, it should be
given in the form “dU” where d is an integer repre-
senting the value of the duration and U is the unit of
time. The time unit could be {H: Hour, D: day, W:
week, M: month, Y: year}.
• The overlapping rate: is the percentage of the
intersection between two consecutive time-
frames. This parameter is used to create common
elements between the various consecutive time-
frames and consequently slow down the evolution
between them in order to better identify the
evolution events. This continuity will be used
for the identification phase of the subsequent
evolution.
The timeframe data will be exported, following
the user’s choice, either in separate files or in one file
with a supplement field indicating the adequate time-
frame. The name of the files in which the data is ex-
ported should be given.
Figure 10: Timeframe segmentation.
3.3 The Community Detection Module
The EPredictor platform offers the possibility to
choose one among several community detection
methods. Indeed, in order to compare the perfor-
mance of different community detection algorithms
on prediction of the community evolution, we in-
cluded various algorithms commonly used in social
network analysis studies (El Moussaoui et al., 2019),
which are presented in Table 1. Two of them detect
disjoint communities, while the others can find com-
munities that overlap which is more realistic in real
social networks.
Table 1: Community detection algorithms.
Method Overlap
CPM (Clique Percolation Method) 3
CONGA (Cluster-Overlap Newman Girvan
Algorithm)
3
COPRA (Community Overlap PRopagation
Algorithm)
3
CONCLUDE (COmplex Network CLUster
DEtection)
7
CM (CliqueMod) 7
SLPA (Speaker-listener Label Propagation
Algorithm)
3
No matter which algorithm is used, at the end of
the community detection on all timeframes, the re-
sults are displayed as shown in Fig.11. In this step,
communities of all timeframes are detected. It is pos-
sible to locate the timeframe data on the disk directly,
without going through the segmentation step. Then
EPredictor: An Experimental Platform for Community Evolution Prediction Tests
299

the method of detection is selected as well as its re-
quired parameter, if it exists, otherwise the parameter
field is not editable. The user could choose whether
or not to export the detection results.
Figure 11: Community detection.
3.4 The Attributes Computation
Module
The next step of EPredictor is to compute a set of
community features that may be important to deter-
mine community evolution and measure the commu-
nities from structural aspects (Tabassum et al., 2018)
(Fig.12). These features encompass many structural
properties; they can describe the community itself
such as size, average density, cohesion, leadership,
reciprocity, and so on. Alternatively, they can define
the nodes belonging to a community such as the total
degree of nodes, the incoming and outgoing degrees,
the intermediate centrality, and so on. The explana-
tions for the features/structural measures, available in
EPredictor, are presented below:
• Size: the number of nodes in the community (n).
• Average Degree: the ratio of the sum of degrees
of the nodes in the community to the number of
nodes in the community:
1
n
n
∑
u=1
d
u
where d
u
means the degree value of node u in the
community.
• Clustering Coefficient: a measure of how com-
plete a node’s neighborhood is to the number of
nodes in the community.
CC
u
=
2t
u
d
u
(d
u−1
)
where t
u
is the the number of triangles in which
node u participates.
• Density: a measure expressing how many con-
nections between nodes are present in the com-
munity in relation to all possible connections be-
tween them:
2 · E
in
n(n − 1)
where E
in
is the number of edges within the com-
munity.
• Diameter: the greatest shortest paths between any
pair of nodes in the community:
max(σ(u, v)) ∀u, v ∈ V
where function σ(u, v) is the shortest path from
node u to v.
• Betweenness Centrality: a node measure describ-
ing the number of the shortest paths from all nodes
to all others that pass through that node.
B
w
=
∑
u6=v6=w
σ
uv
(w)
σ
uv
where σ
uv
align is the total number of the shortest
paths from node u to v and σ
uv
(w) is the number
of those paths that pass through w.
• Cohesion: a measure characterizing strength of
connections inside the group in relation to the
connections outside the group:
2 · E
in
(n
0
− n)
E
out
(n − 1)
where E
out
is the set of outer edges of the commu-
nity and n
0
is the number of nodes in the network.
• Leadership: a measure describing centralization
in the graph or community:
L =
n
∑
u=1
d
max
− d
u
(n − 2)(n − 1)
where d
max
means the maximum value of degree
in the community and n the number of nodes in
the community.
• Closeness Centrality: a node measure defined as
the inverse of the farness, which in turn, is the sum
of distances to all other nodes:
C
u
=
∑
u6=v
1
d(u, v)
where function d(u, v) is distance from node
u to v.
SIMULTECH 2021 - 11th International Conference on Simulation and Modeling Methodologies, Technologies and Applications
300
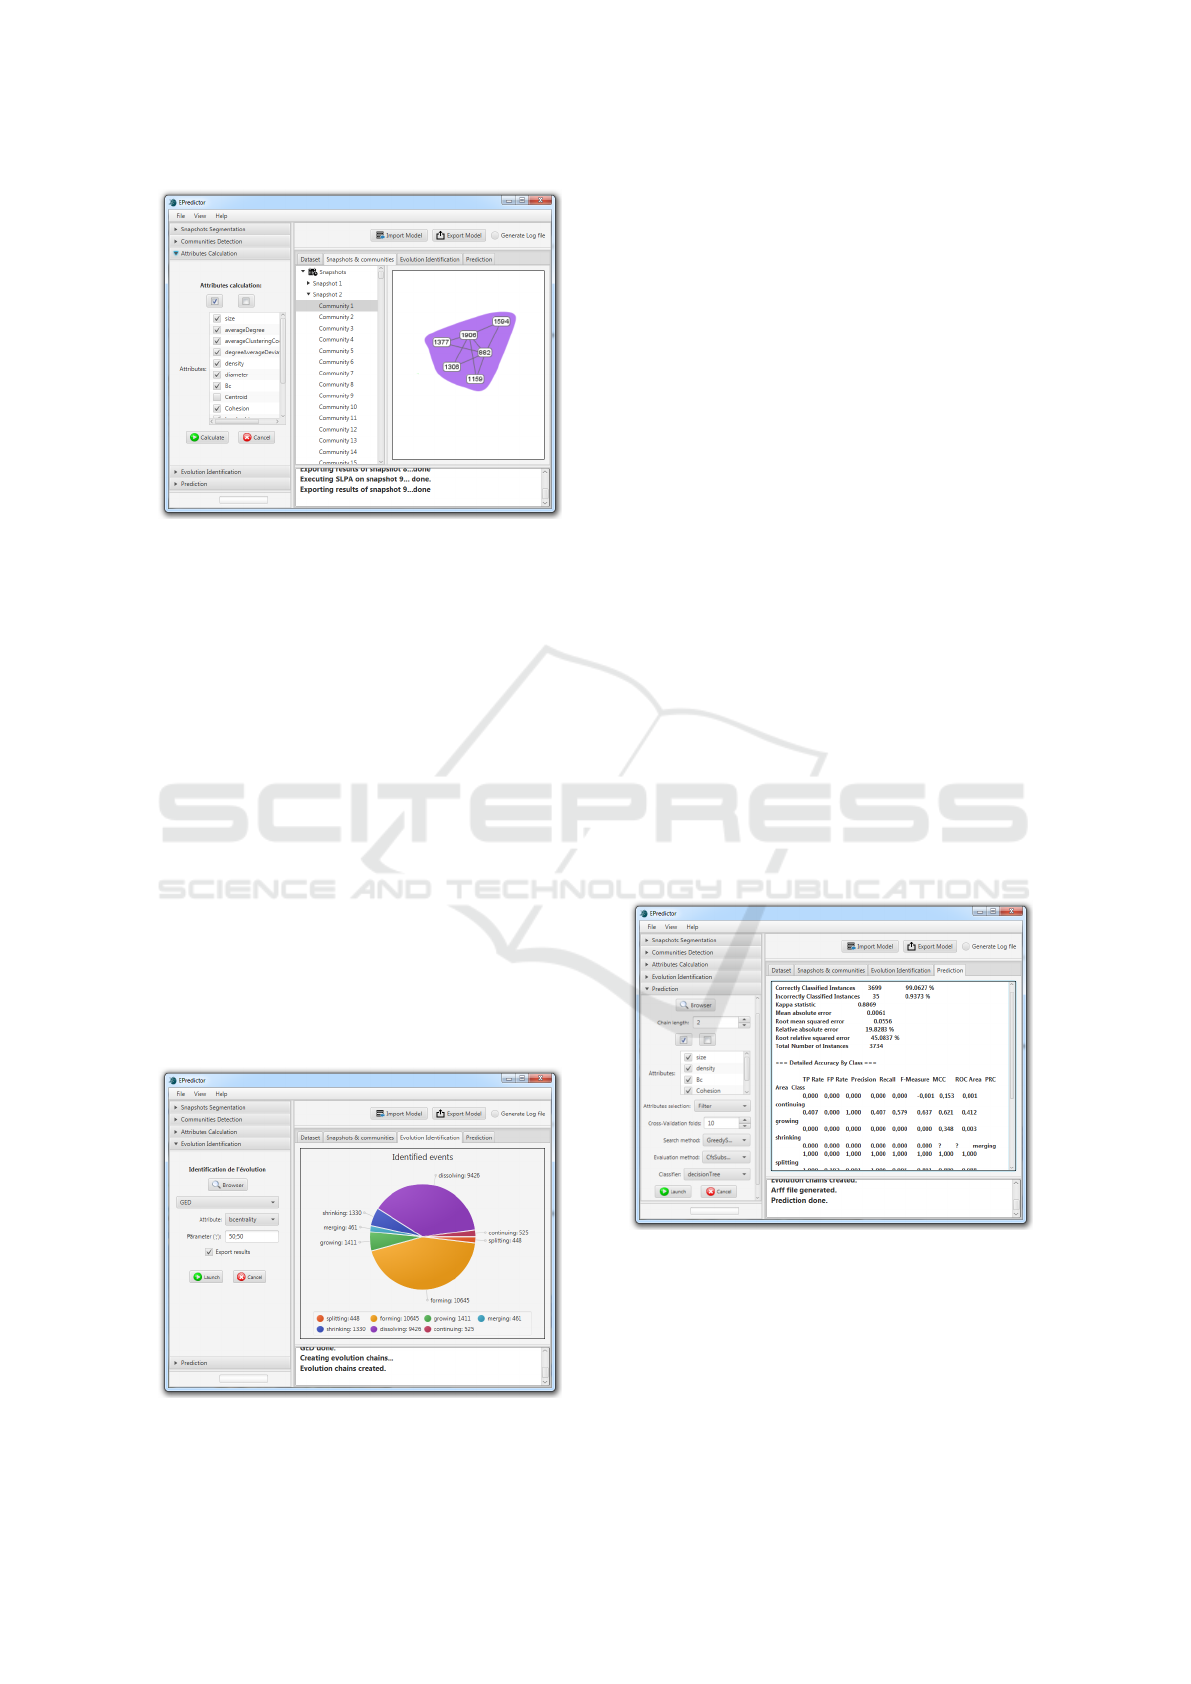
Figure 12: Attribute computation.
3.5 The Evolution Identification Module
This step consists in applying a community tracker in
order to determine the events depicting the evolution-
ary behavior of each detected community. Right now,
there are two methods implemented in the EPredictor
platform: GED (Group Evolution Discovery) (Br
´
odka
et al., 2013) and Asur’s method. For both, it is possi-
ble to introduce the required parameters. For example
GED depends on two parameters (α and β) as well
as a node’s importance measure that could be chosen
among the list of attributes previously computed.
The results are displayed in a chart depicting the
numbers of each identified event as shown in Fig. 13.
If the user starts the prediction process from this step,
community data is loaded directly from the disk. In
this case, the attributes will be automatically com-
puted before starting the evolution events identifica-
tion. According to the user’s choice, the results will
be exported to a database file containing the detected
community evolution sequences.
Figure 13: Evolution event identification.
3.6 The Prediction Module
In the last step, users have the possibility to choose
the classifier to be used for the prediction task. EPre-
dictor includes several Weka classifiers: NaiveBayes,
BayesNet, J48, SMO, randomForest, decisionStump,
perceptron, Logistic, RandomTree, iBk, oneR and
Bagging (Hall et al., 2009). Given the fact that classi-
fication algorithms are sensitive to data, it is pertinent
to use several classifiers to perform credible compar-
isons.
As previously explained, community evolution
sequences are used to train the classifier. Users
could specify the length of community evolution se-
quences as well as the attributes describing a commu-
nity instance from the list of the computed attributes
(Fig.14). For the classification, it is possible to choose
the attribute selection technique; it could be either
manual, by filtering or by encapsulation. The manual
selection considers the attributes notched by the user.
For the selection by filtering or encapsulation, the user
has to choose a research method that defines a subset
of attributes to be used for the prediction. Then, the
predictive capacity of this subset of attributes is eval-
uated. To export the results, if notched, an evaluation
report will be exported in Pdf containing a synthesis
of the built model of prediction. It is also possible to
start the prediction process from this step by loading
the community evolution sequences stored in an .arff
file directly from the disk.
Figure 14: Evolution prediction results.
3.7 Results Visualization
EPredictor allows to visualize the results of the differ-
ent treatments of the community evolution prediction
process. More specifically, the distribution of network
activity over time (Fig.10), the detected communi-
ties and their timeframes (Fig.11, Fig.12), evolution
EPredictor: An Experimental Platform for Community Evolution Prediction Tests
301

identification results (Fig.13) and prediction results
(Fig.14). It also allows to export an evaluation report
containing all user entries and statistics of different
results throughout the prediction process.
4 CONCLUSION
In this paper, the EPredictor platform, a research tool,
was described and its usability was presented in de-
tail for the community evolution prediction issue. To
the best of our knowledge, no other research tools,
that handle the entire community evolution predic-
tion process, were proposed for predicting commu-
nity evolution in dynamic social networks. We have
presented step by step all the options offered by the
platform in order to make visible the range of func-
tionalities which can be involved for one particular
network. Several experiments were conducted by stu-
dents for their Master dissertation, which proved the
usability of the current version of the EPredictor plat-
form for educational purposes. We meant, through
this paper, to present the EPredictor platform to the
researchers in the field of social network analysis in
order to prove its usability for research purposes. Yet,
the platform is still being developed and new func-
tionalities are constantly incorporated in order to en-
rich the set of methods proposed by the platform for
each step. The EPredictor platform is now available
for academic and other non-commercial purposes.
REFERENCES
Asur, S., Parthasarathy, S., and Ucar, D. (2009). An event-
based framework for characterizing the evolutionary
behavior of interaction graphs. ACM Transactions on
Knowledge Discovery from Data (TKDD), 3(4):1–36.
Br
´
odka, P., Saganowski, S., and Kazienko, P. (2013).
Ged: the method for group evolution discovery in so-
cial networks. Social Network Analysis and Mining,
3(1):1–14.
Dakiche, N., Benbouzid-Si Tayeb, F., Benatchba, K., and
Slimani, Y. (2021). Tailored network splitting for
community evolution prediction in dynamic social
networks. New Generation Computing, pages 1–38.
Dakiche, N., Benbouzid−Si Tayeb, F., Slimani, Y., and Be-
natchba, K. (2018). Tracking community evolution in
social networks: A survey. Information Processing &
Management.
Diakidis, G., Karna, D., Fasarakis-Hilliard, D., Vogiatzis,
D., and Paliouras, G. (2015). Predicting the evolution
of communities in social networks. In Proceedings of
the 5th International Conference on Web Intelligence,
Mining and Semantics, pages 1–6. ACM.
El Moussaoui, M., Agouti, T., Tikniouine, A., and El Ad-
nani, M. (2019). A comprehensive literature review on
community detection: Approaches and applications.
Procedia Computer Science, 151:295–302.
Hall, M., Frank, E., Holmes, G., Pfahringer, B., Reutemann,
P., and Witten, I. H. (2009). The weka data min-
ing software: an update. ACM SIGKDD explorations
newsletter, 11(1):10–18.
Holme, P. and Saram
¨
aki, J. (2012). Temporal networks.
Physics reports, 519(3):97–125.
˙
Ilhan, N. and
¨
O
˘
g
¨
ud
¨
uc
¨
u, S¸. G. (2016). Feature identification
for predicting community evolution in dynamic social
networks. Engineering Applications of Artificial In-
telligence, 55:202–218.
Pavlopoulou, M. E. G., Tzortzis, G., Vogiatzis, D., and
Paliouras, G. (2017). Predicting the evolution of com-
munities in social networks using structural and tem-
poral features. In 2017 12th International Workshop
on Semantic and Social Media Adaptation and Per-
sonalization (SMAP), pages 40–45. IEEE.
Rajita, B., Ranjan, Y., Umesh, C. T., and Panda, S. (2020).
Spark-based parallel method for prediction of events.
Arabian Journal for Science and Engineering, pages
1–17.
Saganowski, S., Br
´
odka, P., Koziarski, M., and Kazienko,
P. (2019). Analysis of group evolution prediction in
complex networks. PloS one, 14(10):e0224194.
Tabassum, S., Pereira, F. S., Fernandes, S., and Gama, J.
(2018). Social network analysis: An overview. Wiley
Interdisciplinary Reviews: Data Mining and Knowl-
edge Discovery, 8(5):e1256.
Takaffoli, M., Rabbany, R., and Za
¨
ıane, O. R. (2014). Com-
munity evolution prediction in dynamic social net-
works. In 2014 IEEE/ACM International Conference
on Advances in Social Networks Analysis and Mining
(ASONAM), pages 9–16. IEEE.
SIMULTECH 2021 - 11th International Conference on Simulation and Modeling Methodologies, Technologies and Applications
302
