
Estimation of the Features Influence on Cluster Partition
Daria Kolesnikova, Yuri Andreev and Radda Iureva
ITMO University, Saint Petersburg, Russian Federation
Keywords: Clustering, Machine Learning, Dataset, Preference, Production Planning.
Abstract: The use of machine learning and clustering tools for production management, operational and strategic
planning is an urgent task. Industrial automation and Industry 4.0 in general stimulate the use of new
technologies. So, for the analytics of many business processes and tasks, it is possible to use clustering. This
paper evaluates the clustering performance for supplier evaluation considering the influence of preference
features. Clustering is mostly unsupervised procedure, and most clustering algorithm depend on some certain
assumptions. Subgroups present in the dataset are formed on the base of these assumptions. Consequently, in
most cases, the resulting cluster groups require validation and reliability assessment.
1 INTRODUCTION
Modern experimental techniques and algorithms
allow experiments with high resolution and,
consequently, lead to large data amounts production.
In turn, these datasets require effective machine-
learning techniques for information analyzation and
extraction. Among them, pattern recognition in noisy
data is still a challenge. The main goal is to combine
the ability of the human brain to detect patterns in
extremely noisy data with the power of computer
automation. Cluster analysis allows to group
multidimensional data points that have similar
properties and thus discover possible functional
relationships in data subsets.
Incorrect parameter values can lead to either the
inclusion of random fluctuations in the results, or the
ignoring of potentially important data. The optimal
solution has features values for which clustering does
not yield any results for a purely random dataset, but
which detects cluster formation with maximum
resolution on the randomness verge (Veit
Schwämmle et al. 2010).
2 ALGORITHMS AND
FEATURES
2.1 Literature Review
In most simple terms, data clustering can be
considered as a method to identify significant
underlying patterns in data, referring to statistical
distributions followed by distinct classes to which the
data can be categorized (Duda and Hart, 1973; Jain
and Dubes, 1988; Galdi et al. 2014).
Data clustering is a basic statistical distribution
method with distinct classes by which data can be
categorized. Clustering algorithms can be used as a
preprocessing step before performing classification
tasks (Dermoudy et al. 2009).
Researchers are developing a variety of efficient
techniques for information extraction and image
classification. Thus, distance-based clustering
algorithms are widely used and researched, they have
a simple implementation in various scenarios (Batra
2011). The main problem and limitation of the use of
these algorithms is the choice of an appropriate
similarity metric. This metric helps distinguish
similar data points from dissimilar ones without
supervision. The clustering problem can be solved
and simplified by using the distance metric for the
data type being used (Aggarwal 2003; Aggarwal and
Reddy 2013).
Traditional clustering techniques aim to calculate
the similarity between data points. They use
Euclidean distance. However, this technique is only
suitable for numeric datasets (Duda and Hart 1973).
But modern datasets are more complex; most datasets
are mixed and contain both numerical and categorical
attributes, which makes the Euclidean distance
function unable to estimate the similarity between
two data points (Zhang and Gu 2014).
The main problem of clustering is to divide a
given dataset into groups (clusters) so that the data
Kolesnikova, D., Andreev, Y. and Iureva, R.
Estimation of the Features Influence on Cluster Partition.
DOI: 10.5220/0010545907390744
In Proceedings of the 18th International Conference on Informatics in Control, Automation and Robotics (ICINCO 2021), pages 739-744
ISBN: 978-989-758-522-7
Copyright
c
2021 by SCITEPRESS – Science and Technology Publications, Lda. All rights reserved
739
points in the cluster are more like each other than the
points in different clusters (Sudipto Guha et al.,
1998). In the clustering process, it becomes difficult
because predefined classes and examples are not
provided that can demonstrate what desired
relationships should be valid between data (M. Berry,
G. Linoff, 1996). This difference lies in the separation
of the concepts of clustering and classification (U. M.
Fayyad, Gregory Piatesky-Shapiro et al., 1996, U. M.
Fayyad, R. Uthurusamy, 1996).
The identification of important basic data
patterns, such as image composition and spatial
location, is fundamental to remote sensing
applications. This is how the research and
development of an effective information extraction
approach becomes relevant, which is critical to
achieving this goal. The Affinity Propagation
Algorithm (AP) is one of the new and important
techniques. It allows you to handle unusual data -
mixed data that have both categorical and numeric
attributes. However, the algorithm has certain
limitations associated with the choice of the initial
preference parameter, the occurrence of fluctuations
and the processing of large data sets (Moiane, André,
Machado, Álvaro, 2018).
Parameter estimation is based on the parametric
model for which there is the best fit. Parameter
estimators can be categorized as follows:
whether they optimize a reliable or unreliable
compliance criterion;
whether they use statistics in data space or in
parameter space;
whether they imply a parametric probability
density for data or parameters.
Parameter Clustering (PC) is a technique that
calculates reliable location as well as parameter space
variance statistics. For location and variance
estimates, a density model is not required, and thus
parameter clustering is usually implemented without
accepting specific densities as a so-called
nonparametric method. (Ulrich Hillenbrandm, 2007)
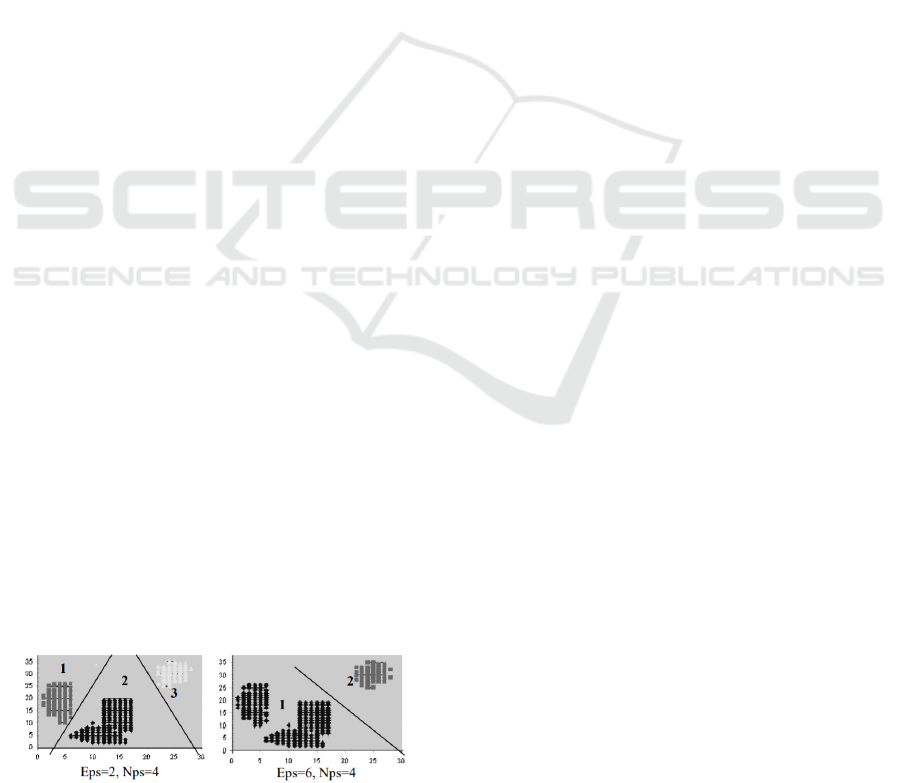
In Figure 1 we can see the way an algorithm
DBSCAN (Martin Ester et al., 1996) partition a data
set having different input parameter values.
The final sentence of a caption must end with a
period.
Figure 1: The difference in resulting partition with different
input parameters values (DBSCAN algorithm).
The general algorithm of parameter clustering has
been distributed in numerous variations (D. H.
Ballard, 1981, G. Stockmann, et al., 1982, G.
Stockmann, 1987, J. Illingworth and J. Kittler, 1988,
S. Moss et al., 1999). One of the more popular uses is
the numerous Hough transform options. A common
feature for the approaches used is the specificity of
data sampling. Data samples are taken from which
parameter samples are computed. These are often
referred to as "votes", which satisfy the constraints
imposed by each data sample. The intuition is that a
large population of data corresponding to an instance
of a model constraint will create many parameter
samples that are approximately the same, and
therefore localized in the cluster (Halkidi M., 2001).
2.2 Clustering Algorithm
Clustering algorithms are often used to analyze
numerous objects, for example genes in microarray
data, each containing a number of values obtained at
different experimental conditions. In other terms, the
dataset consists of N object vectors of D dimensions
(experimental conditions), and thus an optimal
framework contains N × D experimental values. The
aim is to group these objects into clusters with similar
behaviors.
Important issue is the correct choice of feature for
clustering, which has not been properly considered in
the literature. The purpose of this article is to analyze
the problem from the point of view of statistical
consistency. This question requires an estimate that
must correspond to some property of the underlying
dataset within infinite data samples. If a specific
parametric form of a data set is assumed, it is
necessary that the estimated feature takes on the value
underlying this set.
2.3 Supplier Evaluation as an Integral
Part of Production Organization
Data mining is a broad concept and today there are
dozens of its definitions. In the most general sense,
data analysis is research related to the calculation of
a multidimensional data system that has many
features. In the process of data analyzing, researcher
performs a set of actions to determine the ideas about
phenomena nature described by these data. Typically,
various mathematical methods are used to analyze
data. Data analysis should not be viewed only as
processing information after it has been collected.
Data Mining has found wide application in
science, research, web analytics, but data mining
plays a major role and decisive role in business and is
ICINCO 2021 - 18th International Conference on Informatics in Control, Automation and Robotics
740
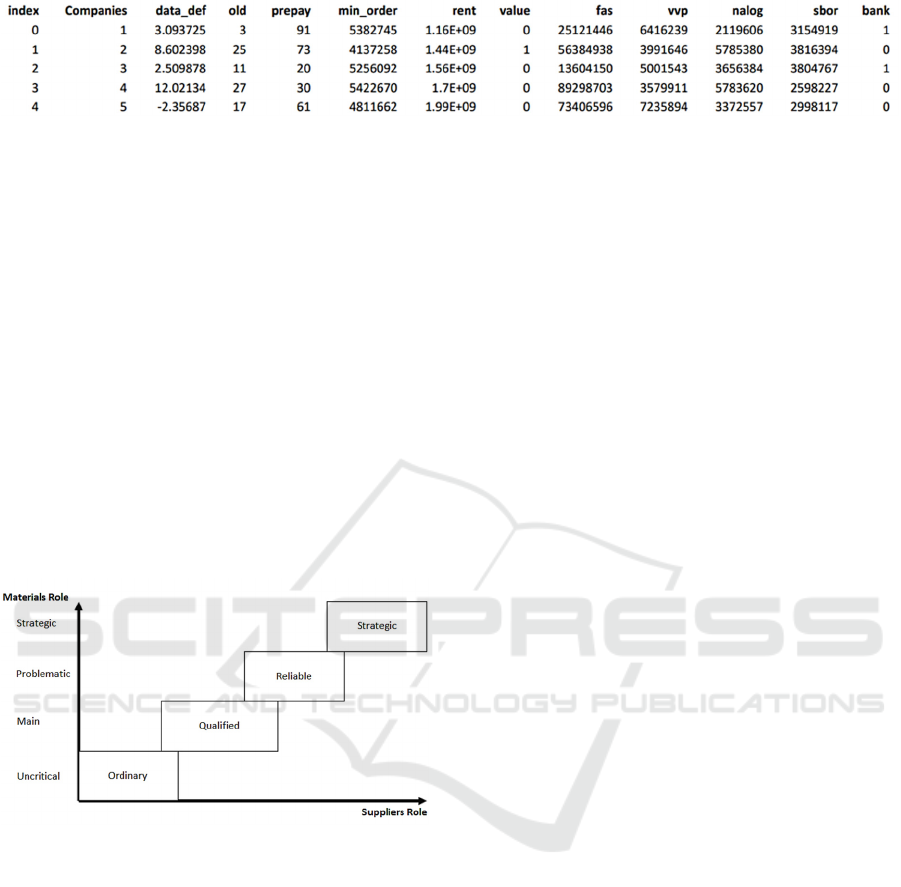
Figure 3: Suppliers Information.
excellent for solving business problems. For example,
the following tasks can be solved:
customer segmentation;
sales forecasting;
warehouse stock analytics;
deciding on individual discounts for clients;
supplier evaluation.
Supplier reliability is an important component of
a company's success and sustainability. However, it is
not enough to find suppliers, it is necessary to
determine the right one for the enterprise. And not
always the price may be the main factor. Even a low
price can be offset by expensive delivery from the
distributor's warehouse.
Categories (roles) of suppliers can be defined
depending on the category of materials (Figure 2).
Figure 2: Supplier Role Dependence on Material Role.
Supplier evaluation is carried out to:
assess existing and future suppliers;
obtain detailed information about each
supplier;
tool for analysis and development of suppliers
and their suppliers
decision making based on facts
confidence in the reliability of supplier-related
processes.
List of important criteria for evaluating a supplier:
1. Product price.
2. The relevance of warehouse balances.
3. Ability to automatically sync inventory
balances.
4. Availability of certificates, licenses, and other
documents.
5. Terms of work and payments.
6. Remoteness of the warehouse.
7. Delivery time control.
8. Product quality.
9. Delivery terms.
10. Minimum order amount.
11. The breadth of the range.
2.4 Vendor Evaluation using Machine
Learning
Machine learning is at the intersection of
mathematical statistics, optimization methods and
classical mathematical disciplines, but it also has its
own specifics related to the problems of
computational efficiency and overfitting.
Evaluation of the quality of work of suppliers and,
directly, information about suppliers is the necessary
information for production planning. This
information supports the implementation of the
supply security risk assessment.
In the course of the work, the production suppliers
were divided into four classes of reliability:
high reliability,
average reliability,
low reliability,
special class for companies that have interacted
with once.
Figure 3 shows an example table of supplier data.
Table on the Figure 3 contains the following
features of companies:
Index - company's place value in the database;
Companies - assigned company serial number;
Data_def - probability of delivery date failure;
Old - number of years on the market;
Prepay – prepayment percentage value;
Min_order - minimum order amount;
Rent - annual turnover (value for the previous
year);
Value - transactions amount with company;
Fas - reliability indicator of Federal
Antimonopoly Service;
Estimation of the Features Influence on Cluster Partition
741

Vvp - year gross profitability;
Nalog - tax debt amount;
Sbor – fees debt amount;
Bank - information about the bankruptcy of the
company.
The use of suppliers’ division into classes is suitable
for serial and mass production, but it would be
inappropriate for unit and sometimes small-serial
production. This is explained by the concepts of
production types.
Unit production is a form of production
organization that make various types of products in
one or more copies (piece production). The main
features of unit production are that the plant program
usually consists large range of products for various
purposes, the release of each product is planned in
limited quantities. Products range in the plant's
program is unstable. Nomenclature instability, its
diversity, limited production led to limitation of
standardized design and technological solutions
usage. In this case, the proportion of original parts is
high, and the proportion of standardized parts is very
small. Each unit of the final product is unique in
design, performed tasks and other important
characteristics.
So, suppliers’ determination for a unit (small-scale)
production does not require large number of
suppliers’ consideration and suppliers’ features
varying (for example, price, delivery speed, quality,
etc.). But serial or mass productions are characterized
by release constancy of products large range.
Moreover, manufactured products annual
nomenclature is wider than the nomenclature of each
month. These factors allow to organize products
release rhythmically. Products releases in large
quantities allow significant unification of
manufactured products and technological processes.
In addition, these production types allow manufacture
of standard or normalized parts included in the design
series that reduces their cost.
Consequently, orders to be fulfilled it is obligatory
to deliver purchased materials in time, as well as to
ensure their quality and price. Creation of supplier
base is urgent task and ensures creation of well-
functioning production. The supplier base is
constantly changing, new data and various partners
are being introduced. Since the market does not stand
still, and a partner can go bankrupt, raise prices,
change the range or quality of products. And in
general, the market is changing, new products appear,
and old ones go out of market.
Presented data in Table 1 can be suitable for variety
of serial and mass production. Because suppliers’
characteristics are generally uniform and describe
important aspects. Thus, it is possible to optimize
supplier assessment and automate this process.
Resulting clusters provide comprehensive assessment
and information about their content and allow to
compare applicants by their main features.
2.5 Vendor Evaluation using Machine
Learning
Machine learning is at the intersection of
mathematical statistics, optimization methods and
classical mathematical disciplines, but it also has its
own specifics related to the problems of
computational efficiency and overfitting.
Evaluation of the quality of work of suppliers and,
directly, information about suppliers is the necessary
information for production planning. This
information supports the implementation of the
supply security risk assessment.
In the process of clustering object is elementary
data set with which the clustering algorithm works.
For each object features are determined and describe
it. Features are combined into a vector of
characteristics 𝑥=(𝑥
,𝑥
,…𝑥
), where m – is space
dimension of characteristics, and 𝑥
– is a separate
characteristic of the object (qualitative or
quantitative).
Similarity measure of two objects d(u, v) is the
distance between these objects. This variable is
calculated according to a given metric, where u, v –
are elements of the set.
Cluster analysis can be represented as the
following sequence of actions:
1. Multiple objects selection.
2. Variable set determination for objects
evaluation and characteristics vectors
formation.
3. Characteristics vectors normalization by one
of the available methods.
4. Similarity determination between objects
according to the given metric.
5. Selected method of cluster analysis
application for dividing a set of objects into
clusters based on the degree of similarity.
6. Presentation of analysis results.
In the given dataset are used next parameters:
Index, Cluster, Weight_all, Level_of_conformity,
Weight_the_best, Grade, Certification, Relaibility,
Technology, Value.
ICINCO 2021 - 18th International Conference on Informatics in Control, Automation and Robotics
742
3 CLUSTERS ASSESSMENT
After creating a cluster solution, the question usually
arises of how stable and statistically significant it is.
There are many methods and criteria for assessing the
quality of clustering validation results in the
literature.
There are several approaches to cluster validation:
external validation, which consists in
comparing the results of cluster analysis
with a previously known result (i.e., the
labels of the clusters are known a priori);
relative validation, which evaluates the
cluster structure by changing various
features of the same algorithm (for example,
the number of groups k);
internal validation that uses internal
information from the clustering process (if
external information is not available);
assessment of the stability of clustering (or a
special version of internal validation) using
resampling methods.
Decision tree. The decision tree algorithm
classifies objects by answering "questions" about
their attributes located at the nodal points. Depending
on the answer, one of the branches is selected, and so
on until the “leaf” is reached - the final answer.
Decision tree applications include knowledge
management platforms for customer service,
predictive pricing, and product planning.
Thus, clusters assessment depends on production
needs at the considered time moment. It should be
noted that supplied goods cannot be of high quality,
cheap and have fast delivery at the same time. It is
based on the classic form of triple constraint, which
describes the balance between project scope, cost,
time, and quality (Microsoft Support, 2019).
Evaluation and selection of presented suppliers
correspond to the necessary production requests. Let
us consider an example of forming clusters on the
studied dataset and plot their parameters graphs
(figure 4).
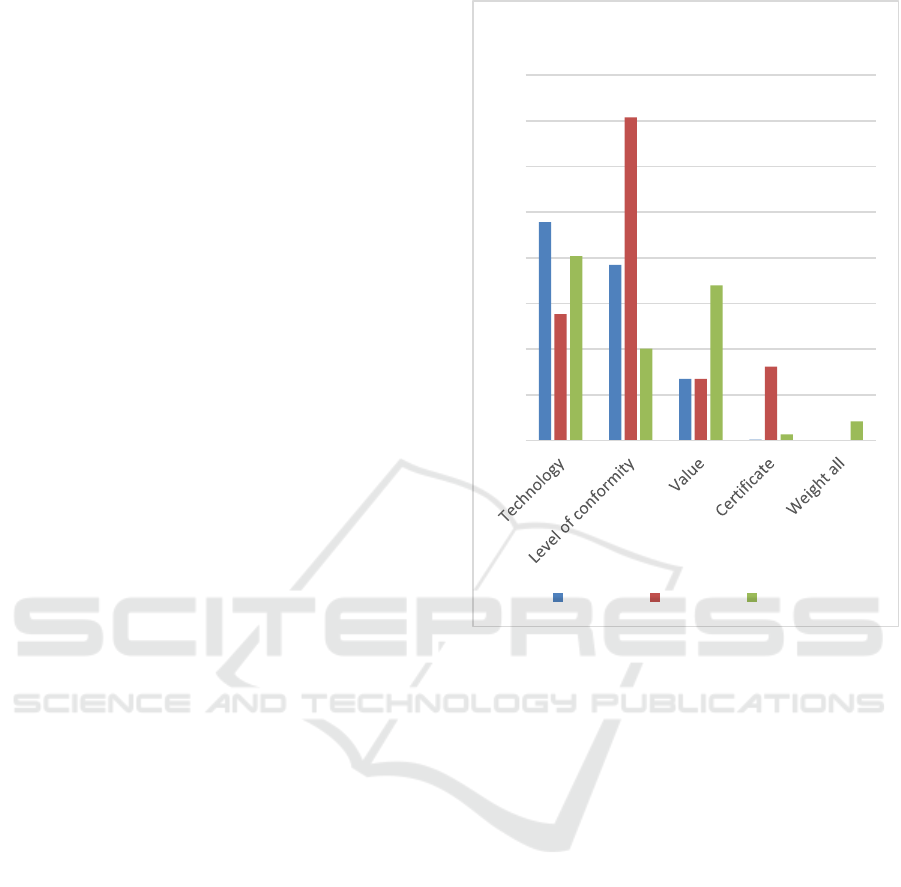
The figures 4 show graph that describe the
characteristics of the resulting clusters.
The figure shows data on three clusters, the
assessment can be carried out for five main features.
Consequently, for Cluster 1 features “Level of
conformity” and “Certificate” are strongly higher
than for two other clusters. If the company needs to
have qualitative and certificated materials it is
strongly recommended to choose suppliers from
Cluster 1.
Figure 4: Comparison of clusters characteristics.
4 CONCLUSIONS
The index results, as indicated by experiments, are
not dependent on the clustering algorithm used, and
always indicate the optimal input features for the
algorithm used in each case. It performs better than
the most recent validity indices proposed in the
literature as it was indicated by experimental
evaluation.
In conclusion, it is important to note that the
application of machine learning and clustering
algorithms, and other tools in the enterprise planning
field is new and urgent task. In the presented example
the use of clustering tools allowed us to evaluate
suppliers. In the work assessment approach of the
suppliers features dataset was implemented (for serial
and mass production). It was also noted that this
example can be used repeatedly for similar industries.
As a result of the work, three clusters were obtained.
The assessment of clusters can be different. For the
considered example, a visual assessment of the
obtained data was chosen.
0
0,1
0,2
0,3
0,4
0,5
0,6
0,7
0,8
Clusters' description
Cluster 0 Cluster 1 Cluster 2
Estimation of the Features Influence on Cluster Partition
743

Future research will include adding variance to
the supplier features estimates. If a certain factor is
important for the enterprise, then it can be
distinguished from the rest.
REFERENCES
Aggarwal, C.C. 2003. Towards systematic design of
distance functions for data mining applications. In:
Proceeding of the 9th ACM SIGKDD International
Conference on Knowledge Discovery and Data Mining
pp. 9-18, New York, USA, August.
Aggarwal, C.C. Reddy, C.K. 2013. Data Clustering:
Algorithms and Applications. CRC Press.
Batra, A. 2011. Analysis and Approach: K-Means and K-
Medoids Data Mining Algorithms. In: ICACCT, 5th
IEEE International Conference on Advanced
Computing & Communication Technologies. ISBN 81-
87885-03-3 pp. 274-279.
D. H. Ballard, 1981. Generalizing the Hough transform to
detect arbitrary shapes. Pattern Recognition, 13:111–
122.
Dermoudy, J. Kang, Byeong-Ho. Bhattacharyya, D. Jeon,
Seung-Hwan. Farkhod, A.A. 2009. Process of
Extracting Uncover Patterns from Data: A Review.
International Journal of Database Theory and
Application, 2(2).
Duda, R.O. Hart, P.E. 1973. Pattern Classification and
Scene Analysis. Vol. 3, Wiley, NewYork, USA.
G. Stockmann, 1987. Object recognition and localization
via pose clustering. CVGIP, 40:361–387.
G. Stockmann, S. Kopstein, and S. Benett, 1982. Matching
images to models for registration and object detection
via clustering. IEEE Trans. Pattern Anal. Mach. Intell.,
4:229–241.
Galdi, P. Napolitano, F. Tagliafe, R. 2014. A comparison
between Affinity Propagation and assessment-based
methods in finding the best number of clusters. In:
Proceedings of CIBB.
Halkidi, Maria & Vazirgiannis, Michalis. (2001).
Clustering Validity Assessment: Finding the optimal
partitioning of a data set. Proceedings - IEEE
International Conference on Data Mining, ICDM. 187-
194. 10.1109/ICDM.2001.989517
J. Illingworth and J. Kittler, 1988. A survey of the Hough
transforms. CVGIP, 44:87–116.
Jain, A.K. Dubes, R.C. 1988. Algorithms for Clustering
Data. Prentice Hall, Upper Saddle River, NJ, USA.
Martin Ester, Hans-Peter Kriegel, Jorg Sander, Xiaowei
Xu, 1996. "A Density-Based Algorithm for
Discovering Clusters in Large Spatial Databases with
Noise", Proceedings of 2nd Int. Conf. On Knowledge
Discovery and Data Mining, Portland, OR, pp. 226-
231.
Michael J. A. Berry, Gordon Linoff, 1996 Data Mining
Techniques For marketing, Sales and Customer
Support. John Willey & Sons, Inc.
Microsoft Support, 2019. “The project triangle”. URL:
https://support.microsoft.com/en-us/office/the-project-
triangle-8c892e06-d761-4d40-8e1f-17b33fdcf810?ui=
en-us&rs=en-us&ad=us
Moiane, André & Machado, Álvaro. (2018). Evaluation of
the clustering performance of affinity propagation
algorithm considering the influence of preference
parameter and damping factor. Boletim de Ciências
Geodésicas. 24. 426-441. 10.1590/s1982-
21702018000400027
S. Moss, R. C. Wilson, and E. R. Hancock, 1999. A mixture
model for poses clustering. Patt. Recogn. Let.,
20:1093–1101.
Sudipto Guha, Rajeev Rastogi, Kyueseok Shim, 1998.
"CURE: An Efficient Clustering Algorithm for Large
Databases", Published in the Proceedings of the ACM
SIGMOD Conference.
Ulrich Hillenbrandm 2007. Consistent Parameter
Clustering: Definition and Analysis, Pattern
Recognition Letters 28, 1112–1122
Usama Fayyad, Ramasamy Uthurusamy. November 1996.
"Data Mining and Knowledge Discovery in Databases",
Communications of the ACM. Vol.39, No11.
Usama M. Fayyad, Gregory Piatesky-Shapiro, Padhraic
Smuth and Ramasamy Uthurusamy. 1996. “Advances
in Knowledge Discovery and Data Mining”, AAAI
Press.
Veit Schwämmle, Ole Nørregaard Jensen, 2010. A simple
and fast method to determine the parameters for fuzzy
c–means cluster analysis, Bioinformatics, Volume 26,
Issue 22, Pages 2841–2848, https://doi.org/10.1093/
bioinformatics/btq534
Zhang, K. Gu, X. 2014. An Affinity Propagation Clustering
Algorithm for Mixed Numeric and Categorical
Datasets. Mathematical Problems in Engineering, 2014,
pp. 1-8.
Noufa Alnajran, Keeley Crockett, David McLean, Annabel
Latham Cluster Analysis of Twitter Data: A Review of
Algorithms (DOI:10.5220/0006202802390249),
Conference: 9th International Conference on Agents
and Artificial Intelligence
R. Smíšek et al., "SVM based ECG classification using
rhythm and morphology features, cluster analysis and
multilevel noise estimation," 2017 Computing in
Cardiology (CinC), 2017, pp. 1-4, doi: 10.22489/
CinC.2017.172-200.
Yaakov HaCohen-Kerner, Yarden Tzach, Ori Asis Gender
Clustering of Blog Posts using Distinguishable Features
Published in KDIR 2016 Computer Science (DOI:
10.5220/0006077403840391).
ICINCO 2021 - 18th International Conference on Informatics in Control, Automation and Robotics
744
