
Accurate Measurement of the Energy Consumption of Security
Functions
Beno
ˆ
ıt Fournier
1 a
, Val
´
erie Viet Triem Tong
2 b
and Gilles Guette
1 c
1
University of Rennes 1, Rennes, France
2
CentraleSupelec, Cesson-S
´
evign
´
e, France
Keywords:
Energy Consumption, Security Function, Cryptography, Cybersecurity.
Abstract:
In recent years, the number of IoT devices has grown exponentially. These devices need to communicate with
each other or with the infrastructure and their communications need to be protected. To do this, devices im-
plement security protocols that ultimately rely on the execution of encryption, decryption and hash functions.
When these devices run on battery, more broadly, in an energy-saving approach, it is important to evaluate
the energy consumption associated with the implementation of these security measures. In the long run, we
believe that it will be necessary to choose a balance between the implementation of very strong security mea-
sures but very expensive in terms of energy consumption and other implementations, perhaps less safe but less
expensive. The first step in this direction is to know how to accurately measure the energy consumption of
existing and widely deployed security libraries. In this article, we describe a methodology and architecture to
evaluate the power consumption of any functions running on a Raspberry Pi. This article provides a bench-
mark of some of the cryptographic functions of OpenSSL, allowing developers to know what the cost of using
a particular function is, and also to compare the energy cost of security functions with similar functionality.
1 INTRODUCTION
Mobile phone, smart watch, smart sensors and other
connected objects have invaded our daily lives and
their impact on energy use should not be neglected.
These objects perform small calculations, but their
number is still growing. When these objects store
or manipulate sensitive data, they must be protected
by software security solutions that ultimately rely pri-
marily on the use of encryption, decryption and hash
functions. The implementation of these security solu-
tions therefore leads to a misjudged energy cost over-
load. Knowledge of the energy consumed by a com-
ponent is all the more critical as this component is an
embedded component with limited access to energy,
for example because it runs on batteries. It is essential
to be able to accurately measure the energy consumed
by the execution of a software function in order to
limit its execution to what is strictly necessary. This is
even more true for security functions, whose parame-
ters must be adapted to the security risks to which the
a
https://orcid.org/0000-0001-7118-3658
b
https://orcid.org/0000-0003-4838-2952
c
https://orcid.org/0000-0002-8051-0013
component may be exposed. Precise knowledge of
the energy consumed then makes it possible to choose
the security function that offers the best trade-off be-
tween security and performance.
In this context, we have focused on the precise
measurement of energy consumption made by a Rasp-
berry Pi during the execution of security functions.
We evaluate the impact of parameters such as the
key’s and file’s sizes. This way, we can compare dif-
ferent functions with similar security objectives. We
focus here on 4 hash functions (SHA1/2/3, MD5),
1 symmetric key crypto-system (AES) in two modes
(ecb, cbc) for encryption and decryption, 2 public-key
cryptosystems: RSA for key generation and deriva-
tion, encryption, decryption and Elliptical Curve
Cryptography for key generation and derivation, all
the implementations are provided by Openssl 1.1.1.
This article details 3 main contributions:
• A physical, non-invasive architecture, indepen-
dent of any hardware or software, to accurately
evaluate the energy consumption due to the exe-
cution of a single software function. (Section 3)
• Corrective procedures for several sources of mea-
surement disturbances. (Section 4)
Fournier, B., Tong, V. and Guette, G.
Accurate Measurement of the Energy Consumption of Security Functions.
DOI: 10.5220/0010544604870494
In Proceedings of the 18th International Conference on Security and Cryptography (SECRYPT 2021), pages 487-494
ISBN: 978-989-758-524-1
Copyright
c
2021 by SCITEPRESS – Science and Technology Publications, Lda. All rights reserved
487

• A complete measurement benchmark for the
Openssl library executed on an RPi. (Section 6)
All raw data, compiled results and curves acquired
during this study will be available on a public reposi-
tory at the publication of this article.
2 RELATED WORKS
The community has a strong interest in the develop-
ment of energy-efficient solutions: hardware architec-
ture, operating systems, or protocols. This interest is
not new, as early as the 1990s, researchers wanted to
evaluate the power cost of the software component of
a system.
In (Tiwari et al., 1995), Tiwari et al. proposes a
methodology for developing and validating a power
model at instruction level for measuring processors
activities. Their model takes into account the energy
cost of individual instruction and inter-instruction ef-
fects. To validate their estimation model, they con-
duct experiments with several programs. They also
discuss optimization at memory and software level.
In (Montenegro et al., 2017), Montenegro et al.
focussed their work on studying the energy consump-
tion of cryptographic primitives from the point of
view of the application developer and energy aware
software development (Green Computing (Li and
Zhou, 2011)). This works is about android devices
an studies three cryptographic providers for the Java
Cryptography Extension: BouncyCastle, SpongyCas-
tle and Institute for Applied Information Processing
and Communication. They study several primitives
from the three different providers and the most used
cryptographic algorithms for each primitive.
In (De Meulenaer et al., 2008), De Meulenaer et
al. evaluates the energy cost of cryptographic proto-
cols in sensor networks. They study the cost of two
key agreement protocols: Kerberos and the Elliptic
Curve Diffie-Hellman key exchange with authentica-
tion provided by the Elliptic Curve Digital Signature
Algorithm (ECDH-ECDSA). Their experiments were
conducted with ATmega 128K (MicaZ) and MSP430
(TelosB) micro-controllers. They measure communi-
cation and computation cost on both platforms. They
conclude that with their setup, Kerberos is less costly
from one order of magnitude than ECDH-ECDSA.
In (Jiang et al., 2013), Jiang et al. propose a study
based on measurement of several cryptographic prim-
itives with a real-time operating system slC/OSII on a
S3C2440 ARM processor platform. They also add to
their setup an external device to do the data acquisi-
tion (PXI 1024Q with NI6221 data acquisition card)
and data analysis (LabView). The measurements are
made on the cryptlib cryptography library (Gutmann,
2012). They conclude that the data size pushes sig-
nificant influences and that the actual relationship be-
tween energy consumption and execution time of a
cipher is proved to be near-linear. Contrary to our pro-
posal, their solution cannot be deployed on embedded
and moving devices.
In (El-Haii et al., 2018), El-Hajj et al provide mea-
surements of cryptographic function on Raspberry Pi.
Some results are provided in mA and some others in
Joule. No details are given concerning the experimen-
tal setup and how measurements are done.
In (Omrani et al., 2018), Omrani et al. concentrate
their efforts on the evaluation of lightweight cryptog-
raphy dedicated to IoT. They measure impact of dif-
ferent protocol in term of kB of RAM and ROM, and
clock cycles needed. Their experiment are made on
Raspberry Pi and Arduino.
3 PHYSICAL ARCHITECTURE
FOR ACCURATE
CONSUMPTION
MEASUREMENT
We focus here on the power consumption of a Rasp-
berry due to the execution of security functions. We
have chosen to study more specifically an RPi because
this platform is regularly used as an architecture sup-
port for connected objects. This section details the
physical architecture developed to obtain the results
detailed in the rest of the article. This architecture
can be extended to a more general framework and can
be used to measure the energy consumption of any
software execution.
We choose here to make all our measurements
outside the component so that our approach is in-
dependent of the device specifics. The architecture
is lightweight allowing measurements to be made in
different environments, possibly outside a fully con-
trolled environment.
Our architecture measures electrical power by
multiplying the value of the current (I) flowing
through the component by its voltage (V
cc
). The
voltage is directly measured with a voltage sensor.
The current is computed from the measured voltage
(V
shunt
) of a shunt resistor directly on the USB power
wire as detailed in Figure 1.
The current flow is thus computed using the
Ohm’s law I = V
shunt
/R. The value chosen for R
should be as low as possible to avoid a voltage drop
at the input of the component. The voltage drop must
nevertheless be measurable by our sensor. Here we
SECRYPT 2021 - 18th International Conference on Security and Cryptography
488

RPi
USB
VCC
USB
GND
0.02Ω
+5V
ADS
A1
ADS
A0
Figure 1: Electric scheme of USB power line, with 0.02Ω
shunt resistor and ADC measurement point.
choose the minimum value acceptable by our sensor
and we use a R = 0.02 Ω shunt resistor.
Finally, we get the power of the device P with :
P = V
cc
× I =
V
cc
·V
shunt
R
(1)
In our experiments, we use a Raspberry Pi 2 B
rev 1.1 with the BCM2836 chipset, 1G memory and
Raspbian 10.3. V
cc
and V
shunt
are acquired by an
analogical to digital converter (ADC). We use here
the ADS1115 with I2C bus and 16 bits resolution.
The ADC must be controlled with an external device
which can be either the monitored component itself or
an independent component. We use a 187.5µV resolu-
tion step for V
cc
and a 7.81125µV resolution step for
V
shunt
. Those voltage resolutions are given by ADC
datasheet (Texas-Instrument, 2018) according to 16-
bits resolution and range of measured values.
In the experiments, we have to observe computa-
tions with execution times ranging from 0.5 seconds
(computation of a hash of a 1kb file) to several sec-
onds (generation of a RSA key). To observe in details
the consumptions due to these executions, we need
to reach the finest possible temporal resolution (i.e.
the number of measurements per second). For our
experiments, we have an ADC with a default reso-
lution of 128 measurements per second. For this res-
olution value, according to ADC’s datasheet (Texas-
Instrument, 2018) the uncertainty of the measurement
is 187.5µV for V
cc
and 12.35µV for V
shunt
.Therefore
we try to get as close as possible to this temporal res-
olution, in order to operate the sensor at its optimum.
We study two main architectures:
Setup 1: One ADC and Auto-monitoring. V
cc
and
V
shunt
are acquired successively by a single analogical
to digital converter (ADC) auto-pilot by the raspberry
itself. The time sampling cannot reach the 128 mea-
surements per second resolution and is only equal to
8 measurements per second because of two main re-
strictions:
1. one single sensor used to acquire 2 values ( V
cc
and V
shunt
)
2. The RPi cannot handle as many as 8 inputs per
second as it is not a real time device. The pro-
cess that receives the information sent by the sen-
sor can be pre-empted by other processes. In this
case, the measurement is lost as the sensor does
not store the value.
To overcome these drawbacks, we have designed
a second setup. Nevertheless setup 1 is still useful in
case of measurement on system in real condition (fly-
ing UAV), because of this small package. Moreover
in real situation, as several behaviour will happened,
such temporal precision become useless.
Setup 2: Two ADC and a Second RPi. In our sec-
ond setup, depicted in Figure 2 we use one ADC per
monitored value: one dedicated to V
cc
and a second
for V
shunt
. We also use another raspberry to pilot the
two ADCs. Only one RPi is enough to handle the
ADCs, as the measuring process is their only activ-
ities. We succeed to reach a time sampling of 128
measurements per second with this second setup.
RPi
USB
VCC
USB
GND
0.02Ω
+5V
ADS2
A1
ADS1
A3
ADS2
A0
ADS1
A1
Figure 2: Setup 2, with measurement points for 2 ADC.
In this article we prioritize the accuracy of the re-
sults and we will therefore use setup 2. In other cases
studies, the setup 1 remains interesting to monitor the
consumption of an object in motion or to limit the
overall consumption, price, weight, architecture foot-
print.
We have checked, with independent measure-
ments
1
that the auto-monitoring with the RPi it-
self does not introduce significant power consump-
tion variation. Indeed, we evaluate the overhead at
0.005 W, far less that the magnitude of consumption
detailed in the remainder of our experiments.
4 DATA ACQUISITION AND
ELIMINATION OF
EXPERIMENTAL NOISE
The purpose of our study is to measure as precisely as
possible the power consumption due to the execution
of a software security basic block on a generic object
(a Raspberry Pi) using commonly used security tools.
Each security basic block is composed of a shell com-
mand to a typical security library. As an example,
1
DSOS404A Oscilloscope, 10bit precision, 4GHz tem-
poral resolution
Accurate Measurement of the Energy Consumption of Security Functions
489

openssl enc -aes-192-ecb -salt -in file
-out file.enc -k g2QQSsA5QylsMRJ1
is the command requesting the symmetric encryp-
tion of a file file into a file.enc file using
the key g2QQSsA5QylsMRJ1 with the standard im-
plementation of AES in Openssl 1.1.1 (OpenSSL-
Management-Committee, 2020). Section 5 gives
more details on how we dealt with the parameters of
this type of command in order to evaluate their impact
on power consumption.
4.1 Data Acquisition
We execute the different commands on a Raspberry Pi
whose power consumption is monitored by the archi-
tecture detailed in the previous section. The monitor-
ing produces a trace similar to those presented on Fig-
ure 3. More precisely, this figure shows the traces due
to 5 successive calls of openssl aes192ecb encryption
on a 600kbytes file.
Figure 3: Typical trace for 5 successive executions.
The power is determined as explained in Formula1
(section 3) with the measurement of tension and cur-
rent. On this Figure, the red line highlights the base-
line, i.e. the power consumption of the device when
it is in idle mode, this will be the reference line
for measuring power overhead of activity. Figure 3
depicts 5 peaks corresponding of 5 successive calls
of the same encryption command, executed with the
same parameters and source file. Finally, an elemen-
tary measurement here refers to the measurement of
the energy consumed during Raspberry Pi activities
due to the execution of a single command call. Five
elementary measurements is highlighted on Figure 3
by the green area: the area between the baseline in red
and the peak. The power values displayed on the fol-
lowing sections is the result of the integration of the
power value over time, during one peak. Those values
are afterward aggregated. The baseline and peak be-
ginning are automatically determined by a post pro-
cess python code, using underlying statistics library.
The length of the peak is manually set, depending on
behavior it may vary or it may be difficult to automat-
ically detect it. All those automatic value attributions
are reviewed manually on a small control data sample
to ensure validity of the post processing.
4.2 Experimental Noise Reduction
Accurate estimation of current consumption due to
the execution of a single software function requires
extremely fine-grained measurements and these mea-
surements are subject to both large variations and
coarse approximations. We have reviewed our exper-
imental findings with considerable attention, and here
are the lessons to be learned from them.
Diversification of Observations. The diversifica-
tion of observations makes it possible to limit both
the impact of the external environment, the device in-
stability and the OS activities. Indeed, the measure-
ment of current consumption of a mainstream device
is sensitive to the external environment such as the
the external temperature, the temperature of the de-
vice. In addition, the voltage stability and connection
problems can badly impact the quality of the observed
results. These observations may also vary because of
the OS activities: the operating system runs continu-
ously for managing memory, concurrent processes ex-
ecution and file system accesses. The impact of load-
ing files in memory is limited here by relying on stor-
ing all useful files in the virtual memory of the RPi all
read/write operations are done in memory. Moreover,
the elementary measurement have to be repeated and
diversified to reduce the impact of a biased measure-
ment as much as possible.
In the following, the energy consumption due to
one single command (same command, same parame-
ters) is thus computed from the mean of 500 elemen-
tary measurements corresponding to the execution of
1 command ×5 runs by different processes (for limit-
ing the OS impact) ×50 repetitions on a device (for
limiting the external environment impact) ×2 devices
(for limiting the device stability impact). These 500
elementary measurements form a single experiment.
In the following, an experiment will be visualized by
a histogram representing the distribution of the ob-
served results.
Reduction of Coarse Approximation Due to the
Measurement Techniques. The control architec-
ture used to indicate to the RPi its tasks is likely to in-
duce important consumption biases. When the RPi is
SECRYPT 2021 - 18th International Conference on Security and Cryptography
490
(a) ssh execution
(b) offline execution
Figure 4: SHA1 on 100kB file.
remotely controlled by a master server, the connection
(ssh, telnet for instance) between them induces an
important consumption bias. Indeed, the communica-
tion protocol used induces the execution of a protocol
stack, which may cost more than the function under
consideration. It is therefore necessary to script all
the needed command on the RPi itself before the ex-
periment and to store the consumption logs on the RPi
to avoid this over-approximation. In this way, all the
data is processed offline which does not induce any
consumption bias. Figure 4 show an example of the
execution of SHA1 on a 100kB file either ordered by
a remote server with ssh connection or ordered using
offline (scripted) commands.
Reduction of Variability Due to the Physical
Equipment The physical material on which the ex-
periments are performed can impact the energy con-
sumption and its measurement. This is particularly
the case for the quality and the power supply of the
RPi. A poor quality power supply will not pro-
vide a stable voltage, which can lead to significant
power variations. There is no perfect solution to this
problem apart from ensuring the best possible qual-
ity of the material. Since unexpected events can al-
ways occur, the results produced must be monitored
to quickly eliminate outliers.
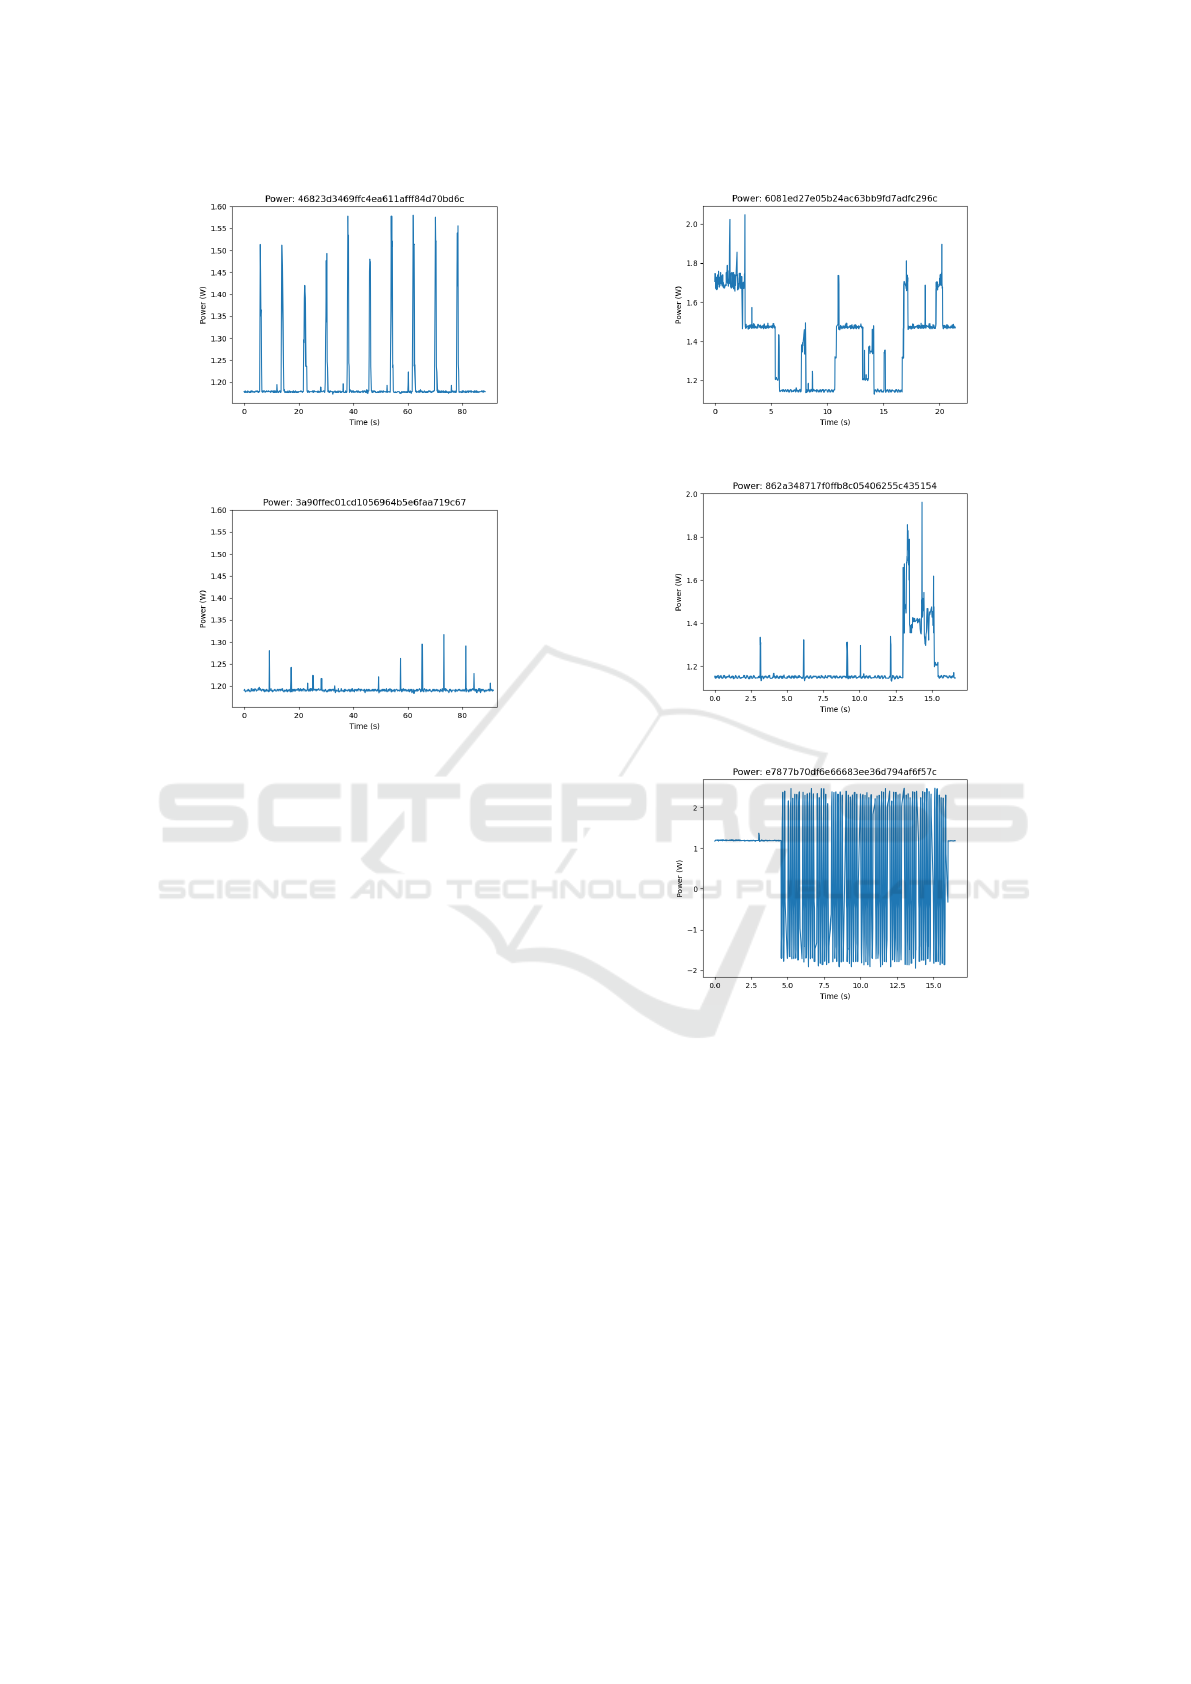
(a) Supply voltage jump
(b) Bursting over-consumption
(c) Bad probe connection
Figure 5: Examples of outlier traces.
Figure 5 gives three examples of outliers probably
due to supply voltage jump (Figure 5a), abnormal ex-
ecution, malfunction in the connections (Figure 5b),
or bad probe connection (Figure 5c). In this study, the
outliers are manually identified and are not taken into
account.
5 ENERGY COST OF THE AES
CRYPTOSYSTEM
We dissect now the energy consumption profile re-
lated to the use of the AES cryptosystem (encryption
and decryption). AES has several encryption mode
and in this article we studied the electronic codebook
Accurate Measurement of the Energy Consumption of Security Functions
491
(a) AES 192 ecb, encryption on 50kB file
(b) AES 192 ecb, encryption on 150kB file
Figure 6: AES 192 ecb encryption energy consumption.
(ECB) mode and the cipher block chaining (CBC)
mode. In the ECB mode, the message is divided
into blocks, and each block is encrypted separately,
whereas in the CBC mode, each block of plaintext is
XORed with the previous ciphertext block before be-
ing encrypted. For each of these two modes, we stud-
ied the impact on energy consumption of the key’s
size (128, 192 and 256 bits) and the size of the file to
be encrypted (from 10kB to 100kB).
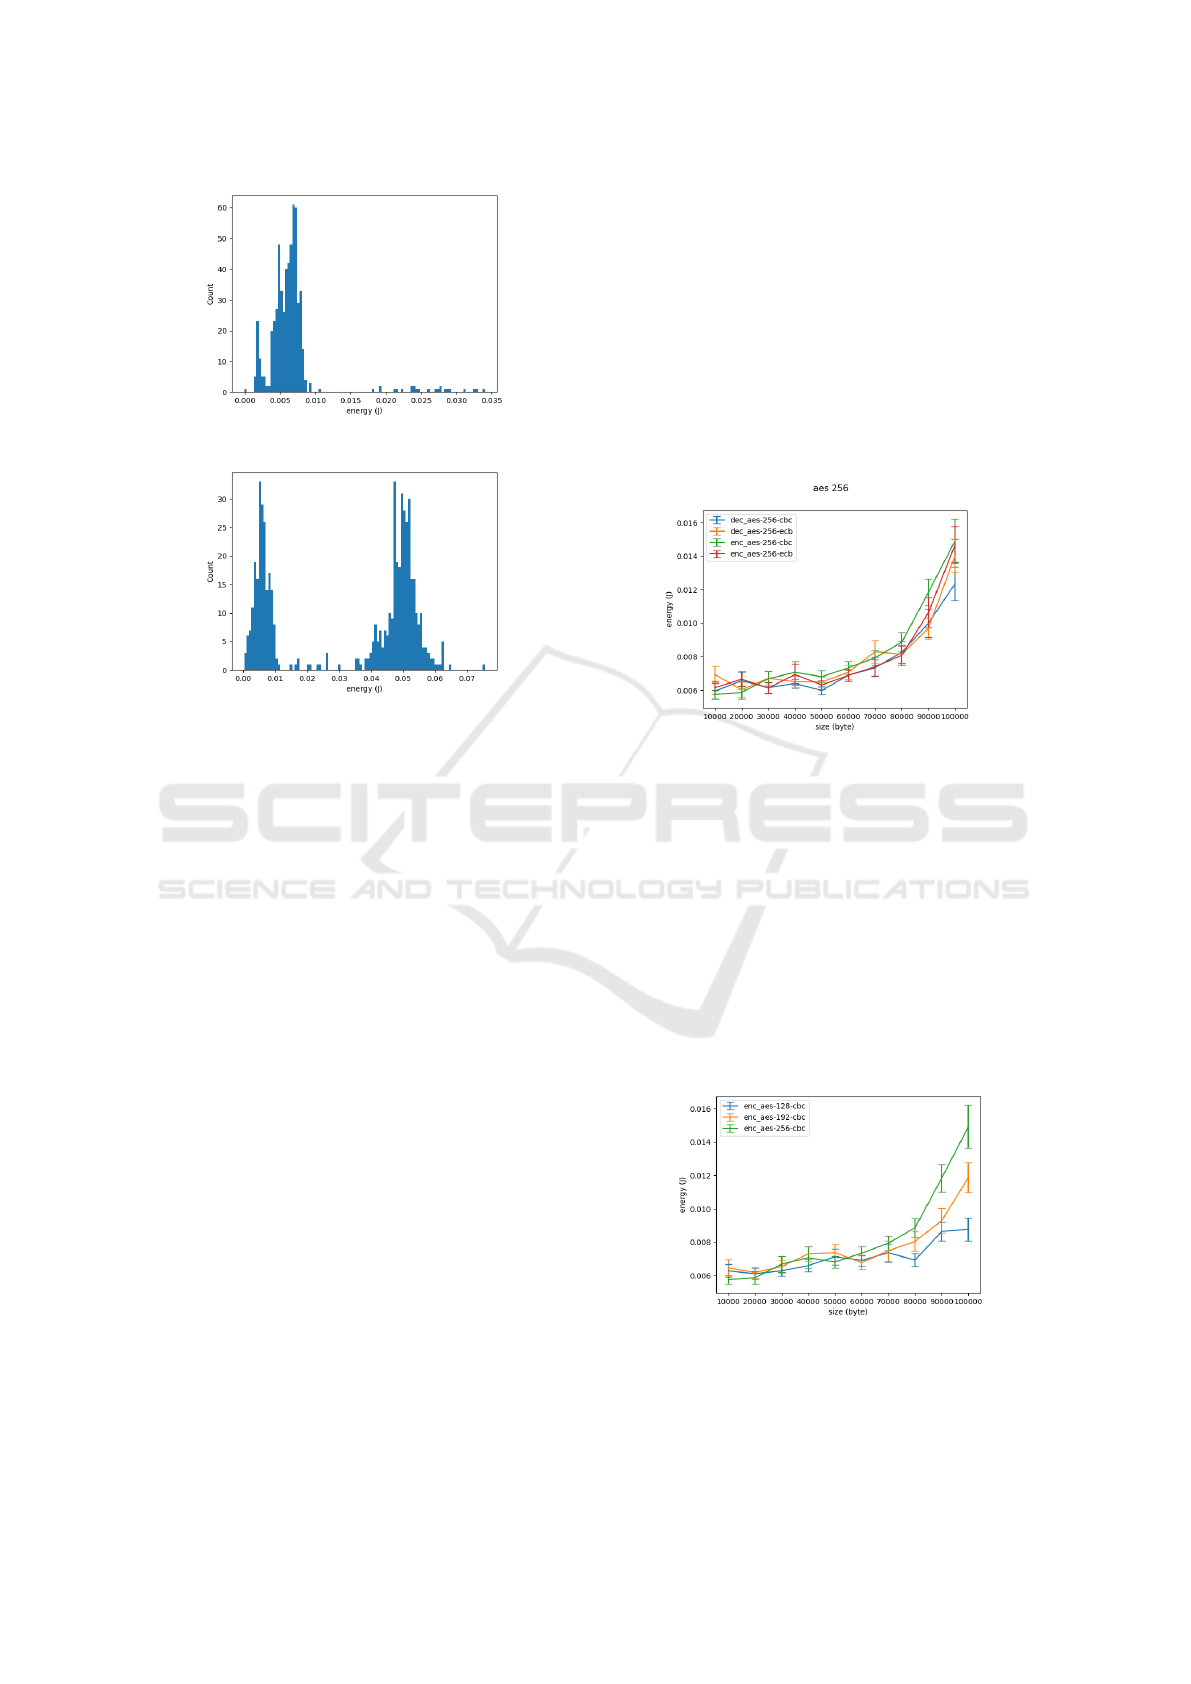
Figure 6 shows the distribution in number of ob-
servations during two experiments of the energy con-
sumption related to the execution of AES (AES en-
cryption with a same key length and two different file
size values). In the experiments conducted during our
study (22 functions), the distribution forms the same
curve behavior which is a single gaussian distribution.
This means that each elementary measurement has
approximately the same energy consumption behav-
ior. However, AES seems to have two different be-
haviors. First, from a file of 50kB or less and for any
key size, the distribution forms a single gaussian dis-
tribution as represented on Figure 6a. On the contrary,
as the file size increases, the distribution forms a two-
component Gaussian mixture. This means that for the
same operation, we have observed 2 distinct types of
energy consumption behaviors. These two behaviors
were observed in an equally distributed manner. Fig-
ure 6b is the distribution observed for the experiment
on an encryption of a 150kB file, it forms a gaussian
mixture with two components. We could not attribute
this anomaly clearly. We can only state that this is not
due to read/write management by the OS because all
operations are done in RAM.
Comparison of Different Operations and Modes.
Figure 7 presents four series of experiments on AES
256: the operation of encryption and decryption in the
two operating modes ECB and CBC. In each series,
we vary the size of the input file 10kB by 10kB starting
from 10kB to 100kB. Each experiment is represented
by its average value and its uncertainty.
Figure 7: AES 256: Encryption / Decryption in CBC and
ECB mode.
Figure 7 reveals several points. First of all that the
different types of operation (encryption and decryp-
tion) in the two operating modes have the same behav-
ior in terms of energy consumption. In the following,
we can therefore represent AES by one or the other of
these modes or operations. Next, we observe that the
energy consumption is constant between 6 and 7mJ
for file sizes ranging from 10k B to 60k B, after this
file size, the curves follow an exponential curve. Fi-
nally, it can be observed that while during these series
of experiments the file size was multiplied by 10, the
consumption was only multiplied by 2.
Figure 8: Encryption with AES CBC: 3 different key sizes.
Impact of the Key Size. Figure 8 shows 3 series of
experiments to evaluate the impact of the size of the
encryption/decryption key. AES is represented here
SECRYPT 2021 - 18th International Conference on Security and Cryptography
492

Table 1: AES.
ALGO OPERATION 10kB file 100kB file 150kB file 250kB file 500kB file 1MB file
key size 128 192 256 128 192 256 128 192 256 128 192 256 128 192 256 128 192 256
AES - ECB
enc
6.33 6.96 6.15 9.22 9.68 14.69 27.40 33.02 36.29 38.89 37.96 40.66 44.99 46.46 48.83 48.56 48.95 48.76
± 8% ±9% ±6% ±8% ±7% ±7% ±6% ±5% ±4% ±4% ±4% ±4% ±3% ±3% ±2% ±1% ±2% ±2%
dec
6.52 5.80 6.94 8.33 9.24 14.05 26.35 32.02 36.06 38.83 39.26 39.83 46.32 47.33 47.93 49.40 49.48 47.81
±9% ±5% ±7% ±7% ±7% ±7% ±6% ±6% ±5% ±4% ±4% ±4% ±3% ±3% ±2% ±2% ±3% ±1%
AES - CBC
enc
6.28 6.47 5.75 8.77 11.88 14.92 27.34 34.82 36.46 38.66 40.24 39.72 45.11 46.94 49.16 48.03 48.63 47.28
±6% ±6% ±4% ±8% ±8% ±9% ±7% ±5% ±5% ±4% ±4% ±4% ±3% ±3% ±2% ±2% ±2% ±2%
dec
6.24 6.55 5.95 8.21 8.84 12.36 24.77 31.83 35.92 38.02 39.26 40.49 44.10 46.65 48.20 47.98 47.65 46.63
±7% ±7% ±8% ±10% ±8% ±8% ±7% ±5% ±5% ±4% ±4% ±4% ±3% ±2% ±2% ±1% ±2% ±2%
Table 2: Hash functions.
ALGO Op 10kB file 100kB file 150kB file 250kB file 500kB file 1MB file
MD4 hash 4.95±8% 5.76±11% 5.36±6% 5.97±17% 6.19±11% 28.46±6%
MD5 hash 5.27±7% 5.14±6% 5.35±11% 5.85±9% 10.07±11% 34.18±5%
SHA1 hash 4.88±6% 5.60±8% 5.71±9% 8.01±11% 30.73±6% 37.84±4%
SHA224 hash 5.18±6% 5.71±9% 8.43±15% 23.31±8% 36.16±5% 41.08±3%
SHA256 hash 5.05±7% 5.86±10% 7.48±10% 24.78±8% 36.23±4% 42.23±3%
SHA384 hash 5.08±6% 5.88±9% 9.38±11% 29.48±6% 35.97±5% 40.92±2%
SHA512 hash 4.98±6% 6.33±11% 9.88±11% 28.67±6% 35.78±5% 41.44±2%
SHA3-224 hash 5.30±6% 26.02±7% 33.32±5% 38.69±4% 42.24±1% 39.60±1%
SHA3-256 hash 5.41±5% 27.29±7% 33.48±5% 38.62±4% 42.34±1% 39.34±1%
SHA3-384 hash 5.37±6% 34.46±5% 35.40±5% 40.10±3% 41.79±1% 39.23±2%
SHA3-512 hash 5.90±9% 35.79±4% 38.88±4% 42.42±2% 40.39±1% 38.12±2%
in a single operating mode (CBC) and a single oper-
ation (encryption). There is an experiment for each
key size of 128, 192 and 256 bits. The observations
are similar to the previous ones: we observe a stable
consumption at around 6 and 7mJ and then a growing
consumption starting at a file size of 60kB. The size of
the key has an impact only beyond this file size. Once
the file reaches a size of 60k B, the evolution of con-
sumption seems to be linearly correlated to the size
of the key: AES consumes about twice more with a
128b key than with a 256b key.
Finally, all the results obtained for AES are com-
piled in Table 1. This table presents the average con-
sumption observed (in mJ) according to key and file
sizes. The file size thresholds were set from our study.
6 COMPARATIVE SYNTHESIS
We conducted an evaluation campaign similar to the
one described for AES for 11 hash functions, for the
functions required to use RSA and for the functions
required to use ECC. As mentioned at the beginning
of this article, all the numerical values will be publicly
available and we detail here the results obtained.
Concerning the hash functions, we measured the
consumption of MD4, MD5, SHA1, the SHA2 family:
SHA224, SHA256, SHA384, SHA512 and the SHA3
family: SHA3-224, SHA3-256, SHA3-384, SHA3-
512. Among all the functions we have studied, the
hash functions are the least energy consuming: the
consumption for all these functions is about 5 mJ
for 10kb file size. This consumption remains stable
for several functions (MD4, MD5, SHA1, SHA224,
SHA256, SHA384 AND SHA512) up to 250kB file
size, and even up to 500kB for MD5 which is the least
power-consuming implementation. This consumption
increases with the size of the files to reach a consump-
tion of about 40mJ. All the results related to the hash
functions are described in the Table 2.
To conclude, we investigated the energy cost of
two asymmetric cryptosystems Elliptical curve cryp-
tography on the SECPR curve and RSA (Table 3). For
ECC, we focused on the setting up of all the crypto-
graphic material: generation of a private key, deriva-
tion of a public key and computation of a shared se-
cret. For RSA, we measured the private key gener-
ation, the public key derivation, the encryption and
decryption for the maximal value relative to a given
key length. The consumption observed for the ECC
scheme is low for almost all the measurements, it is
very slightly higher than the observations made on the
hash functions for small files which are therefore the
smallest values we observed. This consumption in-
creases to reach values comparable to those observed
for encryption or decryption with AES. Surprisingly,
the consumption decreases when the key reaches a
size of 512. We suspect a large code optimization for
large key sizes but without being able to verify it.
The RSA encryption and decryption operations
give measurements comparable to all the observations
made in this study: encryption is the least expen-
sive operation and even for large key sizes, the mea-
surements observed remain globally comparable to
Accurate Measurement of the Energy Consumption of Security Functions
493

Table 3: Elliptic Curve vs RSA.
key size 1024 2048 4096
RSA
enc 7.32 ±8% 7.00 ±8% 7.31 ±9%
dec 27.23 ±8% 46.62 ±3% 48.19 ±3%
gen 231.11 ±4% 935.05 ±6% 6509.54 ±6%
deriv 6.77 ±17% 6.40 ±7% 6.32 ±10%
key size 112 128 160 224 384 512
ECC-secpr1
gen 7.15 ±9% 8.27 ±11% 8.90 ±10% 32.55 ±6% 46.45 ±3% 6.28 ±7%
deriv 6.04 ±8% 7.02 ±11% 6.11 ±9% 6.40 ±8% 5.83 ±8% 6.71 ±9%
mix 7.90 ±13% 8.20 ±9% 9.91 ±11% 33.89 ±6% 44.52 ±3% 6.43 ±6%
those obtained for the hashing of small files (<8mJ).
The decryption operation is 4 to 7 times more ex-
pensive (≈ 50 mJ) which is comparable to the val-
ues observed for AES encryption/decryption for 1MB
files.The public key derivation is the least expensive
operation (around 6mJ). By contrast, for RSA, pri-
vate key generation operations are extremely expen-
sive to reach values ranging from 230mJ to 6500mJ,
i.e. 1000 times more than an encryption operation. In
a power optimization strategy, private key generation
should therefore be done outside the device.
7 CONCLUSION
In this study we proposed a framework to evaluate
the power consumption related to the consumption of
a single software function. We used this framework
to evaluate and compare the power consumption of
standard functions of the OpenSSL 1.1.1 library on a
Raspberry Pi. This article then details the power con-
sumption according to the different input parameters
of these functions (key size, file size).
The following are the general conclusions we
were able to draw at the end of the study:
• The minimum consumptions remain lower than
10mJ per execution.
• The maximum consumptions observed (except for
the generation of private key for RSA) are 4 to 5
times higher and of the order of 50mJ.
• The least power-consuming functions that we
studied are MD4 and MD5.
• The hash computation can have a consumption
multiplied by 7 according to the algorithm used.
• On the contrary, the different mode and operation
for AES are similar in terms of consumption.
• The cost of RSA encryption is curiously inexpen-
sive: it is less than an AES encryption and is of the
order of a hash computation. The decryption is
more expensive but remains similar to the values
observed for an AES encryption or decryption.
In the longer term, this study open two distinct
lines of research: it allows to evaluate the energy
extra-cost of implementing a secure solution versus
an insecure or less secure solution and it makes it pos-
sible to highlight the normal behavior (in term of en-
ergy consumption) of an isolated security function.
REFERENCES
De Meulenaer, G., Gosset, F., Standaert, F.-X., and Pereira,
O. (2008). On the energy cost of communication
and cryptography in wireless sensor networks. In
2008 IEEE International Conference on Wireless and
Mobile Computing, Networking and Communications,
pages 580–585. IEEE.
El-Haii, M., Chamoun, M., Fadlallah, A., and Serhrouchni,
A. (2018). Analysis of cryptographic algorithms on
iot hardware platforms. In 2018 2nd Cyber Security
in Networking Conference (CSNet), pages 1–5. IEEE.
Gutmann, P. (2012). Cryptlib security toolkit, version 3.4.
http://www.cryptlib.com.
Jiang, W., Guo, Z., Ma, Y., and Sang, N. (2013).
Measurement-based research on cryptographic algo-
rithms for embedded real-time systems. Journal of
Systems Architecture, 59(10, Part D):1394 – 1404.
Li, Q. and Zhou, M. (2011). The survey and future evolution
of green computing. In IEEE/ACM International Con-
ference on Green Computing Communications, pages
230–233.
Montenegro, J. A., Pinto, M., and Fuentes, L. (2017). What
do software developers need to know to build secure
energy-efficient android applications? IEEE Access,
6:1428–1450.
Omrani, T., Rhouma, R., and Sliman, L. (2018).
Lightweight cryptography for resource-constrained
devices: a comparative study and rectangle cryptanal-
ysis. In International Conference on Digital Economy,
pages 107–118. Springer.
OpenSSL-Management-Committee (2020). Openssl.
https://www.openssl.org/.
Texas-Instrument (2018). Ads111xultra-small, low-power,
i2c-compatible, 860-sps, 16-bitadcs with internal
reference, oscillator and programmable comparator.
https://www.ti.com/product/ADS1115.
Tiwari, V., Malik, S., and Wolfe, A. (1995). Power anal-
ysis of embedded software: First step towards soft-
ware power minimization. Very Large Scale Integra-
tion Systems, IEEE Transactions on, 2:437 – 445.
SECRYPT 2021 - 18th International Conference on Security and Cryptography
494
