
Discrimination between Social Groups: The Influence of
Inclusiveness-Enhancing Mechanisms on Trade
Stefano Bennati
1,2 a
, Catholijn M. Jonker
2 b
, Pradeep K. Murukannaiah
2 c
,
Rhythima Shinde
2,3 d
and Tim Verwaart
2
1
Computational Social Science, ETH Zurich, Clausiusstrasse 50, 8092 Zürich, Switzerland
2
Intelligent Systems, EEMCS, TU Delft, Van Mourik Broekmanweg 6, 2628 XE, Delft, The Netherlands
3
Ecological Systems Design, ETH Zurich, John-von-Neumann-Weg 9, 8093 Zürich, Switzerland
Keywords:
Discrimination, Agent-based Simulation, Values, Inclusion.
Abstract:
The bargaining power of prosumers in a market can vary significantly. Participants can range from industrial
participants to powerful and less powerful citizens. Existing trade mechanisms in such markets, e.g., in rural
India’s energy trade market, show occurrences of discrimination, exclusion, and unfairness. We study how dis-
crimination affects market access, efficiency, and demand satisfaction for the discriminating and discriminated
groups via an agent-based simulation, incorporating the available real data. We introduce a mechanism for
such markets that is designed for the values of inclusion and equal opportunities. The crux of our mechanism
is that goods are divided into smaller units, as determined by the market participants’ surplus and demands,
and traded anonymously via agents representing the prosumers. We evaluate six hypotheses in a case study
about energy trade in rural India, where members of a caste known as Dalits are discriminated by Others.
We show that anonymization contributes to the value of inclusion, and the combination of anonymization and
inclusion contributes to equal opportunities with respect to market access for both Dalits and Others.
1 INTRODUCTION
The possibility of tracing goods to their production
and delivery is important for accountability. How-
ever, knowing the origin of goods or of payments can
enable social discrimination based on, e.g., ethnicity,
gender, or caste. The shorter the link between buyers
and sellers, the more poignant the opportunity for dis-
crimination. In physical markets, the link is direct as
personal contact is required for transactions.
Energy trading in rural India is a clear setting to
study discrimination in a physical market. Large parts
of rural India lack an infrastructure for automated en-
ergy distribution. Solar panels can be a solution for
generating energy locally but require a local market
for distributing surplus energy. The local market is
currently realized by trading batteries. This exchange
requires personal contact, implying that the origin of
energy can be established. Therefore, this trade cre-
a
https://orcid.org/0000-0001-7603-8564
b
https://orcid.org/0000-0003-4780-7461
c
https://orcid.org/0000-0002-1261-6908
d
https://orcid.org/0000-0003-3435-3202
ates an opportunity for social discrimination.
A specific type of discrimination present in the
Indian markets is the discrimination between mem-
bers of higher castes and Dalits (historically, the low-
est caste in India). Specifically, individuals of a high
caste may not buy energy produced by Dalits since
the former may consider the energy produced by Dal-
its as “impure.” The high caste individuals may not
discriminate when selling the energy to the Dalits.
Ideally, increasing personal distance by mediation
should reduce the opportunity (not the cause) for dis-
crimination. However, if the mediator is a Dalit, the
market is prone to the same discrimination as when
the producer is a Dalit. In contrast, if the mediator is
of a high caste, discrimination can still happen. The
mediator, to maintain reputation or to simply follow
the social rules, may block trade across caste lines,
practically creating two separate markets.
Considering the factors above, we propose medi-
ation through a local grid as a technological alterna-
tive. We compare different market mechanisms with
respect to their discriminatory potential and study
the effect of these mechanisms on the market per-
Bennati, S., Jonker, C., Murukannaiah, P., Shinde, R. and Verwaart, T.
Discrimination between Social Groups: The Influence of Inclusiveness-Enhancing Mechanisms on Trade.
DOI: 10.5220/0010544100710082
In Proceedings of the 11th International Conference on Simulation and Modeling Methodologies, Technologies and Applications (SIMULTECH 2021), pages 71-82
ISBN: 978-989-758-528-9
Copyright
c
2021 by SCITEPRESS – Science and Technology Publications, Lda. All rights reserved
71

formance. In particular, we study the effect of dis-
crimination on the volumes of trade between people
from different caste groups and market efficiency in
order to answer the following research question: Can
we reduce the effect of discrimination on market effi-
ciency and trade volumes between (caste) groups by
anonymizing trade via agent-based mediation?
Answering this question is nontrivial. First, a vari-
ety of factors, including the distribution of individuals
across social groups in a population, their production
and consumption characteristics, the market type, and
the trade mechanisms supported by it, influence the
market outcome. Thus, the influence of discrimina-
tion and the mechanisms to reduce the influence must
be studied in complex setting, including the additional
factors that influence outcomes. Second, introducing
and studying such mechanisms in the wild, in a real
energy market, is not feasible.
We seek to answer the research question above via
a rigorous agent-based market simulation. We com-
pare market access of the different groups, trade vol-
umes between groups, and overall market efficiency
in mediated and non-mediated markets. To gain fur-
ther insights on the effects of discrimination, we sim-
ulate different trading protocols considering transac-
tion size and trading rounds. Our simulations are
based on the available data about the size and income
of different social groups in rural India, and on their
energy production and consumption characteristics.
Our contribution in this paper is three fold.
1. We describe a formal model to capture the influ-
ence of discrimination on market measures.
2. We develop the first agent-based model (to the
best of our knowledge), simulating caste-based
discrimination in an energy market.
3. We propose and evaluate two simple yet effective
mechanisms (bid splitting and multibidding) to re-
duce the influence of discrimination.
The rest of the paper is organized as follows. Sec-
tion 2 describes related works. Section 3 describes
the formal model we develop to study discrimination
in a market. Section 4 describes the mechanisms we
introduce to reduce discrimination, and the the simu-
lation model we develop to study the influence of the
proposed mechanisms. Section 5 describes our hy-
potheses and the experiments we conduct. Section 6
discusses the results of our experiments. Section 7
concludes the paper, highlighting key findings.
2 RELATED WORK
We provide a background decentralized electrifica-
tion in India, and review works on agent-based energy
trade and caste-based discrimination in India.
2.1 Decentralized Electrification
In a country like India, connecting everyone to a cen-
tralized power grid is problematic due to rough ter-
rains and patchy rural settlements (Census of India,
2011), and high costs for distribution companies. As
of August 2019, 25 million Indian households still do
not have electricity (REC Limited, 2019).
Decentralized solutions such as solar home sys-
tems (SHS)—rooftops with integrated solar Photo-
Voltaic (PV) panels—and PV microgrids (capable of
supplying electricity to a village for domestic use) are
preferable (Bhattacharyya, 2006; Chaurey and Kand-
pal, 2010; Cust et al., 2007). However, long-term
electrification projects are susceptible to many socio-
cultural, economic, and technical factors (Urmee and
Md, 2016; Singh et al., 2017; Trotter, 2016). For ex-
ample, the choice of target users, and the identifica-
tion, appointment of a trusted local leader, and com-
munity participation is important.
2.2 Agent-based Electricity Trade
As Kirman (1989) argued in his seminal paper, one
should study not only market equilibria, but also con-
sider the individual behavior of the traders. For this
purpose, a whole research line in agent-based eco-
nomics has been developed. Our work can be re-
lated to the work about choice functions (Nadal et al.,
1998), specifically, what is the influence of an agent’s
knowledge about the caste system and the status of its
trade partners on the agent’s choice function?
The literature on agent-based electricity trade dis-
cusses agents that optimize their own utility, e.g.,
maximizing profits, or maximize utility of the market
consumers needs (Bower and Bunn, 1999; Ilic et al.,
2012; Sha and Catalão, 2015; Tushar et al., 2014). Li
et al. (2011) and Weidlich and Veit (2008) discuss bid-
ding strategy models, indicating that new optimiza-
tion functions should be developed to take into ac-
count the increased uncertainty of energy generation
and demands of the renewable energy markets.
Concepts used in bidding and acceptance strate-
gies include memory and trust (i.e., number of times
the buyer and seller meet in the market). In this pro-
cess of exchange, agents also learn about the other
agents and change their behavior via different meth-
ods, e.g., comparing their own profits with others
(Chen, 2012; Winker and Gilli, 2001). Most of the
price matching is done via a passive role of buyer in
the market where seller decides a price (Lee et al.,
2015). Other methods discussed to deal with uncer-
SIMULTECH 2021 - 11th International Conference on Simulation and Modeling Methodologies, Technologies and Applications
72

tainty in the market and bidding strategies, are e.g.,
(Bower and Bunn, 1999; Sha and Catalão, 2015). Fi-
nally, simulation settings for experimental research
are discussed in (Ilic et al., 2012; Saad et al., 2011),
where different evaluation measures, e.g., social wel-
fare and efficiency of the energy exchange are studied.
The works above cover different aspects of agent-
based modeling in energy trade. However, none of
those are used to study the effects of discrimination,
as we do, in the context of peer-to-peer energy trade.
2.3 Caste-based Discrimination
There is ample evidence for caste-based discrimina-
tion in India in almost all sectors (Thorat and Neu-
man, 2012). Betancourt and Gleason (2000) find
that a higher proportion of individuals of Scheduled
Castes (and Muslims) in the rural areas of a district
leads to a lowering of the provision of medical and
educational services to that district, and observe this
across all states, providing a direct evidence for dis-
crimination. Borooah et al. (2014) observe that a
household’s position in the distributional ladder and
its chances of being poor are largely dependent on its
caste. They find that, even when two households have
comparable assets, the household of lower caste gets
rewarded lower than the higher caste household. For
example, buffaloes in a Scheduled Caste household
did not earn (via sale of milk) as much as they did in a
higher caste household for “untouchability” reasons.
The role of caste in energy exchange is largely un-
explored. Singh et al. (2017) show that castes and
sections of the community which did not trust each
other for historical reasons were not ready to share
energy with each other. In an empirical field study
by Shinde (2017), experts from nine different India-
based projects confirm the existence of caste-based
discrimination in energy sharing. In particular, even
though caste-based discrimination is illegal, people
belonging to higher castes still discriminate Dalits and
refuse to buy from Dalits, affecting the trade volume
of batteries between Dalits and Others.
To the best of our knowledge, neither caste-based
discrimination nor the influence of discrimination on
trade in a market have been studied via simulation
models in the current literature. However, other forms
of discrimination have been studied. For instance,
Bullinaria (2018) studies gender-based discrimination
in the setting of career progressions. Takács and
Squazzoni (2015) study how inequality can emerge in
an idealized labor market (without a history of dis-
crimination) due to information asymmetry. Plous
(2003) explains that the stereotypes about low-status
groups, e.g., labelling them as ’lazy’, lead to their dis-
criminatory treatment in a social context.
3 FORMAL MODEL
A population of prosumers is trading energy at a mar-
ket. We define G as the set of all groups. The popu-
lation is divided into two subgroups: D ∈ G are the
discriminated group and O ∈ G are the others.
At each time step, each agent j in the popula-
tion obtains a production value p
j
and a consumption
value c
j
(the energy needs). At first, an agent uses its
production to satisfy its needs and then turns to the
market to deal with the surplus. We define the surplus
s
j
= p
j
− c
j
. A positive surplus means that the agent
has extra production to sell; a negative surplus means
that the agent has unmet consumption to satisfy. We
subdivide the groups depending on the surplus as fol-
lows. For any group g ∈ G: g
+
= {i ∈ g : s
i
> 0},
g
−
= {i ∈ g : s
i
< 0}. We then define the total surplus
S
g
and the total demand C
g
of a group g as:
S
g
=
∑
i∈g
+
s
i
and C
g
=
∑
i∈g
−
s
i
Trade in the market moves a resource from an
agent with a surplus to an agent with a demand. In the
following, for any two groups g, g
0
∈ G, T
g
0
g
denotes
the total trade from members of group g to members
of group g
0
. The total of all transactions is defined by
totalling the trade in all directions:
τ =
∑
g,g
0
∈G
T
g
0
g
In particular, for only two groups (D and O), τ is
defined as τ = T
D
D
+T
O
D
+T
D
O
+T
O
O
as Figure 1 shows.
Figure 1: Trade directions between groups D and O.
For the evaluation of the market and its proto-
cols, we introduce measures about demand satisfac-
tion, selling success, and market efficiency.
Demand satisfaction factors are determined as in-
coming trade over demand per group:
η
D
=
T
D
D
+ T
D
O
C
D
and η
O
=
T
O
D
+ T
O
O
C
O
Selling success factors are determined as incom-
ing trade over surplus per group:
θ
D
=
T
D
D
+ T
O
D
S
D
and θ
O
=
T
D
O
+ T
O
O
S
O
Discrimination between Social Groups: The Influence of Inclusiveness-Enhancing Mechanisms on Trade
73

Two groups, g and g
0
∈ G , are said to have equal
opportunity in the market if:
|η
g
− η
g
0
| ≤ ρ
1
and |θ
g
− θ
g
0
| ≤ ρ
2
,
where ρ
1
and ρ
2
are significance margins. In contrast,
the market favors a group g over group g
0
, if:
η
g
− η
g
0
> ρ
1
or θ
g
− θ
g
0
> ρ
2
.
The total amount of trade possible is limited by the
total surplus (it is not possible to trade more energy
than what is produced) and by the total demand (it
does not make sense to trade more energy than what
is asked for). Hence, the total trade possible is:
σ = min{C
D
+C
O
, S
D
+ S
O
}
Market efficiency is defined as total trade over to-
tal possible trade:
γ =
τ
σ
Thus, γ = 1 indicates total market efficiency, but γ < 1
indicates a market in which more demand could have
been satisfied and surplus production is unnecessarily
wasted. The avoidable waste factor of surplus produc-
tion ω is defined as:
ω = 1 − γ
Similarly, the proportion of unmet demands that a
group g ∈ G suffers is defined as δ
g
= 1 − η
g
.
Discrimination. When considering discrimination
in two groups, the effect of discrimination on trade
volumes, in terms of the model, can be described as
the proportions of trade over the trade directions be-
tween and within the two groups as shown in Figure 2.
Figure 2: Left: discrimination on trade from D to O. Right:
market segregation due to the discriminating mediator (m).
4 SIMULATION MODEL
Our description follows the ODD (Overview, Design
concepts, Details) protocol (Grimm et al., 2010).
4.1 Purpose
Our model simulates trade in a prosumer market, in
presence of social discrimination, to understand the
effect of discrimination on the market and to evaluate
a mechanism for reducing discrimination.
4.2 Entities, State Variables, and Scales
The Agents in our model are the energy prosumers,
characterized by the following state variables:
• population to which the agent belongs;
• caste (Dalits or Others);
• (per capita) income; and
• consumption and production values.
The Environment is the market, characterized by the
following state variables:
• market type (bilateral or mediated);
• transaction type (full surplus, bid splitting, or
multibidding);
The Collectives of interest are the agents correspond-
ing to Dalits (D) and Others (O). The following state
variable is defined at the level of the collectives:
• discrimination, which specifies the extent to which
an agent discriminates trade from another agent.
4.3 Process Overview and Scheduling
The Main Process is a SCHEDULER, which executes
one of the following trade protocols, depending on the
transaction type: (1) FULL_SURPLUS_PROTOCOL(),
(2) BID_SPLITTING_PROTOCOL(), and (3) MULTI-
BIDDING_PROTOCOL(). Depending on the protocol,
one or more of the following functions are involved.
• TRADE() executes trades between pairs of agents;
• SPLIT_BIDS() splits bids;
• SELECT_PARTNERS() selects trade partners;
• DISCRIMINATES() determines whether and agent
discriminates trade from another agent; and
• MEASUREMENTS() computes response variables.
One complete run of the model simulates trade
among agents in a population for one day. For each
run, once the agents and the environment are config-
ured, the SCHEDULER, executes one of the the trading
protocols and logs the measurements.
4.4 Design Concepts
4.4.1 Basic Principles
Our simulation depends on market type and transac-
tion type, which determine how trade happens.
SIMULTECH 2021 - 11th International Conference on Simulation and Modeling Methodologies, Technologies and Applications
74

Market Type. In a bilateral market, the agents di-
rectly trade energy with each other. In a mediated
market, the agents trade energy via a mediator.
In a physical market, bilateral trade means that
the prosumers exchange batteries with each other,
whereas mediated trade means that a mediator col-
lects and redistributes the batteries. In an online mar-
ket, e.g., realized on a smart grid, the grid, acting as a
mediator, collects and distributes energy.
Transaction Type.
• Full surplus: An agent sells its full daily surplus
in one transaction. This setting is intended to cap-
ture how agents trade batteries in a physical mar-
ket, where they buy or sell whole batteries (which
cannot be divided). For simplicity, we assume that
each seller has all of its surplus in one battery.
Thus, each trade (buy or sell) involves one battery.
• Bid splitting models the exchange of energy, where
each production and consumption is divided into
chunks of a maximum size. For example, given a
maximum chunk size of 1, a production of 2.13 is
divided in chunks of sizes 1, 1 and 0.13. Then, each
chunk can, in principle, be sold to a partner with the
matching demand, but the remaining production or
consumption stays with the agent. For instance, in
the example above, if the agent sells two chunks
of size 1, the production of 0.13 remains with it.
The maximum chunk size plays a role in making
the system more or less efficient. We choose the
smallest surplus or demand value across all agents
as the maximum chunk size.
• Multibidding models multiple rounds of bidding in
which the remaining production from one round
can be allocated in the next round to individuals
that still have unsatisfied consumption. In each
round, bid splitting takes place, considering the
smallest surplus or demand value in that round as
the maximum chunk size. Multibidding maximizes
trade efficiency as trading ends when one of pro-
duction or consumption is fully satisfied.
4.4.2 Emergence
The market outcomes directly depend on the trades
that take place. The trades, in turn, depend on the
discriminating behavior of the agents. It is important
to note that the effect of discrimination on multiple
market variables cannot be determined directly. Sev-
eral factors, including the distribution of discriminat-
ing agents, consumption and production characteris-
tics, and trading protocols influence the effect of dis-
crimination on the response variables. Our simulation
seeks to systematically quantify these effects.
4.4.3 Objectives
One the one hand, each agent’s objective is to maxi-
mize trade (sell all surplus or buy for all demand). On
the other hand, some agents may be discriminating
(e.g., to conform to social rules) and thus participate
in some trades but not others.
4.4.4 Interaction
A pair of agents (a seller and a buyer) interact when
they trade energy. Depending on the protocol, (1) an
agent can participate in multiple trades and (2) the
same pair of agents may trade with each other mul-
tiple times, within a trading day.
4.4.5 Stochasticity
• Income is computed stochastically. The income
range is determined according to income distribu-
tion in real data but, with in the range, an income
value is randomly selected.
• Production is computed deterministically from in-
come. Since income is stochastic and production
depends on income, production is also stochastic.
• Consumption is computed, considering the agent’s
income as well as the uncertainty about the future
energy demand. Thus, consumption is stochastic.
• Discrimination behavior is stochastic. A fraction of
agents in the population are treated as discriminat-
ing. A discriminating agent has a certain probabil-
ity of successfully trading with an agent it discrim-
inates. This behavior is realistic since an agent may
not be discriminating all the times.
4.4.6 Observations
We employ the measures of market efficiency (γ), the
demand satisfaction for the two groups (η
D
ad η
O
),
and the selling success of the two groups (θ
D
and θ
O
).
4.5 Input Data
The population, income, and consumption are based
on external datasets summarized below.
Population. We model agent populations after peo-
ple in eight Indian villages, spanning four states:
Andhra Pradesh (AP), Uttar Pradesh (UP), Maharash-
tra (MH), and Rajasthan (RJ). We select these vil-
lages because the Project on Agrarian Relations in
India (PARI), a project that studies economies of dif-
ferent regions in India, surveyed households in these
villages during 2005–2007, providing important data
for our simulation (Rawal and Swaminathan, 2011)
Discrimination between Social Groups: The Influence of Inclusiveness-Enhancing Mechanisms on Trade
75

shown in Table 1. Two key pieces of information we
exploit from this data are the number households and
the percentage of Dalits households for each village.
Table 1: The household composition (of Dalits and Others)
and the mean household income (INR per year) of the eight
Indian villages (Rawal and Swaminathan, 2011) on which
we base our simulations.
Village
Households Mean Income
Total %D D O
Ananthavaram 667 42.4 30,690 93,727
Bukkacherla 292 19.8 19,829 40,596
Kothapalle 372 43.3 26,197 38,962
Harevli 112 36.6 27,540 118,951
Mahatwar 150 58.8 25,077 53,530
Warwat Khanderao 757 32.6 24,843 68,400
Nimshirgaon 250 10.0 41,647 87,393
25 F Gulabewala 204 60.2 25,111 339,078
Income. The PARI data (Rawal and Swaminathan,
2011) includes the distributions of incomes per caste
for each of the eight villages. Table 2 shows examples
of income distributions for three villages.
Table 2: The per capita income distributions of Dalits and
Others for three villages. Data for all eight villages is in
(Rawal and Swaminathan, 2011).
Income Range
Ananth-
avaram
Harevli
Nimsh-
irgaon
(INR per year) D O D O D O
<5,500 39.5 26.3 8037.7 49.4 20.5
5,500–10,000 26.1 14.6 12.5 26.1 27.3 28.2
10,000–20,000 23.6 29.3 7.511.6 16.1 31.4
20,000–30,000 10.8 11.8 0 10.1 1.2 12.1
30,000–40,000 0 4.4 0 4.3 5.9 0
40,000–50,000 0 2.2 0 0 0 3.1
>50,000 0 11.5 0 10.1 0 4.7
Consumption. No datasets, providing consumption
distributions along with income or caste information,
were available for the Indian market. However, the
RECS 2015 report (EIA, 2015) classifies the energy
consumption of US households by their annual in-
come as summarized in Table 3. We employ this data
for computing consumption values for agents in the
Indian market. Since consumption in the US market
is much higher compared to that in rural India, we per-
form appropriate scaling (described in Section 4.6).
Table 3: The income and energy consumption distribution
in US households based on the RECS report (EIA, 2015).
Household Income
(USD per year)
Consumption per
Household member
(in million BTU)
< 20,000 25.9
20,000–39,999 29.3
40,000–59,999 29.9
60,000–79,999 29.9
80,000–99,999 31.5
100,000–119,999 30,6
120,000–139,999 33,7
> 140,000 36.8
4.6 Initialization
Population. We simulate trading between agents in
eight populations of size ∈ {122, 160, 204, 250, 292,
372, 667, 757} corresponding of actual village sizes.
Within each population, the agents are assigned to
Dalits or Others according to the data (Table 1).
Income. Given an agent’s population and caste, its
income range is computed according to the distribu-
tion of incomes (Table 2). Then, an income is ran-
domly selected within the computed range.
Production. Individuals produce energy based on
their disposable income since they must be able to
afford the equipment. Thus, production is computed
from income. According to a survey (ICE 360, 2016),
Indian households in the the bottom quantile spend
around 20% of their income on other expenses, which
we consider as disposable income to pay for electric-
ity production. Given that a device with a production
of 0.1kWh costs around 1,600 INR and the lifespan
of a solar panel is around 20 years, we assume house-
holds invest all disposable income for the following
20 years to buy as many devices as they can afford.
Thus, the available production is computed by multi-
plying the production of a single device by the num-
ber of devices that a household can afford, given its
disposable income for the following 20 years.
Consumption. First, we map the income of an
agent from the Indian range (0–60,000) in Table 2 to
the USA range (0–150,000) in Table 3. Then, we as-
sign an initial consumption value to the agent from
Table 3. Next, we scale the initial consumption value
based on the average consumption values (in 2015)
of Indian household, given as 806 kWh (compared to
12,984 kWh of US) (The World Bank, 2014). Yearly
SIMULTECH 2021 - 11th International Conference on Simulation and Modeling Methodologies, Technologies and Applications
76

consumption is then converted to daily consumption.
The energy needs of an average Indian household
and an average rural Indian household may differ.
Thus, the consumption values are further rescaled,
controlled by the consumption offset parameter ∈
{0.25, 0.5, 1.0}. Finally, for each agent, a daily con-
sumption value is sampled from a normal distribu-
tion centered on the scaled consumption value for the
agent, and having a standard deviation controlled by
the consumption std.dev parameter ∈ {10, 50}.
Discrimination. In a bilateral market, the parame-
ter fraction of O discriminating D ∈ {0, 0.2, 0.5, 0.8,
1} controls the number of agents in O that discrimi-
nate the agents in D (one direction). A discriminating
agent in O refuses to buy from an agent in D, if paired
so by the protocol, with a high probability (90%).
In a mediated market, the same parameter (fraction
of O discriminating D ∈ {0, 0.2, 0.5, 0.8, 1}) controls
the percentage of inter-caste trades (in either direc-
tion) that the mediator allows.
4.7 Submodels
Listing 1 describes the three protocols introduced in
Section 4.4. The full surplus protocol is a baseline,
representing how batteries are likely traded in a phys-
ical market. The bid splitting and multibidding proto-
cols capture the mechanisms we introduce.
Each protocol starts by sorting the bids. The sort-
ing order makes a difference during partner selection
(Listing 2). In the full surplus protocol, both sellers’
and buyers’ bids are sorted in the descending order.
This captures the intuition that a seller wants to sell
his or her battery to a buyer with the highest possi-
ble demand but less than the seller’s surplus. In con-
trast, the other two protocols sort the sellers’ bids in
descending order and buyers’ bids in ascending order
giving priority to sellers with higher surplus and buy-
ers with lower demand. However, since the trade hap-
pens with split bids in bid splitting and multibidding
protocols, all agents get an opportunity to trade.
The simulation is implemented in Python 3 based
on the MESA simulation framework
1
with custom-
made agents and actors. The source code is available
on GitHub
2
. The simulation was executed on a work-
station with 48 cores and 64GB of RAM.
1
https://github.com/projectmesa/mesa
2
https://github.com/bennati/EnergyVCG/tree/
discrimination_dev
Listing 1: Trading protocols.
1: procedure FULL_SURPLUS_PROTOCOL(S, B)
2: SORT_BIDS(S,‘DSC’, B, ‘DSC’)
3: TRADE(S, B);
4: return MEASUREMENTS()
5: procedure BID_SPLITTING_PROTOCOL(S, B)
6: SORT_BIDS(S, ‘DSC’, B, ‘ASC’)
7: SPLIT_BIDS(S, B)
8: TRADE(S, B)
9: return MEASUREMENTS()
10: procedure MULTIBIDDING_PROTOCOL(S, B)
11: SORT_BIDS(S, ‘DSC’, B, ‘ASC’)
12: while ¬(S.BIDS().EMPTY()
|| B.BIDS().EMPTY()) do
13: SPLIT_BIDS(S, B)
14: TRADE(S, B)
15: return MEASUREMENTS()
16: procedure TRADE(S, B)
17: partners_list ←
/
0
18: next_partners ← SELECT_PARTNERS(S, B)
19: while next_partners 6=
/
0 do
20: partners_list.ADD(next_partners)
21: next_partners ← SELECT_PARTNERS(S, B)
22: for all partners ∈ partners_list do
23: PERFORM_TRADE(partners[0], partners[1])
24: UPDATE_BIDS(S, B)
5 EXPERIMENTS
We evaluate the following hypotheses.
H
1
: Discrimination prevents Dalits from accessing
the market, hence reducing θ
D
.
H
2
: Discrimination reduces market efficiency γ.
H
3
: In a mediated market, implemented with a dis-
criminating mediator, the efficiency γ as well as the
satisfaction of both Dalits η
D
and Others η
O
, will
be worse than in the non-mediated case.
H
4
: The bid-splitting strategy increases the effi-
ciency of trade γ even if discrimination occurs.
H
5
: Given H3 and H4, bid splitting increases the
range of situations in which a mediated configu-
ration is preferable, for efficiency γ and η
D
, over a
bilateral configuration.
H
6
: In the condition that total surplus is larger than
total demand: S
D
+ S
O
> C
D
+ C
O
, where there is
the possibility of satisfying the needs in the mar-
ket completely, discrimination prevents trade T
O
D
,
which might reduce the demand satisfaction η
O
.
Simulations were run for 10 trading days, for each
combination of population size ∈ {122, 160, 204, 250,
292, 372, 667, 757}, consumption offset ∈ {0.25, 0.5,
Discrimination between Social Groups: The Influence of Inclusiveness-Enhancing Mechanisms on Trade
77

Listing 2: Bid splitting and Partner selection.
1: procedure SPLIT_BIDS(S, B)
2: all_bids ← S.BIDS() ∪ B.BIDS()
3: max_chunk_size ← MINIMUM(all_bids)
4: for all s ∈ S do
5: s.split_bids ← SPLIT(s.bid, max_chunk_size)
6: for all b ∈ B do
7: b.split_bids ← SPLIT(b.bid, max_chunk_size)
8: procedure SELECT_PARTNERS(S, B)
9: while i < S.LENGTH() do
10: while j < B.LENGTH() do
11: if protocol == ‘Full_Surplus’ then
12: match_condition ← S[i].bid >= B[ j].bid
13: else
14: match_condition ←
S[i].split_bids[0] == B[ j].split_bids[0]
15: if match_condition == True then
16: if DISCRIMINATES(S[i], B[ j]) == True then
17: i ← i + 1 Discriminating seller
18: else if DISCRIMINATES(B[i], S[ j]) == True then
19: j ← j + 1 Discriminating buyer
20: else
21: return hi, ji No discrimination
22: j ← j + 1
23: i ← i + 1
24: return
/
0
1.0}, consumption std.dev ∈ {10, 50}, and fraction of
O discriminating D ∈ {0.0, 0.2, 0.5, 0.8, 1.0}, result-
ing in in 240 samples, with 10 replications each.
First, we analyze the sensitivity of important ob-
servable variables (market efficiency γ and market ac-
cess for Dalits with production surplus θ
D
) to varia-
tion of the control variables above. In this analysis, a
market is assumed with bilateral trade among agents
using FULL_SURPLUS protocol. The sensitivity anal-
ysis is used to configure the following experiments.
Experiment 1: compares the efficiency and satisfac-
tion in bilateral markets, for varying discrimina-
tion by agents, in markets with different transaction
types (H
1
and H
2
).
Experiment 2: compares the efficiency and satisfac-
tion of a bilateral and a mediated configuration,
with and without bid splitting, against discrimina-
tion (H
3
, H
4
, and H
5
).
Experiment 3: compares the reduction of satisfac-
tion factors by discrimination (in particular, the
slope in demand satisfaction) in cases with surplus
production with that in cases with shortage, both
in bilateral and mediated markets (H
6
).
6 RESULTS AND DISCUSSION
Sensitivity Analysis. The average γ and θ
D
values
from 2400 observations were 0.687 and 0.372, respec-
tively. Average within-sample variance resulting from
random generation processes in the simulations was
5% and 14% of total variance for γ and θ
D
, respec-
tively, leaving the rest to be explained from parameter
variations. Table 4 shows the results of multiple re-
gression to test sensitivity, with adjusted R
2
values of
0.76 and 0.74, respectively.
Table 4: Regression coefficients from sensitivity analysis.
Estimate Std.Error Pr(> |t|)
Coefficients for γ:
(Intercept) 1.272 8.2e-3 <2e-16
Fraction of
O discriminating D
-0.095 5.1e-3 <2e-16
Consumption offset -8.024 0.109 <2e-16
Consumption std.dev. -9.5e-3 2e-4 <2e-16
Population size -5e-6 8.5e-6 0.559
Consumption offset
× std.dev.
0.124 3e-3 <2e-16
Coefficients for θ
D
:
(Intercept) 0.126 0.01 <2e-16
Fraction of
O discriminating D
-0.295 6.4e-3 <2e-16
Consumption offset 4.708 0.135 <2e-16
Consumption std.dev. 5e-3 2.5e-4 <2e-16
Population size -1.7e-5 1.1e-5 0.0992
Consumption offset
× std.dev.
-0.014 3.8e-3 0.0002
Discrimination and consumption distribution have
strong and significant effects on the simulation out-
comes. Thus, in testing hypotheses, we differenti-
ate the variable analyzed with respect to the values
of these two parameters.
Population size has no relevant effect. ANOVA
with Tukey test did not reveal significant differences
between average outcomes for different population
sizes. Since larger population sizes have negligible
effects and largely affect simulation time, we perform
further experiments on populations of 100 agents.
For hypothesis testing, we formed a dataset, con-
taining results from 10 replications of simulations
of 10 trading days. Each replication freshly gener-
ated random variables for each of the possible com-
binations of discrimination (5 values as above), con-
sumption distribution characteristics (6 combinations
as above), market type ∈ {bilateral, mediated}, and
transaction type ∈ {full daily surplus, bid split, multi-
bid}, resulting in 18000 observations.
SIMULTECH 2021 - 11th International Conference on Simulation and Modeling Methodologies, Technologies and Applications
78
6.1 H
1
(Market Access)
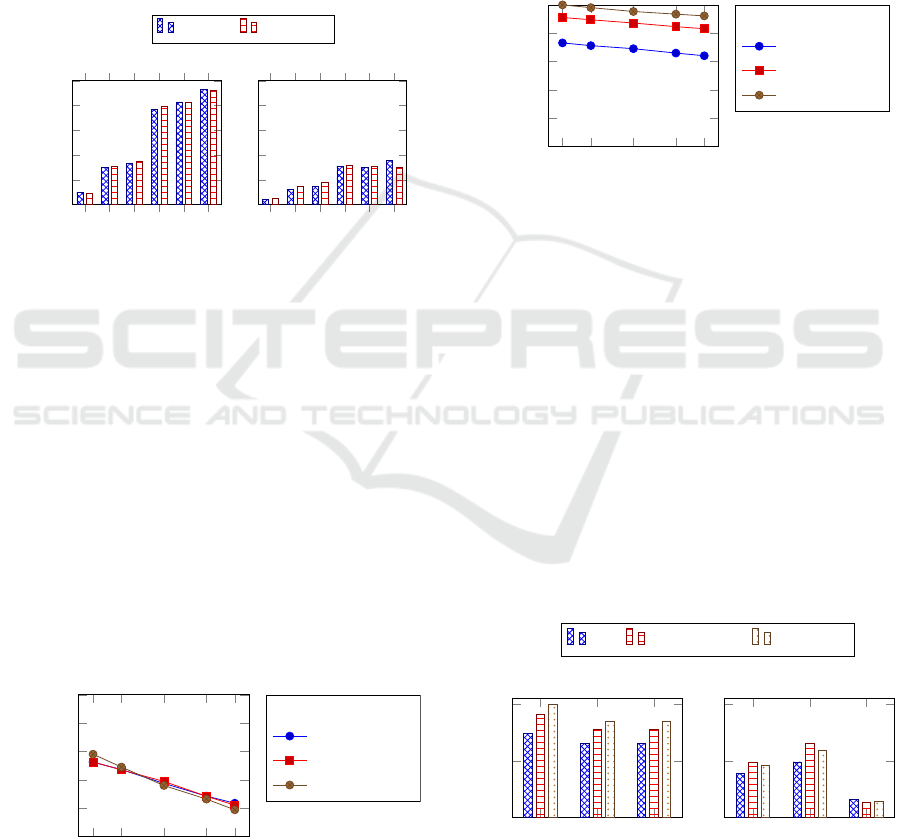
Figure 3 shows the market access for Dalits, averaged
over the transaction types, for the different consump-
tion distributions. In all cases, the effect of discrimi-
nation on θ
D
is significant (p <0.001). Figure 4 shows
the market access for Dalits for each transaction type,
averaged over different consumption characteristics,
for different discrimination levels. Again, the dif-
ference, across discrimination levels, was significant
(p <0.001). These results confirm that discrimination
reduces the market access for Dalits (H
1
).
(0.025, 10)
(0.025, 50)
(0.05, 10)
(0.05, 50)
(0.1, 10)
(0.1, 50)
0
0.2
0.4
0.6
0.8
1
Consumption parameters
θ
D
Discrimination=False
(0.025, 10)
(0.025, 50)
(0.05, 10)
(0.05, 50)
(0.1, 10)
(0.1, 50)
0
0.2
0.4
0.6
0.8
1
Consumption parameters
Discrimination=True
Bilateral Mediated
Figure 3: Average θ
D
values for different consumption dis-
tribution parameters (offset, SD) in non-discriminating and
discriminating bilateral and mediated trades.
Further, with no discrimination (Figure 3, left),
simulated results did not significantly differ between
bilateral and mediated trading. However, with dis-
crimination (Figure 3, right), for the right most con-
sumption configuration, the difference in θ
D
between
bilateral and mediated markets was significant, show-
ing that a discriminating mediator, segregating the
market, can further influence θ
D
.
Finally, transaction type had little effect on the
market access for Dalits in both bilateral and medi-
ated markets. Figure 4 shows the result for bilateral
case (results for the mediated case are similar).
0 0.2
0.5
0.8 1
0
0.2
0.4
0.6
0.8
1
Discrimination
θ
D
Transaction
Full
Bid splitting
Multibid
Figure 4: Average effect from fraction of O discriminating
D on θ
D
, under different transaction types in bilateral trade.
6.2 H
2
(Market Efficiency)
Figure 5 shows the effect of discrimination on mar-
ket efficiency (averaged across consumption distribu-
tions) for different transaction types. The effect of
discrimination on market efficiency was significant
(p < 0.001), confirming H
2
. Further, we observe that
the difference in efficiency between transaction types
was also significant (p < 0.001). These results are for
the bilateral market. Similar results are obtained for
mediated markets (Section 6.3).
0 0.2
0.5
0.8 1
0
0.2
0.4
0.6
0.8
1
Discrimination
γ
Transaction
Full
Bid splitting
Multibid
Figure 5: Average effect of discrimination on market effi-
ciency γ under different transaction types in bilateral trade.
6.3 H
3
(Discriminating Mediator)
Since a discriminating mediator may separate the
markets for Dalits and Others, not all trade oppor-
tunities can be utilized, which can potentially lower
market efficiency and demand satisfaction (H
3
).
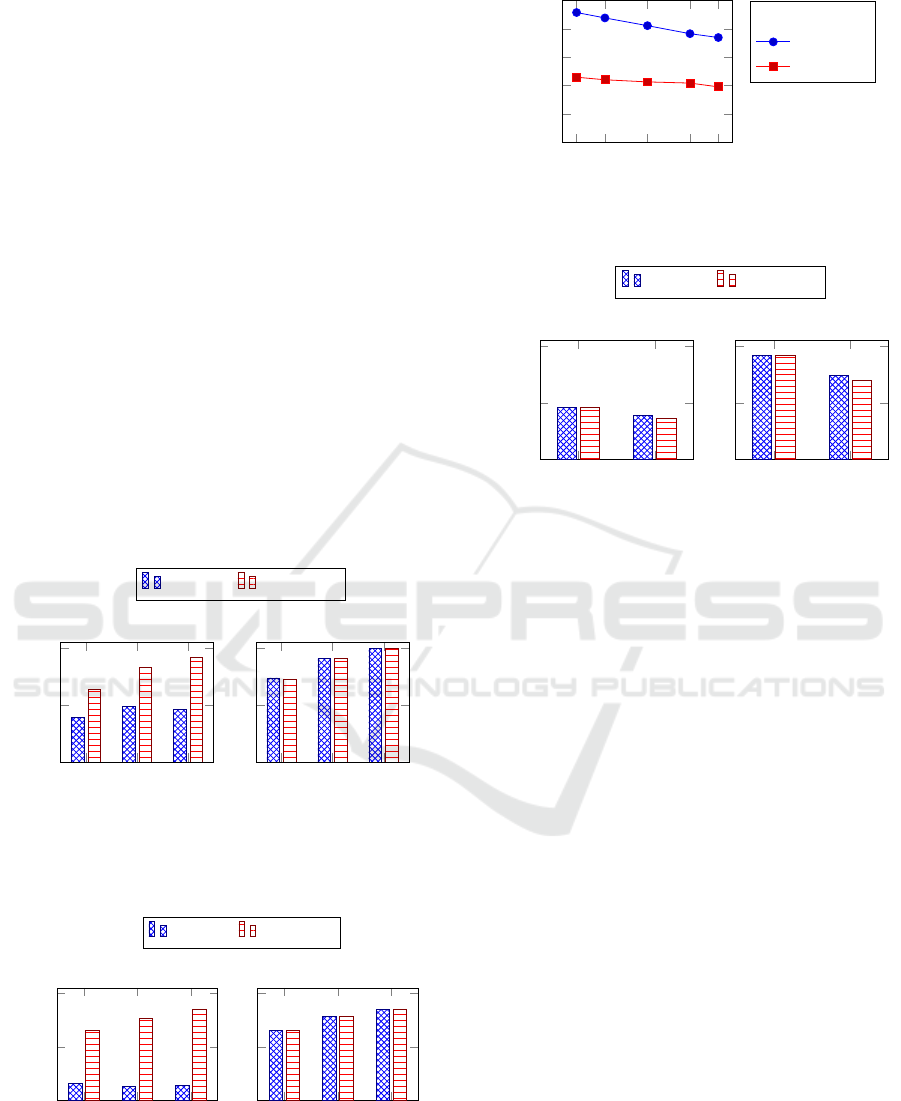
Figure 6 shows the effect of discrimination on ef-
ficiency and demand satisfaction in a mediated mar-
ket. The differences were significant (p < 0.001),
confirming H
3
. Further, it is interesting to observe
that, discrimination reduces the demand satisfaction
for not only the Dalits (η
D
) but also the Others (η
O
).
However, the margin of difference is much higher for
the Dalits than the Others.
γ
η
O
η
D
0
0.5
1
Discrimination=False
γ
η
O
η
D
0
0.5
1
Discrimination=True
Full Bid splitting Multibid
Figure 6: Average values of efficiency (γ), demand satisfac-
tion of Others (η
O
) and Dalits (η
D
) in a mediated market
with a non-discriminating and a discriminating mediator.
Discrimination between Social Groups: The Influence of Inclusiveness-Enhancing Mechanisms on Trade
79
6.4 H
4
(Bid Splitting)
Bid splitting, i.e., selling the daily surplus in fixed
chunks, as well as the multibid market with variable
chunks, increases efficiency in bilateral and mediated
markets, with and without discrimination, as Figures
5 and 6 show, confirming H
4
.
6.5 H
5
(Bid Splitting and Mediation)
Given H
4
results, it is tempting to assume that it
would be preferable to implement a mediated system
with some bid-splitting mechanism, even if discrimi-
nation is possible. However, as Figures 7 and 8 show,
this is not the case. That is, if there is discrimination,
(1) the efficiency (Figure 7) of the mediated market is
worse than that of the bilateral market; and
(2) the demand satisfaction of Dalits (Figures 8) is
worse (to a greater degree than efficiency) in the
mediated market than in the bilateral market.
Thus, we could not confirm H
5
. In essence, we
observe that a discriminating mediator is worse than
a bilateral market with discrimination.
Full
Bid-splitting
Multibid
0
0.5
1
γ
Discrimination=True
Full
Bid-splitting
Multibid
0
0.5
1
Discrimination=False
Bilateral Mediated
Figure 7: Market efficiency (γ), without and with discrimi-
nation, in mediated and bilateral markets.
Full
Bid-splitting
Multibid
0
0.5
1
η
D
Discrimination=True
Full
Bid-splitting
Multibid
0
0.5
1
Discrimination=False
Bilateral Mediated
Figure 8: Demand satisfaction for Dalits (η
D
), without and
with discrimination, in mediated and bilateral markets.
0 0.2
0.5
0.8 1
0
0.2
0.4
0.6
0.8
1
Discrimination
η
O
Production
Surplus
Shortage
Figure 9: Effect of discrimination on η
O
in bilateral trade,
in situations of surplus production and shortage.
False
True
0
0.5
1
Discrimination
η
O
Production=Shortage
False
True
0
0.5
1
Discrimination
Production=Surplus
Bilateral Mediated
Figure 10: Effect of discrimination on Others’ demand sat-
isfaction (η
O
) in bilateral and mediated markets.
6.6 H
6
(Demand Satisfaction)
The preceding hypotheses were mainly about the neg-
ative effects on Dalits. However, in some cases, dis-
crimination may also affect the discriminating Others.
Complete demand fulfillment is possible if the to-
tal surplus production from the entire population ex-
ceeds the total demand, with some margin for chunk
size ε, i.e., η
O
= 1 − ε. However, when Others refuse
to buy from Dalits, possible fulfillment cannot not be
realized in some cases, resulting in a discrimination-
induced reduction of η
O
. Figures 9 and 10 show this
effect. The effect of discrimination on η
O
was signif-
icant (p < 0.001) in both shortage and surplus cases,
confirming H
6
. However, we observe that this effect
is stronger with a surplus as opposed to shortage.
7 CONCLUSIONS
Discrimination has an Overall Negative Effect on
Market. Our simulation confirms the negative effect
of discrimination in prosumer markets in terms of re-
duced trade efficiency (H
2
) and, in particular, reduced
market access for the discriminated group (H
1
). We
show how discrimination can damage the discriminat-
ing group as well. By restricting market access of the
discriminated group and with it the overall trade vol-
SIMULTECH 2021 - 11th International Conference on Simulation and Modeling Methodologies, Technologies and Applications
80

ume, the demand satisfaction of both discriminated
and discriminating groups are affected.
Increasing Production May Not Reduce
Discrimination. We show that discrimination
prevents complete demand satisfaction even when
production is surplus (H
6
). Thus, subsidies for the
purchase of equipment, so as to increase production
capacity, especially, that of the discriminated group,
would not solve the problem. On the contrary, their
positive effect would be eroded by discrimination.
Mediation with Discrimination is Worse than
Bilateral Trade. Some people may have regular over-
production and some regularly suffer from shortage,
instigating trading opportunity. As long as no elec-
tricity grid is in place, surplus energy will have to be
stored in and traded via batteries. On the one hand,
bilateral trade, requiring physical contact, is subject
to discrimination. On the other hand, mediation in-
creases personal distance and can potentially reduce
discrimination. However, we show that, a mediated
market with discriminating mediator is worse than a
non-mediated market for both Dalits and Others (H
3
).
Agent-based Mediation Reduces Discrimination.
A human mediator is subject to the same prejudices
as the rest of the society. If the mediator is a Dalit, the
Others may not buy from the mediator. If the mediator
is an Other, he or she may segregate the market to con-
form to social rules. We study agent-based mediation,
where agents trade on behalf of humans. We argue
that agents designed with the values of anonymiza-
tion and inclusion reduce discrimination. We propose
a mechanism, involving bid splitting and multibid-
ding, for agents to trade energy, e.g., via a local grid.
Our overall simulation results show that the proposed
mechanism is effective in reducing discrimination.
REFERENCES
Betancourt, R. and Gleason, S. (2000). The allocation of
publicly-provided goods to rural households in India:
On some consequences of caste, religion and democ-
racy. World Development, 28(12):2169–2182.
Bhattacharyya, S. C. (2006). Energy access problem of the
poor in India: Is rural electrification a remedy? En-
ergy Policy, 34(18):3387–3397.
Borooah, V. K., Diwakar, D., Mishra, V. K., Naik, A. K.,
and Sabharwal, N. S. (2014). Caste, inequality, and
poverty in India: A re-assessment. Development Stud-
ies Research, 1(1):279–294.
Bower, J. and Bunn, D. (1999). A Model-Based Com-
parison of Pool and Bilateral Market Mechanisms for
Electricity Trading. New York, 44(0):1–20.
Bullinaria, J. (2018). Agent-based models of gender in-
equalities in career progression. Journal of Artificial
Societies and Social Simulation, 21(3):7.
Census of India (2011). Sources of lighting: 2001–
2011. http://www.censusindia.gov.in/2011census/hlo/
Data_sheet/India/Source_Lighting.pdf.
Chaurey, A. and Kandpal, T. C. (2010). A techno-economic
comparison of rural electrification based on solar
home systems and PV microgrids. Energy Policy,
38(6):3118–3129.
Chen, S. H. (2012). Varieties of agents in agent-based com-
putational economics: A historical and an interdisci-
plinary perspective. Journal of Economic Dynamics
and Control, 36(1):1–25.
Cust, J., Singh, A., and Neuhoff, K. (2007). Rural electri-
fication in India: Economic and institutional aspects
of renewables. Cambridge Working Papers in Eco-
nomics 0763, University of Cambridge.
EIA (2015). US Energy Information Administration: Res-
idential Energy Consumption Survey (RECS). https:
//www.eia.gov/consumption/residential/data/2015/.
Accessed: September 2019.
Grimm, V., Berger, U., DeAngelis, D. L., Polhill, J. G.,
Giske, J., and Railsback, S. F. (2010). The ODD pro-
tocol: A review and first update. Ecological mod-
elling, 221(23):2760–2768.
ICE 360 (2016). People Research on India’s Consumer
Economy: How Indians Spend? http://www.ice360.
in/en/projects/homepageservey/how-indians-spends.
Accessed: September 2019.
Ilic, D., Da Silva, P. G., Karnouskos, S., and Griesemer,
M. (2012). An energy market for trading electricity
in smart grid neighbourhoods. In IEEE International
Conference on Digital Ecosystems and Technologies,
pages 1–6.
Kirman, A. (1989). The intrinsic limits of modern economic
theory: The emperor has no clothes. The Economic
Journal, 99(395):126–139.
Lee, J., Guo, J., Choi, J. K., and Zukerman, M. (2015).
Distributed Energy Trading in Microgrids: A Game
Theoretic Model and Its Equilibrium Analysis. IEEE
Transactions on Industrial Electronics, 62(6):1–1.
Li, G., Shi, J., and Qu, X. (2011). Modeling methods for
GenCo bidding strategy optimization in the liberalized
electricity spot market–a state-of-the-art review. En-
ergy, 36(8):4686–4700.
Nadal, J.-P., Chenevez, O., Weisbuch, G., and Kirman,
A. (1998). A formal approach to market organiza-
tion: Choice functions, mean field approximation and
maximum entropy principle. In Advances in Self-
Organization and Evolutionary Economics: New De-
velopments, pages 1–9.
Plous, S. (2003). The psychology of prejudice, sterotyp-
ing, and discrimination: An overview. In Plous, S.,
editor, Understanding prejudice and discrimination,
pages 3–48. McGraw-Hill, New York.
Rawal, V. and Swaminathan, M. (2011). Income inequality
and caste in village India. Review of Agrarian Studies,
1(2):108–133.
REC Limited (2019). Household electrification status (as
reported by states). https://saubhagya.gov.in.
Discrimination between Social Groups: The Influence of Inclusiveness-Enhancing Mechanisms on Trade
81

Saad, W., Han, Z., Poor, H. V., and Ba¸sar, T. (2011). A
noncooperative game for double auction-based energy
trading between PHEVs and distribution grids. In
IEEE International Conference on Smart Grid Com-
munications, pages 267–272.
Sha, M. and Catalão, J. P. S. (2015). A stochastic multi-
layer agent-based model to study electricity market
participants behavior. IEEE Transactions on Power
Systems, 30(2):867–881.
Shinde, R. (2017). Institutional innovation: Case study of
sustenance of solar electrification projects in rural In-
dia: Innovating institutions with technological innova-
tions. Master’s thesis, Delft University of Technology.
Singh, A., Strating, A. T., Herrera, N. R., van Dijk, H. W.,
and Keyson, D. V. (2017). Towards an ethnography of
electrification in rural India: Social relations and val-
ues in household energy exchanges. Energy Research
& Social Science, 30:103–115.
Takács, K. and Squazzoni, F. (2015). High standards en-
hance inequality in idealized labor markets. Journal
of Artificial Societies and Social Simulation, 18(4):2.
The World Bank (2014). Electric power consumption (kWh
per capita). https://data.worldbank.org/indicator/EG.
USE.ELEC.KH.PC. Accessed: September 2019.
Thorat, S. and Neuman, K. S., editors (2012). Blocked
by Caste: Economic Discrimination in Modern India.
Oxford University Press, Noida, India.
Trotter, P. A. (2016). Rural electrification, electrification
inequality and democratic institutions in sub-Saharan
Africa. Energy for Sustainable Development, 34:111–
129.
Tushar, W., Zhang, J. A., Smith, D., Poor, H. V., and
Thiébaux, S. (2014). Prioritizing consumers in smart
grid: A game theoretic approach. IEEE Transactions
on Smart Grid, 5(3):1429–1438.
Urmee, T. and Md, A. (2016). Social, cultural and politi-
cal dimensions of off-grid renewable energy programs
in developing countries. Renewable Energy, 93:159–
167.
Weidlich, A. and Veit, D. (2008). A critical survey of agent-
based wholesale electricity market models. Energy
Economics, 30(4):1728–1759.
Winker, P. and Gilli, M. (2001). Indirect estimation of the
parameters of agent based models of financial mar-
kets. Computing in Economics and Finance 2001 59,
Society for Computational Economics.
SIMULTECH 2021 - 11th International Conference on Simulation and Modeling Methodologies, Technologies and Applications
82
