
Towards Integrating Security in Industrial
Engineering Design Practices
Panagiotis Dedousis
1
, George Stergiopoulos
1,2
, George Arampatzis
3
and Dimitris Gritzalis
1
1
Dept. of Informatics, Athens University of Economics & Business, Athens, Greece
2
Dept. of Information & Communication Systems Engineering, University of the Aegean, Samos, Greece
3
School of Production Engineering & Management, Technical University of Crete, Chania, Greece
Keywords: Critical Infrastructure Protection, Component Cascading Failures, Dependency Risk Graphs, Resilience.
Abstract: During the past decades, and especially since the Stuxnet event, there has being a growing concern around
the protection of critical infrastructures. Even though the protection of such systems and services has been an
international security priority, still, even after all those years, relevant research either focuses on individual
ICS systems security (PLC, RTU and SCADA network protection and attacks), or uses high-level models to
perform risk assessments, mostly from a system-of-systems scope that studies interdependencies. From an
engineering perspective, current approaches address system resilience from an efficiency perspective (i.e.
focusing on the availability of physical processes) while neglecting the security dimension of their compo-
nents. Still, the availability and reliability requirements of such systems are directly affected by security inci-
dents. To our knowledge, there is currently no process to integrate security-by-design in industrial critical
infrastructure engineering. To this end, we present a method to integrate security risk assessment analysis into
engineering design practices. We do this by modeling internal dependencies between physical components in
critical industrial production processes to identify possible hotspots of system failures that are challenging to
handle later in the development lifecycle, especially during operation. To validate our approach, we model
and assess the present situation in a portion of an actual oil refining plant, thereby establishing a baseline
model. Then we introduce risk mitigation measures by altering the design of the baseline model, resulting in
a reduction of the overall cascade risk.
1 INTRODUCTION
Critical infrastructures (CIs) provide vital services to
the society, depending on the specific sector of their
activity, such as energy, water, health, finance, trans-
portation. All sectors serve as the main structure of
the economy, security, and health. Their destruction
poses one of the greatest threats to physical security,
national economic, national public health or safety, or
any combination thereof.
For authorities worldwide, minimizing the risk
against all potential threats that could damage CIs by
enhancing resilience and reliability has become a reg-
ulatory requirement (Setola et al., 2016). The US sup-
ports this through the NIS Directive (Evaluation study
of Council Directive 2008/114, 2020), while the US
has published specific frameworks solely to protect
CIs. (Parfomak, 2007).
Emerging threats and unconventional attacks on
CIs have exposed the limits of traditional risk assess-
ment and risk mitigation efforts (Ani et al., 2019).
Some threats cannot be anticipated, and it is not al-
ways cost-effective to reduce all potential risks at the
minimum level possible.
Even though authorities have long identified the
risks behind cyberattacks on CΙ, still, to our knowled-
ge, there is no work on how to integrate security-by-
design principles in industrial critical infrastructure
engineering. Investing in system architecture and fo-
cusing on resilience during the design stage is much
more efficient and less costly than keep funding the
protection of systems that are not resilient and secure
(Eckert & Isaksson, 2017; Hulse et al., 2019).
In our paper, we present our work towards integ-
rating engineering design practices with security risk
assessment and dependency analysis. This integration
enables engineers and security experts to identify and
Dedousis, P., Stergiopoulos, G., Arampatzis, G. and Gritzalis, D.
Towards Integrating Security in Industrial Engineering Design Practices.
DOI: 10.5220/0010544001610172
In Proceedings of the 18th International Conference on Security and Cryptography (SECRYPT 2021), pages 161-172
ISBN: 978-989-758-524-1
Copyright
c
2021 by SCITEPRESS – Science and Technology Publications, Lda. All rights reserved
161

assess security issues at the level of process-based en-
gineered systems (industrial applications). Critical in-
dustrial infrastructures are production systems with
complex production chains. Their production chains
are networks of productive activities and are charac-
terized by flows of resources; i.e., physical flows of
materials and energy, and flows of monitoring and
control information accompanying the physical flo-
ws. Physical flows are subject to availability require-
ments and constraints of the output capacity of the
production system. Similarly, monitoring and infor-
mation availability and integrity are required to ensu-
re the system output.
Our main contribution is a component-centric ap-
proach that focuses on each process’s input-output re-
sources comprising a system. Engineers are mainly
interested in the flows of materials (oil, water, gas)
and energy (electrical, chemical, thermal) and not in-
formation flows. They also focus only on processes.
Instead, we focus on information flows in conjunction
with engineering processes in a more holistic way to
design such material flows. We utilize material flow
analysis (MFA) to model the underline processes and
flows of a critical industrial infrastructure production
chain into a material flow network graph, thus creat-
ing a design model. Also, we utilize a risk assessment
and dependency analysis methodology to evaluate the
cascade impacts of process disruptions and the over-
all risk affecting the CI based on the design model.
Our approach can identify process points of potential
failures in engineering process design. Such points of
failure are challenging to handle later in the develop-
ment lifecycle, especially during operation. By iden-
tifying such hotspots, countermeasures can be inte-
grated directly into the design process of the project
lifecycle, improving system reliability and resiliency.
We apply our approach to assess a part of the pro-
duction chain corresponding to Liquefied Petroleum
Gas (LPG) purification of an actual oil refining plant
under a high-risk scenario. We analyze specific pro-
duction flows and then implement selected mitigation
measures by altering and modifying the baseline net-
work flow design of the LPG model to reduce the
overall risk, thus proving/demonstrating the validity
of using such measures during the design step of such
processes. In summary, we contribute the following:
1. A technique that models material, energy, and in-
formation flows using security principles in pro-
duction chains of critical infrastructures.
2. A modeling approach that maps and converts the
assets and the interdependencies of a material
flow network into a risk dependency graph based
on the existing CI production chain topology.
3. A risk calculation methodology that depicts the
probability of a threat to disrupt a CI asset based
on a noisy-OR model and a rating scale to evalu-
ate each impact’s severity.
The rest of the paper is organized as follows: Sec-
tion 2 discusses related work and compares critical
infrastructure protection methods. Section 3 describes
the fundamental building blocks. Section 4 describes
step by step the proposed methodology. Section 5 de-
scribes the implemented tool and analyses the imple-
mentation of the methodology in a real-world exam-
ple. The conclusion discusses paper results and poten-
tial future research.
2 RELATED WORK
Various methodologies are used to determine resili-
ence and evaluate the different dimensions involved
in the factors that affect CIs. The methods proposed
in the scientific literature mostly focus on: (i) risk as-
sessment methodologies for assessing the risk of CI,
(ii) CI interdependencies, (iii) ICS systems security,
and (iv) security-by-design approaches. The main in-
tention of such high-level methodologies is to analyze
the multi-dimensional impacts of disruptive incidents
involving CIs in multiple sectors (Ani et al., 2019).
Traditional risk assessment methodologies usual-
ly focus on individual vulnerabilities on already op-
erational systems (BS ISO/IEC 27001, 2013; ISACA.
2012b, 2012; NIST SP 800-30, 2012). However, tra-
ditional Risk assessments performed on already es-
tablished and functioning systems mostly result in
added layers of cybersecurity on top of existing sys-
tems. Similar approaches adopt the concept of sys-
tem-of-systems to address safety effectively, security,
reliability, and robustness in CIs (Axelsson & Ko-
betski, 2018; Kobetski & Axelsson, 2017). Although
system-of-systems analysis provides a comprehensi-
ve top-down overview of the environment in which
the CI operates and how risk propagates to and from
the system, it is fraught with uncertainty about how
constituent systems operate and function.
CI are complex systems that depend on other CI
or/and suppliers for their operations. Several authors
stressed the importance of modeling CI as intercon-
nected systems to explain the cascade effects due to
their strong interdependencies (Min et al., 2007; Ri-
naldi et al., 2001). Many approaches utilize graph vis-
ualization or cascade diagrams to model the interde-
pendencies among CI and assess the cascading risk
considering cross-sectoral and cross-border interde-
pendencies (Azzini et al., 2018; Ferrario et al., 2016).
SECRYPT 2021 - 18th International Conference on Security and Cryptography
162

In (Stergiopoulos et al., 2016), authors proposed to
use graphs for time-based critical infrastructure de-
pendency analysis for large-scale and cross-sectoral
failures in CI. From a supply chain perspective, many
approaches study the dynamics of the interdepend-
ence between CI and suppliers to identify, assess, and
mitigate risks within their end-to-end supply chain,
thus improve CI resilience (Hossain et al., 2019;
Trucco et al., 2018). Modeling and assessing interde-
pendencies either between CIs or CI and suppliers can
identify and minimize the cascading risk to CI but do-
es not directly address the CI resilience & reliability.
Existing work focusing on individual CI mostly
delves into dynamically assessing industry IT and
ICT networks by evaluating the cascading failures o-
ver time between assets involved in and among dif-
ferent business processes (Stergiopoulos et al., 2017),
utilizing graphical models over the system architec-
ture and perform risk analyses to understand ICT (i.e.,
PLC, RTU, SCADA) weaknesses in the industry
(Cherdantseva et al., 2016; Johansson et al., 2009)
and performing targeted, technical attacks on individ-
ual ICS systems; e.g., binary manipulation of ladder
logic in PLCs, attacking actuator software etc.
(Adepu et al., 2020; Ylmaz et al., 2018). Other ap-
proaches utilize the concept of security-by-design to
provide more flexible and effective ways to secure
ICT/OS solutions during software development (Ca-
voukian & Dixon, 2013; Filkins, 2020). While ad-
dressing the risk of attacks to a CI, these approaches
focus mainly on cybersecurity, ignoring the various
threats and vulnerabilities of the various physical pro-
cesses involving in the production chain of a CI.
From an engineering perspective, the concept of
multicriteria optimization in infrastructure design is
not new; however, most of them focus on the topic of
cost‐effectiveness (Chen et al., 2018; Rizki et al.,
2020). Also, MFA and material flow networks (MFN)
are utilized during the design stage to optimize the
model system based on multiple criteria (e.g., cost,
environmental impact) (Funke & Becker, 2020; Page
& Wohlgemuth, 2010). These studies in the general
area of infrastructure design optimization do not con-
sider the security perspective of CI. Other techniques
implement security-by-design during the implemen-
tation stage by selecting certified components that are
inherently secure-based on specific cybersecurity
standards (ANSI/ISA-62443, 2020). To that end, se-
curity-by-design should go beyond protecting the in-
dividual system components and how they are secure
based on their design.
The benefits of modeling in the design process
have allowed a what-if analysis of component failures
and hazardous conditions in systems that are not yet
implemented, thereby saving time, reducing costs
while managing risk (Bakirtzis et al., 2020). Although
the theory and visualization techniques for transition-
ing to model-based cybersecurity analysis are ad-
vancing (Dwivedi, 2018; Jauhar et al., 2015), there
are still several challenges. Most approaches focus
only on cyber-attacks utilizing attack vectors to assess
the risk ignoring other types of threats. Also, they re-
quire system designers and engineers to be aware of
possible cybersecurity threats without necessarily be-
ing security analysts themselves.
Compared with the mentioned studies available in
the scientific literature, the new methodological ap-
proach proposed in this paper mainly focuses on indi-
vidual critical industrial infrastructures (like energy
corridors for oil and gas supply, water, and waste
treatment plants). We utilize MFA and MFN (Funke
& Becker, 2020; Page & Wohlgemuth, 2010) to
model the underlying system. Also, we utilize a sim-
ilar methodology with (Kotzanikolaou et al., 2013;
Stergiopoulos et al., 2016, 2017) to model dependen-
cies between the different components of the modeled
system and assess the cascade risk due to possible dis-
ruptions considering an all-hazardous approach. Fur-
thermore, we model the suppliers of a critical indus-
trial infrastructures considering the dependencies to
external sources (i.e., CIs, other industries) and assess
the cascading impact due to such CI dependencies si-
milar to (Kotzanikolaou et al., 2013; Min et al., 2007;
Rinaldi et al., 2001; Stergiopoulos et al., 2016).
3 BUILDING BLOCKS
This engineering design methodology uses four buil-
ding blocks:
1) A method that models material, energy, and infor-
mational flows of production chains in critical in-
dustrial infrastructures into a material flow net-
work utilizing MFA principles.
2) A modeling algorithm that maps a material flow
network to a risk dependency graph to map flow
network components and their interdependencies
based on the industrial production chain.
3) A risk calculation methodology in which we esti-
mated the likelihood of a potential threat and its
impact(s) disrupting a CI system components.
4) A multi-risk dependency analysis methodology
for assessing the risk of the graph’s dependency
paths and the graph’s overall risk.
Εach building block is briefly presented below.
Towards Integrating Security in Industrial Engineering Design Practices
163
3.1 Material Flow Network Modelling
Our modeling approach is based on the principles of
MFA (Allesch & Brunner, 2015; Arampatzis et al.,
2016) and MFN (Funke & Becker, 2020; Page &
Wohlgemuth, 2010), which model processes and ma-
terial and energy flows in production chains. As such,
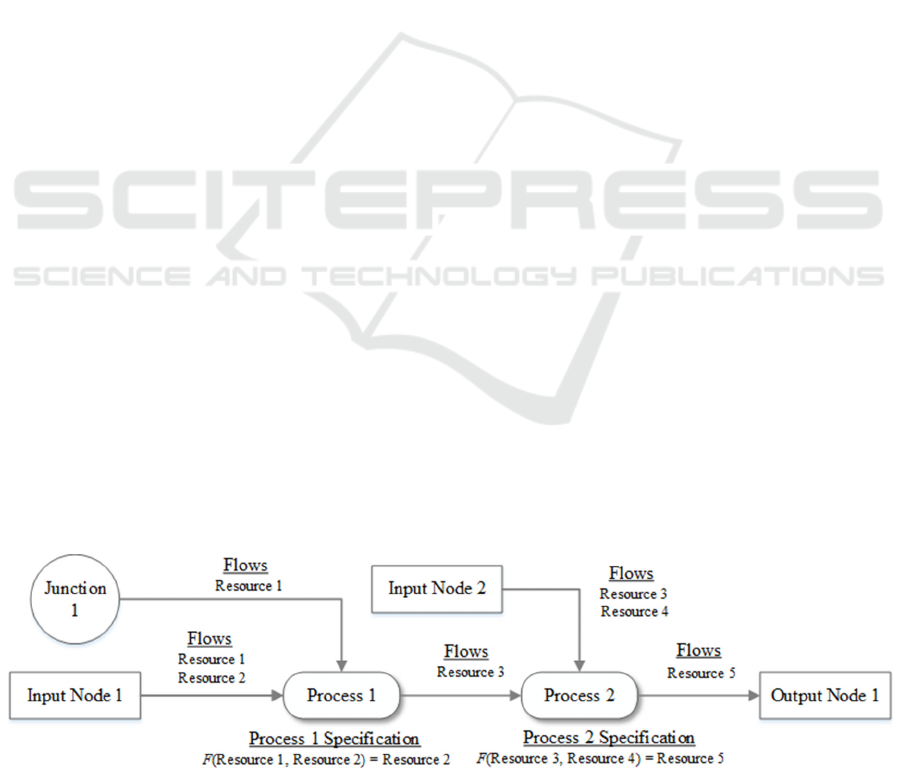
we model flow networks as graphs with four different
nodes: (i) processes, (ii) junctions, (iii) input, and (iv)
output nodes. These nodes are connected with links
(Figure 1). Processes represent single activities in
which resources (material, energy, and information)
are processed and transformed into other resources.
Input Nodes are the initial sources of resources flow-
ing towards processes and essentially represent dif-
ferent external resource suppliers (e.g., industries,
CI). In contrast, Output Nodes are the destination of re-
sources flowing from processes and represent different
external resource receivers (e.g., environment) or con-
sumers (e.g., industries, households, CI). Junctions
represent storage nodes for resources within the net-
work, connecting processes and acting as output nodes
for a process and input nodes for another process. Pro-
cesses and junctions for all intents and purposes repre-
sent the assets of the modelled infrastructure. Links
represent a way/transport mode by which resources can
flow between nodes (e.g., pipes, cables, roads, ships)
(Figure 1). Such flows between nodes describe the rate
at which resources are consumed (input flows) and pro-
duced (output flows). For modelling purposes, we
characterized input flows as regular or backup, deter-
mining the consumption lifecycle. Also, input or out-
put flows are assigned to the same link if they share the
same transport modes, thus having the same failure
probability due to transportation disruption.
A crucial step in the modeling procedure is the
specification of a process. This involves the definition
of the input and output resources and the relations be-
tween input and output flows. Processes are the prin-
cipal entities of flow-networks. They describe activi-
ties that require a set of resources (input) and, gen-
erate new or modified resources as output. In our
approach, as an exception to the previous rule, pro-
cesses can also describe industrial automation control
and monitoring activities of the system that supply
and receive monitoring and control data from and to
connected processes or junctions.
By utilizing the proposed methodology, we can
create a model representing an actual production sys-
tem of a CI. If all processes are specified accurately
and, more importantly, the actual dependencies be-
tween them are also defined, then and only then we
can have a holistic view of the system and under-
standing of the interactions and dependencies be-
tween the physical elements of the production chain
to be able to assess the cascade risk due to a disruption
to a flow network node regardless of the type of
threat. By analyzing the cascading risk of each flow
network node, we can evaluate the overall CI risk.
3.2 Risk Dependency Graph
To analyze and assess the flow network nodes’ risk
and evaluate the infrastructures overall risk, we need
to map all material flow network nodes (input, output,
junction, process nodes) as possible failure nodes,
along with all the flows and dependencies between
them, into a risk dependency graph. In the case of
multiple flows between a pair of nodes, a single de-
pendency is mapped. The created graph models the
flow of resources as input and output dependencies
from one possible failure node to another.
Dependencies are modelled in directed, weighted
graphs 𝐺=(𝑉,𝐸), where the nodes 𝑉 represent the
possible failure nodes of the flow network system and
edges 𝐸 represent the dependencies between them.
The weight of each node (i.e., process, junction, in-
put/output node) quantifies the estimated dependency
risk of flow network node B on resources provided by
flow network node A. This weight derives from the
dependency between the flow network nodes. Weight
calculation is presented below in Section 3.3.
We focus on external/internal risks in input
resource supply, along with asset availability risks.
Figure 1: Graphical representation of an example material flow network.
SECRYPT 2021 - 18th International Conference on Security and Cryptography
164

Such risks arise from malicious, natural, or accidental
events. These high-impact events are unexpected, can
cause a severe dysfunction of an internal process or
the supply of a resource, and, more importantly, they
can propagate down the production chain.
Similarly, with (Adenso‐Diaz et al., 2012), we do
not differentiate between disruption types but rather
consider disruptions in general and their affect in the
production line. Each node in the flow network is ei-
ther entirely disrupted or fully operational. This bi-
nary approach is a typical way to model disruption of
resources supply (Snyder et al., 2016), while it can be
used to simulate disruptions in the field of CIP (Eid
& Rosato, 2016).
3.3 Risk Calculation
We calculate the risk of disruption for each possible
failure node in the risk dependency graph. The stand-
ard reference of risk as a cybersecurity assessment
metric is the following Eq. 1 and Eq. 2:
Risk = Likelihood ∗ Impact
(1)
Likelihood = Threat ∗ Vulnerabilit
y
(2)
To calculate the risk, we must first calculate the
likelihood and impact values for each possible failure
node in the modeled risk dependency graph. The like-
lihood calculation and impact evaluation are thor-
oughly discussed in the following subchapters.
3.3.1 Likelihood Calculation
In this stage, we calculate and assign a likelihood
value to each node of the mapped risk dependency
graph, based on the initial flow network model flows.
This value depicts the probability that a threat can dis-
rupt a flow network node (i.e., process, junction, in-
put/output node), either by obstructing its activity or
disrupting the supply of one or more required re-
sources. A flow network node 𝑁 can have two states:
either disrupted (𝑁) or functional (𝑁
); similarly, an
input resource R is either absent (𝑅) or available (𝑅
).
For a single node 𝑁 with required resources R, the
probability of state n when resources are in the state
𝑠 is 𝑃
(
𝑛
|
𝑠
)
, and it must hold that
∑
𝑃
(
𝑛
|
𝑠
)
≤1
for
every instantiation/state of u. The probability 𝑃
(
𝑛
|
𝑠
)
is called risk parameter, and with binary state, there
are 2
parameters to be defined for a flow network
node with n input resources.
To evaluate the relationship of these disruptions
between network flow nodes and input resources, we
utilize a noisy-OR model (Pearl, 1988) similar to
(Käki et al., 2015; K. Zhou et al., 2016). The Noisy-
OR model assumes independence of causal influ-
ences among a flow network node and its required in-
put resources (Pearl, 1988). This assumption provides
a logarithmic reduction in the number of parameters
required; for a flow network node with n input resour-
ces, there are 𝑛+1 independent parameters. By min-
imizing the number of network parameters, we im-
prove the implementation process for real-world ap-
plications. This way, we reduce the computational
and modeling challenges that MFA models introduce.
For network flow graph 𝐺 with 𝑁 nodes and 𝐸
edges/transfer links, we define the probability 𝑏
|
that reflects the chance of disruption to cascade bet-
ween a node 𝑖 and a node 𝑗, the probability 𝑎
,∀𝑖∈
𝑁 that reflects the chance of disruption in each node
individually due to malicious or accidental activity,
and the likelihood 𝐿
,∀𝑖∈𝑁 that reflects the chance
of disruption due to the lack or not of a required re-
source from one or more internal or external supplier
node. Therefore, to calculate the likelihood 𝐿
of a
flow network node we utilize the following formula
Eq. 3 based on the noisy-OR model.
𝐿
=𝑃
(
𝑥
|
𝑢
)
∀
(3)
For nodes without input resources (e.g. input
nodes), we have 𝐿
=𝑎
. The availability of an input
resource depends on the supplier flow network nodes.
To that end, we define the likelihood 𝐿𝑅
that reflects
the availability probability of an input resource 𝑖. In
case the supplier flow network nodes share the re-
source demand through regular flows we utilize Eq. 4
to calculate the likelihood of a resource.
𝐿𝑅
=𝑃
(
𝑦
|
𝑣
)
∀
(4)
For example, the calculation of the likelihood 𝐿𝑅
for an input resource 𝑅 of a process node 𝑃 that it is
supplied from two flow network nodes
{
𝑁1,𝑁2
}
with
regular flows is shown in Table 1.
If resource 𝑎 has several backup flows 𝐵
and a
likelihood value 𝐿𝑅
due to regular flows the final
likelihood value 𝐹𝐿𝑅
for that resource is calculated
in Eq. 5:
𝐹𝐿𝑅
=
𝐿𝑅
𝐵
+1
(5)
Table 1: Resource with regular flows likelihood calculation
example.
States 𝒖 𝑷
(
𝑹|𝒖
)
𝑢
={𝑁1
,𝑁2
}
(1−𝑎
)(1 − 𝑎
)𝑏
|
𝑏
|
𝑢
={𝑁1
,𝑁2}
(1−𝑎
)𝑎
𝑏
|
𝑢
={𝑁1,𝑁2
}
𝑎
(1 − 𝑎
)𝑏
|
𝑢
={𝑁1,𝑁2}
𝑎
𝑎
Towards Integrating Security in Industrial Engineering Design Practices
165

3.3.2 Impact Evaluation
Each modeled flow network node is assigned an im-
pact value. This metric depicts the magnitude of harm
due to the loss of availability, integrity of a process,
or storage (junction) - including the delivery/supply
of required resources. The loss of a CI asset due to an
accidental or intentional incident affects all depend-
ent CI assets in the production chain, thus the system
availability and integrity. In many cases, a compro-
mised CI asset could result in significant loss of life,
casualties, material harm, environmental damage, and
public service disruption.
We developed a rating scale to evaluate the sever-
ity of each impact and assign a value to each node
(Table 2). Since modeled flow network nodes repre-
sent critical industrial infrastructure assets, the quali-
tative criteria used for the development of this scale
are based on the "European Scale of Industrial Acci-
dents" (EU/JRC, 2013) and the "Seveso Directive"
(Cherrier et al., 2018). Concerning material and envi-
ronmental damage, the level of impact is calculated
using a logarithmic scale, and human consequences,
production loss, and public disruption were approxi-
mated using the "European Scale of Industrial Acci-
dents" (EU/JRC, 2013).
As a general guide for system disruption impact
evaluation, experts must consider the number of de-
pendent CI assets and the importance of the produced
resources. By utilizing an impact scale, we enable ex-
perts to evaluate CI assets’ impact based on their ex-
perience and knowledge.
3.4 Dependency Risk Analysis
Potential disruption to CI asset is transferred from the
previous connection to the next, where the disturb-
ance of a required input resource, regardless of the
cause, may propagate to the dependent CI assets/
components in the production chain.
To calculate and assess the n
th
-order cascading
risks propagated in a series of components, we use the
following method that utilizes a recursive algorithm
based on (Kotzanikolaou et al., 2013; Stergiopoulos
et al., 2016). Given 𝐴
→𝐴
→⋯→𝐴
is an nth-or-
der dependency between n connected components,
with weights 𝑅
,
=𝐿
,
𝐼
,
corresponding to
each 1
st
-order dependency of the path, then the cas-
cading risk exhibited by 𝐴
for this component de-
pendency path is computed using Eq. 6:
𝑅
,…,
=(𝐿
,
)𝐼
,
(6)
The cumulative dependency risk is the overall risk
exhibited by all the components in the sub-chains of
the nth-order dependency. If 𝐴
→𝐴
→⋯→𝐴
is
a chain of CI asset dependencies of length n then the
cumulative dependency risk, denoted as 𝐶𝑅
,…,
, is
defined as the overall risk produced by an n
th
-order
dependency Eq. 7.
𝐶𝑅
,…,
=(𝐿
,
)
𝐼
,
(7)
Eq. 7 assess the overall dependency risk as the
sum of the dependency risks of the affected nodes in
the chain due to a disruption realized in the source
node of the dependency chain.
Finally, using the total
number 𝑛 of all asset sub-chains (possible CI asset
dependency paths) and their cumulative dependency
risks, the methodology calculates the graph’s overall
risk 𝐺
as the sum of the cumulative dependency risk
for each nth-order dependency in the graph Eq. 8.
𝐺
=𝐶𝑅
,…,
(8)
4 ALGORITHM
The presented approach utilizes numerous methods
to achieve its goals. Each step of the presented
methodology utilizes a set of mapping procedures
Table 2: Impact rating scale developed based on the European Scale of Industrial Accidents.
Impact
Value
System Activity Disruption Deaths Injuries
Material
Dama
g
e(€)
Environmental
Dama
g
e (€)
Public Service
Disru
p
tion
5
Significant impact on overall
functionalit
y
>100 >1000 >1,000,000 1,000,000 >1 month
4 Some im
p
act in ke
y
functions 11-100 101-1000 100,001-1,000,000 100,001-1,000,000 1 week to 1 month
3
Minor impact on overall
functionalit
y
0-10 11-100 10,001-100,000 10,001-100,000 1 day to 1 week
2
Minor impact on secondary
functions
0 1-10 1-10,000 1-10,000 >1 day
1 No change in functionality 0 0 0 0 0
SECRYPT 2021 - 18th International Conference on Security and Cryptography
166

and algorithms. Each one provides insight into the CI
production chain under analysis and outputs infor-
mation to be used as input by the following step. This
process uses three fundamental steps:
Step 1: Material Flow Modeling. We identify and
input a critical industrial infrastructure’s assets, sup-
pliers and resource receivers, and the external or in-
ternal resource/material flows.
The model is constructed into a material flow net-
work (graph) that exhibits the CI production chain.
Step 2: Dependency Modeling. We map the previ-
ously produced material flow network into a risk de-
pendency graph. Also, we assess the risk of disruption
for each CI asset based on the initial material flow
network.
Step 3: Dependency Risk Analysis. The algorithm
pre-computes all n-order dependencies using the asset
dependency graph. Then for each dependency chain,
outputs the cumulative dependency risk of each dis-
ruption path. Finally, the algorithm calculates the
overall risk of the organization’s connected assets
(i.e., the entire network/graph risk).
5 EXPERIMENTS
To demonstrate the applicability and validate this ap-
proach, we developed a tool and modeled a part of the
production chain corresponding to Liquefied Petro-
leum Gas (LPG) purification of an actual oil refining
plant. We assess the flow network under a high-risk
scenario, thereby establishing a baseline model. Next,
we employ selected risk mitigation actions by altering
and modifying the baseline network flow model, thus
creating a redesigned model. We assess the new mo-
del and compare the results. Our aim here is not to
evaluate the high-risk scenario or the type of the ap-
plied risk mitigation measures but to evaluate whet-
her, and to what degree, our approach can indicate a
risk reduction solution. Finally, we compare and dis-
cuss the results.
5.1 Tool Implementation
The framework was developed as a distributed appli-
cation, including a desktop application and a web ap-
plication. The desktop main application front-end and
back-end are developed and implemented in the .NET
framework using C#. The main application handles
the modeling functionalities and the preliminary risk
analysis. The web application back-end is developed
in Java Spring using the Neo4j graph (“Neo4j Graph
Database,” 2000) and handles the risk dependency a-
nalysis. The desktop application front-end is commu-
nicating and interacting with the web application
back-end through an application programming inter-
face (API).
5.2 Industrial CI Testbed
The critical infrastructure understudy corresponds to
a typical Liquefied Petroleum Gas (LPG) purification
unit encountered in all oil-refinery industries (Ba-
hadori, 2014). Liquefied LPG, a mixture of liquefied
hydrocarbon gases C3-C4 (propane and butane), is a
valuable energy carrier with numerous industry and
transportation uses. It is a by-product of many refin-
ery processes, such as Crude Distillation (CDU), Hy-
drocracking (HYC), Fluid Catalytic Cracking (FCC),
and Platformer. After the production process, some
impurities remain in the LPG that need to be removed
(purification). The main purification processes corre-
spond to (i) the removal of Naphtha (C5 and above)
in debutanizer columns, (ii) the removal of ethane in
Deathanizer columns (simple distillation column that
separates components based on their boiling point),
and (iii) the removal of sulfur compounds like hydro-
gen sulfur (H2S) and mercaptan (CH4S) in Amine
Absorber Units (AAU). The material flow network
model used in this study has been motivated by a real
oil-refinery located in Western Asia, restructures to
be representative of any typical LPG purification unit.
For security considerations, the company name and
all related data and component names were anony-
mized and sanitized.
5.3 Baseline Model
We identify 21 internal processes, 3 internal juncti-
ons, 4 internal inputs, and 1 external input for the part
of the production line under study. Tables 3 and 4 dis-
play the flow network nodes and their respective flo-
ws. Flow network nodes depicted use generic terms
and IDs in the examples below. The tool automatical-
ly maps the material flow network into a risk depend-
ency graph (Figure 2). Each material flow network
node and its respective input and output flows is used
to model the asset dependency graph.
To assess the flow network model under a high-
risk scenario, we choose a baseline failure rate (inde-
pendent disruption probability) of 40% (𝑎
=0.4)
common to all components, and a possibility of a dis-
ruption to cascade between a node 𝑖 to a node 𝑗 is
80% (𝑏
|
=0.8), common to all links. These values
are chosen at the beginning of the modeling process
and is fixed on a median taken from historical data.
Towards Integrating Security in Industrial Engineering Design Practices
167

Based on that, we calculate the likelihood of dis-
ruption of each node in the dependency graph (see Ta-
ble 3) based on the method proposed in section 3.3.1.
Also, we assigned the impact values of each node
(see Table 3) based on the methodology proposed in
section 3.3.2 and information provided by the com-
pany. For example, CDU Debutanizers get a high im-
pact value because their operation considerably af-
fects the production process, and potential destruction
can cause significant damages due to the flammable
materials being processed. On the other hand, the
LPG transfer pump gets a low impact value because
it has a minor effect on the production process, and a
potential accident can cause a limited extent of dam-
ages. The calculated risk of the first order dependen-
cies is depicted in Table 4; we should note here that
in this model, each resource flow corresponds to one
dependency.
Table 3: Flow network nodes with impact-likelihood
values.
Flow Network Nodes ID Impact Likelihood
Debutanizer A1 P1 4 0.76
Debutanizer A2 P2 4 0.76
Debutanizer A3 P3 4 0.76
Debutanize
r
B1 P4 4 0.76
Amin Su
pp
l
y
I1 4 0.40
LPG Production A I2 4 0.40
LPG Production Unit B I3 4 0.40
LPG Production Unit C I4 4 0.40
Energy Gri
d
I5 4 0.40
Debutanize
r
B2 P5 4 0.76
Debutanizer B3 P6 4 0.76
Debutanizer B4 P7 4 0.76
Deethanizer B3 P8 3 0.82
Deethanizer B4 P9 3 0.82
AAU 1 P10 3 0.84
AAU 2 P11 3 0.88
AAU 3 P12 3 0.88
AAU 4 P13 3 0.88
AAU 5 P14 3 0.88
AAU 6 P15 3 0.88
LPG Out
p
ut O1 4 0.32
LPG Transfer Pum
p
P16 1 0.76
Monitor & Control P17 5 0.40
Debutanize
r
B5 P18 4 0.76
Debutanizer C1
P19 5 0.76
Debutanizer C2
P20 5 0.76
Tank 1 S1 5 0.40
Tank 2 S2 5 0.40
Tank 3 S3 5 0.40
Transfer Pump 1 P21 1 0.76
Table 4: Resources flows with 1-order dependency risks.
Source Destination Resource Risk
I1
P10, P11, P12, P13,
P14, P15
DEA 1.6
I2 P1, P2, P3 LPG+C5+H2S 1.6
I3 P4, P5, P6, P7, P18 LPG+C5+H2S 1.6
I4 P19, P20 LPG+C5+H2S 1.6
I5
P1, P2, P3, P4, P5,
P6, P7, P8, P9, P10,
P11,P12, P13, P14,
P15, P16, P17, 18,
P19, P20, P21
Electricity 1.6
P1 S1 LPG+H2S 3.05
P10 S3 LPG 2.52
P11 S3 LPG 2.63
P12 S3 LPG 2.63
P13 S3 LPG 2.63
P14 S3 LPG 2.63
P15 S3 LPG 2.63
P16 O1 LPG 0.76
P17
P
13, P3, P1, P18, P6,
P
20, P2, P12, P5, P4,
P
16, P10, S2, P21, P8,
P
15, S3, P14, S1, P11,
P
7, P19, P9
Monitor &
Control Data
2
P18 P15 LPG+H2S 3.05
P19 S2 LPG 3.81
P2 S1 LPG+H2S 3.05
P20 S2 LPG 3.81
P21 S3 LPG 0.76
P3 S1 LPG+H2S 3.05
P4 P14 LPG+H2S 3.05
P5 P13 LPG+H2S 3.05
P6 P8 LPG+H2S 3.05
P7 P9 LPG+H2S 3.05
P8 P11 LPG+H2S 2.46
P9 P12 LPG+H2S 2.46
S1 P10 LPG+H2S 2
S2 P21 LPG 2
S3 P16 LPG 2
Finally, the tool computed the complete set of risk
paths on the risk dependency graph. Paths have an or-
der not greater than 6 (Table 5). In this case, depicted
paths correspond to flows from different processes in-
side the industry. The list below depicts the top 10
highest risk dependency paths according to each
one’s total cumulative risk.
Thirty network flow nodes produced more than
444 dependency chains with orders ranging from two
to six and with potential risk values between 0.76 and
7.84. System engineers and security experts can use
this step’s output to identify system components with
potential risk above a specified threshold value. The
threshold parameter is subjective; a decision-maker
SECRYPT 2021 - 18th International Conference on Security and Cryptography
168
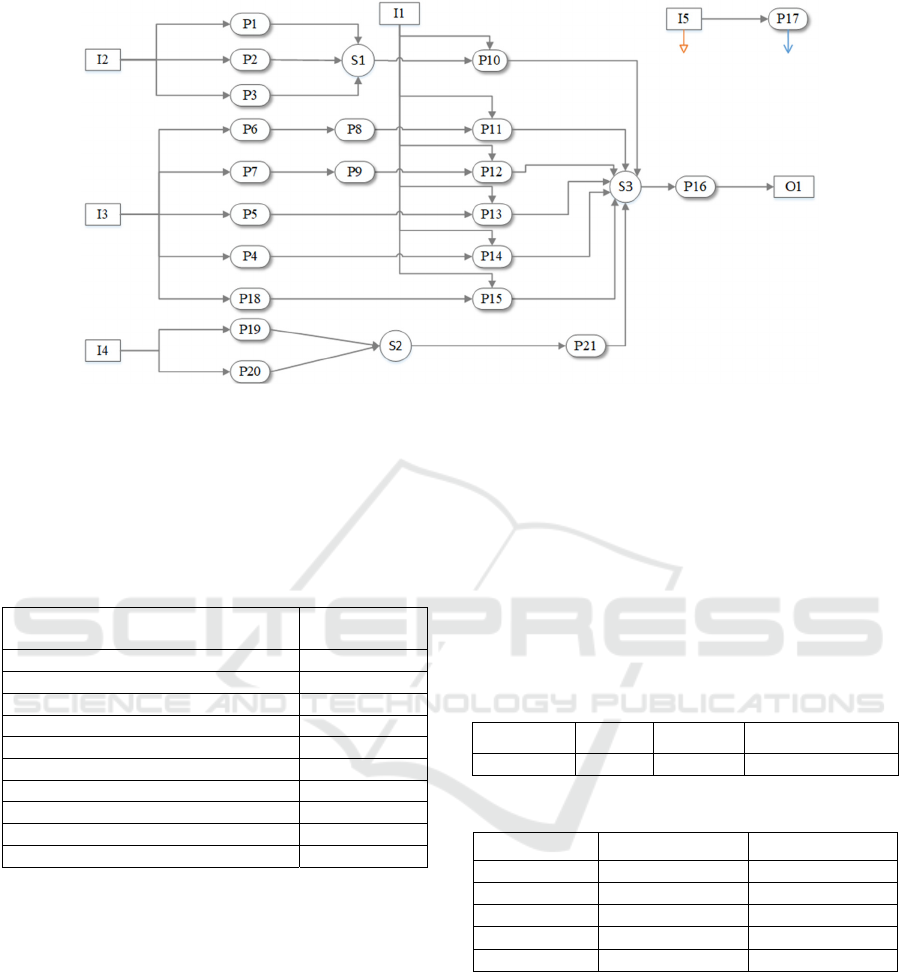
Figure 2: Tool graphical representation of the produced dependency graph (dependencies for nodes I5 and P17 have been
excluded for clarity reasons).
can define it based on the critical industrial infrastruc-
ture-under-assessment or under-design specific char-
acteristics.
Table 5: Top 10 flow network node dependency paths out-
put from the risk analysis step (ascending).
Dependency Paths
Overall Path
Risk
P7 P9 P12 S3 P16 O1 7.84
P6 P8 P11 S3 P16 O1 7.84
P7 P9 P12 S3 P16 7.67
P6 P8 P11 S3 P16 7.67
P18 P15 S3 P16 O1 6.6
P4 P14 S3 P16 O1 6.6
P5 P13 S3 P16 O1 6.6
P7 P9 P12 S3 6.58
P6 P8 P11 S3 6.58
P18 P15 S3 P16 6.4
5.4 Redesigned Model
Our primary goal here is to reduce the risk of the
worst dependency path and improve the overall graph
risk. To achieve this, we can either add or remove flo-
ws or network nodes to directly affect risk; a common
design decision in flow networks engineering.
However, it is not easy to justify changes. If we re-
move nodes or flows to reduce risk, we must be sure
that factory production is unaffected. For example, if
we took away all nodes, we would not have risk, but
the critical infrastructure wouldn’t fulfill its purpose.
For this proof-of-concept, we decided to present
the safest design process available, i.e. to add backup
flows και nodes for risk mitigation. To that end, we
introduce one process node and five additional flows
to the baseline flow network model. Tables 6 and 7
display the added flow network node and flows. The
added process node corresponds to an electricity gen-
erator that acts as a backup solution for the operation
and control process. All the added flows are marked
as a backup decreasing the probability of disruption
for the resource/material they are backing up without
creating an immediate dependency.
Table 6: Backup flow network nodes and node ID associa-
tion with its respective impact and likelihood values.
CI Asset ID Impact Likelihood
Generato
r
P22 1 0.4
Table 7: Backup flows and their respective resources.
Source Destination Resource
I2 P6 LPG+C5+H2S
I4 P7 LPG+C5+H2S
P7 P8 LPG+H2S
P6 P9 LPG+H2S
P22 P17 Electricit
y
The tool produces the risk dependency graph based
on the redesigned flow network and calculates each
node’s risk using the same probabilities of independ-
ent disruptions and disruptions to cascade under the
same risk scenario as the baseline model. Finally, uti-
lizing the risk dependency graph, the tool computes
the complete set of risk paths on the risk dependency
graph (Table 8). Thirty-one asset nodes produced mo-
re than 444 dependency chains with orders ranging
from two to six and with potential risk values between
0.76 and 6.88.
Towards Integrating Security in Industrial Engineering Design Practices
169

Table 8: Top 10 CI flow network nodes dependency paths
output from the risk analysis step (ascending) after the ap-
plied mitigation controls.
Dependency Paths
Overall
Path Risk
P7 P9 P12 S3 P16 O1 6.88
P6 P8 P11 S3 P16 O1 6.88
P7 P9 P12 S3 P16 6.74
P6 P8 P11 S3 P16 6.74
P18 P15 S3 P16 O1 6.6
P4 P14 S3 P16 O1 6.6
P5 P13 S3 P16 O1 6.6
P5 P13 S3 P16 6.4
P18 P15 S3 P16 6.4
P4 P14 S3 P16 6.4
5.5 Discussion
The redesigned model produced an overall graph risk
of 1298 with an average risk per dependency path of
2.92, while the baseline model produced an overall
graph risk of 1404 with an average dependency path
risk of 3.16. Based on the above results, the rede-
signed model performs 7.5% better than the baseline
in terms of risk. The applied risk mitigation measures
reduced the risk of the worst dependency path by over
12%. Also, introducing an additional process with a
backup flow in the redesigned model did not increase
the number of produced dependency paths. From our
experiments, if the risk mitigation measures include
the addition of a process with regular flows (i.e., a
flow that transfers resources continuously from par-
ent to target node), the number of the dependency
paths increases exponentially. There is a trade-off be-
tween adding processes or junctions to reduce the o-
verall graph risk and introducing unnecessary comp-
lexity by increasing the dependency paths.
From a cybersecurity perspective, the operation
and control processes/systems are crucial, as they are
more open and more vulnerable to cyber-attacks due
to existing vulnerabilities (Johansson et al., 2009;
Miller & Rowe, 2012). We observed that the monitor
and control process is not part of any high-risk de-
pendency path. The reason for the low-risk values for
the operation and control process is that all the flow
network entities (i.e., process, junction, input, output
node) share the same independent probability of dis-
ruption. A future consideration to overcome this is to
define the disruption probabilities individually based
on each flow network node specific characteristics.
Overall, the methodology successfully identified
the reduction in the overall risk of the redesigned mo-
del, proving that the limited risk mitigation measures
that we applied reduced the overall graph risk and the
risk of the worst dependency path.
6 CONCLUSIONS
In this work, we propose a risk-based dependency
method focusing on the individual system compo-
nents to analyse disruptions in critical industrial in-
frastructures. The proposed approach can model a
critical industrial infrastructure’s underlying assets
and the interactions between them as a material flow
network providing a holistic view of the system and a
better understanding of dependencies between the
production chain’s physical elements. The methodol-
ogy and the developed tool can assess the risk of dis-
ruptions due to accidental or intentional events and
produce weighted risk dependency graphs, presenting
how a disruption in one component may affect other
dependent components. Preliminary tests in a part of
the production line of an existing critical industrial in-
frastructure show that the presented approach is ef-
fective and trustworthy.
Our approach supports the proactive study of crit-
ical industrial infrastructures with large-scale produc-
tion chain dependency scenarios advancing the con-
cept of security-by-design in critical infrastructure
protection. In particular, the tool helps engineers, se-
curity experts, and decision-makers to assess depend-
ency risks before a threat is realized. Users can iden-
tify potential hotspots and project their cascading ef-
fects by analysing the complete set of potential de-
pendency paths. By identifying potential hotspots,
they can apply countermeasures early in the project
lifecycle, during the design stage, improving system
reliability and resilience.
Also, a user can identify and target specific nodes
to make them more reliable or improve their resili-
ence. In this way, it is possible to evaluate various al-
ternate mitigation measures and provide convincing
arguments about the expected benefits. Users can also
model and compare different designs for particular
system specifications, thus creating alternate scenar-
ios. This allows for a what-if analysis based on secu-
rity criteria besides cost-effectiveness and demand
management criteria that system designers and engi-
neers ordinarily use.
6.1 Restrictions and Future Work
The presented approach has certain limitations. It ap-
plies only to critical industrial infrastructures, thus
not covering the whole spectrum of CI activities. Sim-
ilar to other empirical risk approaches that analyse de-
pendencies, it relies on previous risk assessments and
expert knowledge on related industries and physical
components to evaluate impact. Also, while this ap-
proach can identify paths and flow network nodes as
SECRYPT 2021 - 18th International Conference on Security and Cryptography
170

high-risk items, it is challenging to decide the right
mitigation measures to reduce those risks. Choosing
to add flows and flow network nodes to address risk
increases the number of dependency paths and the
overall flow network risk; on the other hand, remov-
ing flows and flow network nodes certainly reduces
risk but affects the system's production capacity.
Future work will focus on analysing dependency
paths and specifying dependencies for applying miti-
gation controls to reduce overall network risk. It
would also be beneficial for engineers and security
officers to provide indicative solutions for risk miti-
gation to reduce the overall system risk. Also, future
work should concentrate on overcoming the require-
ment for previous risk assessments.
ACKNOWLEDGMENTS
This work has been partially supported by a grant
(“Research in the Cybersecurity Domain: National
Cybersecurity Strategy 2020-25”) awarded to the Re-
search Centre of the Athens University of Economics
& Business (RC/AUEB). Authors express their since-
re appreciation to the Ministry of Digital Governance
of Greece.
REFERENCES
Adenso‐Diaz, B., Mena, C., García‐Carbajal, S., & Liechty,
M. (2012). The impact of supply network characteris-
tics on reliability. Supply Chain Management: An Inter-
national Journal, 17(3), 263–276.
Adepu, S., Palleti, V. R., Mishra, G., & Mathur, A. (2020).
Investigation of Cyber Attacks on a Water Distribution
System. In J. Zhou, et al. (Eds.), Applied Cryptography
and Network Security Workshops, 274–291, Springer.
Allesch, A., & Brunner, P. H. (2015). Material Flow Anal-
ysis as a Decision Support Tool for Waste Manage-
ment: A Literature Review: MFA for Waste Manage-
ment. Journal of Industrial Ecology, 19(5), 753–764.
Ani, U., Mc Watson, J., Nurse, J., Cook, A., & Maples, C.
(2019). A review of critical infrastructure protection ap-
proaches: Improving security through responsiveness to
the dynamic modelling landscape. Living in the Internet
of Things, 6 (15 pp.)-6 (15 pp.).
ANSI/ISA-62443. (2020). ANSI/ISA-62443-3‑2-2020, Se-
curity for industrial automation and control systems,
Part 3‑2: Security risk assessment for system design.
International Society of Automation.
Arampatzis, G., Angelis-Dimakis, A., Blind, M., & Asima-
copoulos, D. (2016). A web-based Toolbox to support
the systemic eco-efficiency assessment in water use sy-
stems. Journal of Cleaner Production, 138, 181–194.
Axelsson, J., & Kobetski, A. (2018). Towards a risk analy-
sis method for systems-of-systems based on systems
thinking. 2018 Annual IEEE International Systems
Conference, 1–8.
Azzini, I., Dido, M., Giannopoulos, G., & Galbusera, L.
(2018). GRRASP: Version 3.1: User manual. Publicati-
ons Office.
Bahadori A. (2014). Liquefied Petroleum Gas (LPG) Re-
covery. Bahadoni A. (Eds.), Natural Gas Processing,
547-590, Gulf Professional Publishing.
Bakirtzis, G., Ward, G., Deloglos, C., Elks, C., Horowitz,
B., & Fleming, C. (2020). Fundamental Challenges of
Cyber-Physical Systems Security Modeling. 2020 50
th
Annual IEEE-IFIP International Conference on De-
pendable Systems and Networks, 33–36.
BS ISO/IEC 27001 (2013). Information Technology-Secu-
rity Techniques-Information Security Management Sy-
stems-Requirements. BSI.
Cavoukian, A., & Dixon, M. (2013). Privacy and security
by design: An enterprise architecture approach. Infor-
mation and Privacy Commissioner of Ontario, Canada.
Chen, Y., He, L., Li, J., & Zhang, S. (2018). Multi-criteria
design of shale-gas-water supply chains and production
systems towards optimal life cycle economics and gre-
enhouse gas emissions under uncertainty. Computers &
Chemical Engineering, 109, 216–235.
Cherdantseva, Y., Burnap, P., Blyth, A., Eden, P., Jones,
K., Soulsby, H., & Stoddart, K. (2016). A review of cy-
ber security risk assessment methods for SCADA sys-
tems. Computers & Security, 56, 1–27.
Cherrier, V., Corden, C., Calero, J., Mazri, C., & Quintero,
F. (2018). Review of the monitoring system under the
Seveso-III Directive, including the development of indi-
cators [Interim Report]. Wood.
Dwivedi, A. (2018). Implementing Cyber Resilient Designs
through Graph Analytics Assisted Model Based Sys-
tems Engineering. 2018 IEEE International Conference
on Software Quality, Reliability and Security Compan-
ion (QRS-C), 607–616.
Eckert, C., & Isaksson, O. (2017). Safety Margins and De-
sign Margins: A Differentiation between Intercon-
nected Concepts. Procedia CIRP, 60, 267–272.
Eid, M., & Rosato, V. (2016). Critical Infrastructure Dis-
ruption Scenarios Analyses via Simulation. In R.
Setola, et al. (Eds.), Managing the Complexity of Criti-
cal Infrastructures: A Modelling and Simulation App-
roach (pp. 43–61). Springer International Publishing.
EU/JRC. (2013). Corrosion‐related accidents in petroleum
refineries: Lessons learned from accidents in EU and
OECD countries. Publications Office.
Evaluation study of Council Directive 2008/114. (2020).
On the identification and designation of European crit-
ical infrastructures and the assessment of the need to
improve their protection. EU Publications.
Ferrario, E., Pedroni, N., & Zio, E. (2016). Evaluation of
the robustness of critical infrastructures by hierarchical
graph representation, clustering and Monte Carlo simu-
lation. Reliability Eng. & System Safety, 155, 78–96.
Filkins, B. (2020). Security by Design: A Systems Road
Map Approach. SANS.
Towards Integrating Security in Industrial Engineering Design Practices
171

Funke, T., & Becker, T. (2020). Complex networks of ma-
terial flow in manufacturing and logistics: Modeling,
analysis, and prediction using stochastic block models.
Journal of Manufacturing Systems, 56, 296–311.
Hossain, N., Jaradat, R., Marufuzzaman, M., Buchanan, R.,
& Rianudo, C. (2019). Assessing and enhancing oil and
gas supply chain resilience: A Bayesian network-based
approach. IIE Annual Conference, 241–246.
Hulse, D., Hoyle, C., Goebel, K., & Tumer, I. (2019). Quan-
tifying the Resilience-Informed Scenario Cost Sum: A
Value-Driven Design Approach for Functional Hazard
Assessment. Journal of Mechanical Design, 141(2).
ISACA. 2012b. (2012). COBIT 5: A business framework
for the governance and management of enterprise IT.
ISACA.
Jauhar, S., Chen, B., Temple, W., Dong, X., Kalbarczyk, Z.,
Sanders, W., & Nicol, D. (2015). Model-Based Cyber-
security Assessment with NESCOR Smart Grid Failure
Scenarios. 2015 IEEE 21
st
Pacific Rim International
Symposium on Dependable Computing, 319–324.
Johansson, E., Sommestad, T., & Ekstedt, M. (2009). Issues
of cyber security in SCADA-systems-On the impor-
tance of awareness. IET Conference Publications, 969–
969.
Käki, A., Salo, A., & Talluri, S. (2015). Disruptions in Sup-
ply Networks: A Probabilistic Risk Assessment Ap-
proach. Journal of Business Logistics, 36(3), 273–287.
Kobetski, A., & Axelsson, J. (2017). Towards safe and se-
cure systems of systems: Challenges and opportunities.
Proc. of the Symposium on Applied Computing, 1803–
1806.
Kotzanikolaou, P., Theoharidou, M., & Gritzalis, D. (2013).
Assessing n-order dependencies between critical infra-
structures. International Journal of Critical Infrastruc-
tures, 9(1/2), 93.
Miller, B., & Rowe, D. (2012). A survey SCADA of critical
infrastructure incidents. Proc. of the 1
st
Annual Confer-
ence on Research in Information Technology, 51.
Min, H.-S., Beyeler, W., Brown, T., Son, Y., & Jones, A.
(2007). Toward modeling and simulation of critical na-
tional infrastructure interdependencies. IIE Transacti-
ons, 39(1), 57–71.
Neo4j Graph Database. (2000). Neo4j Graph Database
Platform. https://neo4j.com/product/neo4j-graph-data-
base/
NIST SP 800-30. (2012). Guide for conducting risk assess-
ments (NIST SP 800-30r1). National Institute of Stand-
ards and Technology.
Page, B., & Wohlgemuth, V. (2010). Advances in Environ-
mental Informatics: Integration of Discrete Event Sim-
ulation Methodology with ecological Material Flow
Analysis for Modelling eco-efficient Systems. Proce-
dia Environmental Sciences, 2, 696–705.
Parfomak, P. (2007). Vulnerability of concentrated critical
infrastructure: Background and policy options.
Pearl, J. (1988). Probabilistic Reasoning in Intelligent Sys-
tems. Elsevier.
Rinaldi, S., Peerenboom, J., & Kelly, T. (2001). Identifying,
understanding, and analyzing critical infrastructure in-
terdependencies. IEEE Control Systems, 21(6), 11–25.
Rizki, Z., Janssen, A., Claassen, G., Boom, R, van der Padt,
A. (2020). Multi-criteria design of membrane cascades:
Selection of configurations and process parameters. Se-
paration and Purification Technology, 237, 116349.
Setola, R., Luiijf, E., & Theocharidou, M. (2016). Critical
Infrastructures, Protection and Resilience. In R. Setola,
et al. (Eds.), Managing the Complexity of Critical In-
frastructures: A Modelling and Simulation Approach,
1–18, Springer.
Snyder, L., Atan, Z., Peng, P., Rong, Y., Schmitt, A., &
Sinsoysal, B. (2016). OR/MS models for supply chain
disruptions: A review. IIE Transactions, 48(2), 89–109.
Stergiopoulos, G., Kotzanikolaou, P., Theocharidou, M.,
Lykou, G., & Gritzalis, D. (2016). Time-based critical
infrastructure dependency analysis for large-scale and
cross-sectoral failures. International Journal of Critical
Infrastructure Protection, 12, 46–60.
Stergiopoulos, G., Kouktzoglou, V., Theocharidou, M., &
Gritzalis, D. (2017). A process-based dependency risk
analysis methodology for critical infrastructures. Inter-
national Journal of Critical Infrastructures, 13(2/3),
184.
Trucco, P., Petrenj, B., & Birkie, S. E. (2018). Assessing
Supply Chain Resilience upon Critical Infrastructure
Disruptions: A Multilevel Simulation Modelling Ap-
proach. In Y. Khojasteh (Ed.), Supply Chain Risk Man-
agement: Advanced Tools, Models, and Developments,
311–334, Springer.
Ylmaz, E. N., Ciylan, B., Gonen, S., Sindiren, E., & Kara-
cayilmaz, G. (2018). Cyber security in industrial cont-
rol systems: Analysis of DoS attacks against PLC and
the insider effect. 2018 6
th
International Istanbul Smart
Grids and Cities Congress and Fair, 81–85.
Zhou, K., Martin, A., & Pan, Q. (2016). The Belief Noisy-
OR Model Applied to Network Reliability Analysis. In-
ternational Journal of Uncertainty, Fuzziness & Know-
ledge-Based Systems, 24(06), 937–960.
SECRYPT 2021 - 18th International Conference on Security and Cryptography
172
