
Machine Learning-aided Automatic Calibration
of Smart Thermal Cameras for Health Monitoring Applications
Lelio Campanile
1
, Fiammetta Marulli
1
, Michele Mastroianni
1
, Gianfranco Palmiero
2
and Carlo Sanghez
2
1
Dipartimento di Matematica e Fisica, Universit
`
a degli Studi della Campania ”L. Vanvitelli”, Italy
2
GAM Engineering s.r.l., Italy
Keywords:
Smart Sensor Networks, Internet of Things, Machine Learning, Deep Learning, Health Monitoring, Covid-19
Disease, Mass Screening Infection, Clinical Evaluation.
Abstract:
In this paper, we introduce a solution aiming to improve the accuracy of the surface temperature detection in an
outdoor environment. The temperature sensing subsystem relies on Mobotix thermal camera without the black
body, the automatic compensation subsystem relies on Raspberry Pi with Node-RED and TensorFlow 2.x. The
final results showed that it is possible to automatically calibrate the camera using machine learning and that it
is possible to use thermal imaging cameras even in critical conditions such as outdoors. Future development
is to improve performance using computer vision techniques to rule out irrelevant measurements.
1 INTRODUCTION
Pandemics like COVID-19 put a strain both on medi-
cal field and technologies, while the medical world is
still racing against time to develop and deploy tests
and vaccines for novel variants of viruses, the in-
strumentation world cannot be far behind in efforts
to monitor and contain the spread of potential pan-
demics.
One of the consistent indicators of infection from
such viruses, as in the case of Covid-19, is high fever,
even if, several people are asymptomatic until tested
for that particular virus.
Automatic large-area detection and screening for
fever and viruses symptoms are required for the safety
of all and containment of not only the current COVID-
19 that is impacting us today but also as a prescrip-
tive measure of preparedness so we are not caught
unaware the next time around. Industry 4.0 technolo-
gies, with robotics or novel uses of thermal infrared
cameras, can offer an effective measure of support.
An infrared body temperature monitoring system
that is smart enough for covering large area monitor-
ing and detection, could play a strategic role in con-
trolling the spread of an epidemic and also improv-
ing awareness. Such a system should have an effec-
tive real- time alerting mechanism based on a tem-
perature range feature, the ability to track and raise
alarms at multiple points, miss no targets, identify
between human/animal/organic target and other high-
temperature objects, and use video/photographic im-
ages for monitoring and analysis.
More specifically, the COVID-19 pandemic emer-
gency has led to the implementation of temperature
screening in a wide variety of facilities. Although
temperature screening has been used in public set-
tings during previous infectious diseases outbreaks,
the usefulness of temperature screening to detect po-
tential infections has been questioned. However, tem-
perature screening may discourage symptomatic indi-
viduals from entering public places and may increase
comfort for healthy people.
Scientific studies, as the one provided in (Leach
et al., 2021), support that certain telethermographic
systems, also known as thermal imaging systems,
may be used to measure surface skin temperature.
This kind of systems includes an infrared thermal
camera and may have a temperature reference source
1
. Thermal imaging systems and non-contact infrared
thermometers (NCITs) use different forms of infrared
technology to measure temperature.
To the best of our knowledge the calibration of
thermal camera in outdoor environment is an open
topic, with no well-known solution. The use of artifi-
1
https://www.fda.gov/medical-devices/general-
hospital-devices-and-supplies/thermal-imaging-systems-
infrared-thermographic-systems-thermal-imaging-
cameras
Campanile, L., Marulli, F., Mastroianni, M., Palmiero, G. and Sanghez, C.
Machine Learning-aided Automatic Calibration of Smart Thermal Cameras for Health Monitoring Applications.
DOI: 10.5220/0010537803430353
In Proceedings of the 6th International Conference on Internet of Things, Big Data and Security (IoTBDS 2021), pages 343-353
ISBN: 978-989-758-504-3
Copyright
c
2021 by SCITEPRESS – Science and Technology Publications, Lda. All rights reserved
343

cial intelligence techniques to conduct effective self-
calibration could be a good technological advance-
ment to solve the problem presented.
The technology of radiometric cameras in
Mobotix technology, as well as that of all radiometric
cameras, requires periodic manual compensation and
does not need to be installed outdoors. Furthermore,
the technology is unable to distinguish a human face
and limits itself to indicating the hottest point in the
detection frame. The main objective discussed in this
work is to create a system that, being able to read the
data from the surrounding environment, is also able
to configure the camera without any human interven-
tion, implementing the compensation of the param-
eters necessary to obtain the best possible measure-
ment. Both Artificial Intelligence technologies and
IoT sensors and boards will be used in developing this
project. More specifically, the thermal camera cal-
ibration will be obtained from an inference process
performed on the data incoming from the field. For
the artificial intelligence subsystem, Google’s Tensor-
Flow framework will be used as the provider of an
end-to-end open source platform for performing deep
and machine learning tasks. In particular, the vari-
ous implementations of the platform will be used: the
Core implementation, for the development and train-
ing of machine learning models, able to run directly
from Jupyter notebooks on class processing units; the
Lite implementation, for deploying models on ARM
devices without needing of USB accelerators for edge
computing.
2 RELATED WORK
In (Leach et al., 2021) is provided a study that de-
scribes the experience of using noninvasive devices
for fever measuring with contact-less devices; the au-
thors evidenced that their study was not designed to
test the accuracy of devices, though temporal scan-
ners are widely considered reliable enough for pro-
fessional use. In their use, temperatures measured by
telethermographic systems were similar to those ob-
tained by temporal scanners, suggesting similar per-
formance. In this work, authors also evidenced the
main barrier to the massive employment of such so-
lutions, that is represented by the cost to implementa-
tion for telethermographic systems. Finally, their ex-
perience demonstrated that a telethermographic sys-
tem improves screening throughput and reports tem-
peratures similar to those recorded by temporal scan-
ners, with acceptable investment recovery time.
In (Sun et al., 2012) is also described a mass
screening method for the detection of patients with
suspected infectious diseases using a non-contact
screening system that can rapidly screen for the pres-
ence of an infection, within 10 s, based on monitored
vital signs such as facial skin temperature, heart rate,
and respiration rate.
In a later work (Sun et al., 2015) by the same
authors, the focus was shifted on designing proto-
type systems for measuring the vital-signs data and
developing the algorithms, including the linear dis-
criminant analysis, and neural network based self-
organizing maps (SOM) with non-linear classifiers
(k-means or fuzzy), for the classification of the de-
rived data. These latter have recently reported in
(Sun et al., 2016) the use of radar systems includ-
ing thermography for use in infectious disease screen-
ing at airports. In (Bardou et al., 2016) is described
a prospective study conducted to assess the value
of the use of infrared thermal cameras in detecting
fevers in both patients and healthcare workers be-
tween May 2015 and February 2016 in a university
hospital center in Southern France. In this study, the
MOBOTIX M15D infrared thermal camera and Ge-
nius 2 Tympanic Thermometer were employed for
measuring temperature. In this study, authors ob-
served that the environmental temperature had a direct
effect on threshold fever detection when infrared ther-
mal cameras are used. They also proposed a model
to correct this confounding factor. The best values
they obtained for sensitivity, specificity, positive and
negative predictive values was explained by the ther-
mal sensitivity of the infrared cameras, that were cali-
brated by taking into account gradients of temperature
in the surrounding environment before clinical appli-
cation.
In addition, in (Bardou et al., 2016) is discussed
the problem of the need of the frequent adjustments
for the measuring instrument. This activity is per-
formed by specialized technicians who refine the ac-
curacy of the measurement by acting on factors such
as the sensitivity to the emissivity of the bodies, the
environmental temperature and the presence or ab-
sence of absolute references such as a black body.
Furthermore, they observed that the calibration fre-
quency is directly proportional to the variation of the
environmental data that characterize the installations.
So, in high-traffic places, where it is mandatory to
interrupt the chain of viruses contagion, the absence
of stable and reliable conditions entails continuous
compensation. Finally, in outdoor paths, radiometric
cameras are evidently in fault, where distinguishing
hotter objects from people is hard, and consequently,
the false positives rate continuously increases.
In the current state of the art, Mobotix technol-
ogy thermometric cameras are unable to self-calibrate
AI4EIoTs 2021 - Special Session on Artificial Intelligence for Emerging IoT Systems: Open Challenges and Novel Perspectives
344

and do not incorporate all the environmental condi-
tions that characterize the installations. The installa-
tion constraints, moreover, are very strict: acclimati-
zation corridor with constant temperature and humid-
ity, reduced dynamic range, no outdoor, etc. These
are limits that prevent the use of these tools in those
situations such as the open field or where it is im-
possible to avoid significant temperature excursions,
or areas of light and shadows intended in the frame.
Furthermore, the measuring instrument is not able to
discard those areas which, although warmer, do not
cause concern: visitor’s head, hot objects, animals,
etc. Technological advancement would be of great
support in all those situations where it is impossible
to have a human operator who systematically checks
that the measurement error is acceptable or who sim-
ply discards false positives. Performing mass screen-
ing by the means of fever measuring using infrared
thermal cameras has been already used in the past
(Mercer and Ring, 2009), (Selent et al., 2013), as in
the case of SARS disease (Chiu et al., 2005).
The clinical effectiveness of mass screening by
fever estimation with contact-less devices has been
also discussed during the current pandemics and in
the past (Chiang et al., 2008), (Ghassemi et al., 2018)
recently been reported using an algorithm involving
heart and respiratory rate in order to detect respira-
tory infectious diseases.
In order to reach more effective and intelligent
surveillance and monitoring systems, thermal cam-
eras measurements should be combined with per-
sons identification task. Despite the great progresses
reached in image processing, also supported by re-
cent advances in deep learning techniques and Convo-
lutional Neural Networks algorithms (Sharma et al.,
2018), persons identification task is still an extremely
difficult problem, because of variables such as differ-
ent viewpoints and poses, and varying lighting in per-
son regions in images that have been captured from
remote distances. A majority of the studies have been
performed for visible-light camera-based person iden-
tification (P-ID), which can be used only in a limited
environment owing to the characteristics of a visible-
light camera that are considerably dependent on the
illumination. To overcome this problem, studies have
been conducted for multimodal camera-based per-
son P-ID. However, because two or more input im-
ages are required, the computational complexity was
high. In (Kang et al., 2019) is proposed a person P-
ID method that exploits convolutional neural network
(CNN) structure by combining visible-light and ther-
mal images as a single input. This method overcomes
the limitation of visible-light camera-based person P-
ID using both a visible-light and thermal camera.
3 THE PROPOSED
METHODOLOGY
The methodology we propose here bases on a solution
comprising of hardware and software components.
Hardware set consists of:
• a system for measuring the temperature based on
a Mobotix
2
thermal camera;
• a Raspberry Pi
3
for inference;
• a sensor that collects the environmental data;
• a Wi-Fi router for the connection between compo-
nents.
The software set includes:
• the TensorFlow
4
framework;
• the Node-RED
5
.
The strategy for collecting data used for training
the model is detailed in the next paragraph.
3.1 Data Collection Strategy
The temperature measurement was taken every ten
minutes without any compensation on the camera.
For each measurement thus collected, the operator
compensated the camera to reduce the error in the
measurement.
As it has shown in Figure 1, the camera has a
friendly user interface. Through this interface, the
operator can visualize the temperature value and the
whole set of raw values picked by the thermal sensor.
The thermal camera allows to compensate the
measurement by acting on the following values:
• the object emissivity (OE);
• the atmospheric transmission (TT);
• and the ambient temperature (TA).
A short explanation of these values is provided as fol-
lows:
• OE: it specifies the emissivity of the object as a
percentage.;
• TT: it specifies the transmission coefficient, as a
percentage, of the area between the object and the
camera. There;
• AT: it Specifies the temperature, in degrees Cel-
sius, of the area between the object and the cam-
era.;
2
https://www.mobotix.com/
3
https://www.raspberrypi.org/
4
https://www.tensorflow.org/
5
https://nodered.org/
Machine Learning-aided Automatic Calibration of Smart Thermal Cameras for Health Monitoring Applications
345
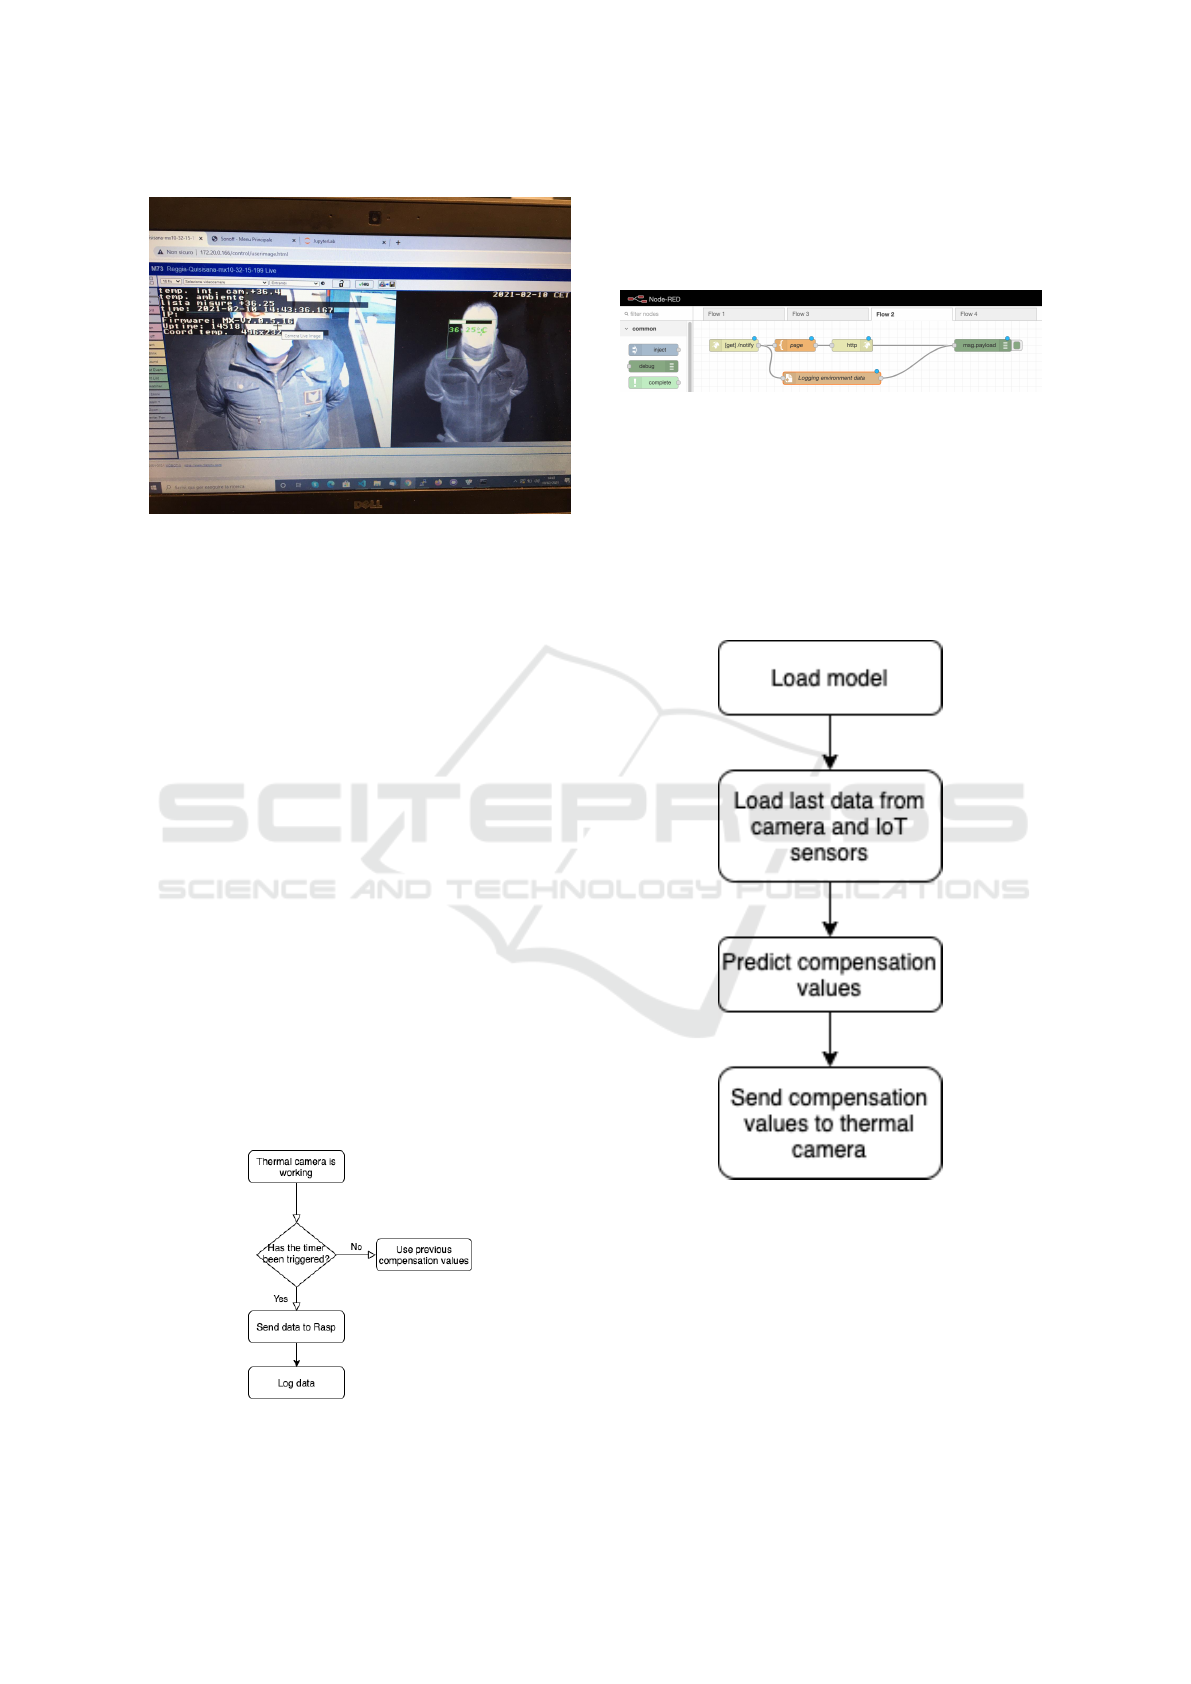
Figure 1: Capturing raw values.
Furthermore, for each measurement the system
recorded the compensation values (OE, TT, AT) and
environmental conditions.
The environmental data collected included: the lu-
minosity of the location, the ambient humidity, the
temperature near the camera, the temperature inside
the camera, the temperature along the path leading to
the camera, etc. These collected data represented the
data set for model training.
After data were collected, the model was trained
in order to reduce the error on the temperature mea-
surement. Once the desired performance level was
achieved, the model was loaded onto the RaspBerry
Pi and tested directly on the field.
3.2 The Algorithm
The adopted algorithm consists in a working loop that
can be described as follows: every 60 seconds the sys-
tem sends to the Raspberry Pi the internal and external
temperature of the thermal camera, the temperature
detected, the temperature of the current IoT sensors,
the date and time, the luminosity and the GPS coordi-
nates, as shown in Figure2.
Figure 2: Sending and Logging Data.
Figure 3 shows how the Raspberry Pi device runs
a Node-RED service which takes the data sent by the
thermal camera and persists it on a text file.
Figure 3: Node-RED flow.
Raspberry Pi runs a Python service which period-
ically reads the last line of the above file and extrap-
olates the measurement of the ambient temperature.
Finally, the same service predicts compensation val-
ues using the trained model. Additionally, the Rasp-
berry Pi runs a Python service whose aim is to read
IoT sensor data in raw format and decode them, as it
is shown in the flow diagram ( Figure 4).
Figure 4: Prediction and sending compensation values.
This algorithm, described in pseudo code way, is
pretty simple, as shown below.
Algorithm Input: environmental data, time, object
emissivity, atmospheric transmission.
Algorithm Output: object emissivity, atmospheric
transmission, ambient temperature.
AI4EIoTs 2021 - Special Session on Artificial Intelligence for Emerging IoT Systems: Open Challenges and Novel Perspectives
346

Algorithm Steps:
1 rea d a mb i ent _hu m idi ty from
Iot _se ns or ;
2 rea d a mbi ent _ tem p er a tur e from
IoT _se ns or ;
3 rea d a mbi ent _ lum ino s ity f ro m
the rma l _c a mer a ;
4 rea d time fr om t h erm al_ cam e ra ;
5 rea d c ame ra_ t emp era t ure f ro m
the rma l _c a mer a ;
6
7 ah = amb ien t _hu mid i ty ;
8 at = amb i ent _te m per atu r e ;
9 al = amb i ent _lu m ino sit y ;
10 ct = cam e ra_ tem p era tur e ;
11
12 loa d tra i ne d _m o del ;
13
14 com p en s ati o n_v alu e s = {0.0 , 0.0 ,
0. 0}
15 com p en s ati o n_v alu e s = tra ine d_m ode l (
ah , at , al , ct );
16
17 obj ect _ emi ssi v ity =
com p ens ati o n_v a lu e s [0 ];
18 atm o sph e ric _ tra n sm i ssi o n =
com p ens ati o n_v a lu e s [1 ];
19 amb i en t _te m per atu r e =
com p ens ati o n_v a lu e s [2 ];
20
21 ca me ra . s etC o mpe nsa tio n (
obj ec t_e missi vit y ,
atm osp her ic_ tra nsm iss ion ,
amb i ent _te m per a tu r e )
3.3 Code Snippets
The system includes IoT sensors that can be reached
through a normal HTTP connection. Each sensor
responds by directly providing its raw data in a
JSON format. Once the JSON format was reverse-
engineered, it was possible to retrieve only the infor-
mation of interest, as shown in the following listing
code: 1.
1 U RL = " http :// < I oT_ Sen so r_a ddr es s
>: 80 / cm ? cmnd = sta tu s % 20 10 "
2 res p = r equ es ts . get ( URL )
3 dat a = resp . j son ()
4 tem p era t ure _ fro m _Io T _Se n sor = data [ ’
Sta tu sSN S ’ ][ ’ A M2 30 1 ’ ][ ’
Tem per atu re ’ ]
5 um id ity = data [ ’ S tat us SNS ’ ][ ’ AM230 1 ’
][ ’ H um idi ty ’]
Listing 1: Environmental data retrieve.
The thermal sensor of the camera needs updated
values of emmissivity, atmospheric transmission and
ambient temperature to correctly calibrate the mea-
surement. The prediction of the compensation values
is performed with Keras. See code in Listing 2.
1 lo a ded _mo del = tf . k er as . mod el s .
loa d_m od el ( ’/ T em pC omp Mo de l ’)
2 Te mpC om p = loa ded _mo del . p re dict ([
tem p era t ure _ fro m _Io T _Se n sor ])
3 te m p2 C am e ra = str ( int ( np. round (
TempC omp ) ))
Listing 2: Camera compensation.
The thermal camera can be reached through a nor-
mal HTTP connection. The thermal camera responds
with its raw data directly in a plain text format. Every
value in camera has an end-point so it was possible to
update only the specific information of interest. See
code in Listing 3.
1 Ob je ct Emi ssi vit y : http :// <
Cam er a_I P_add res s > :8 0/ c ontro l /
contr ol ? set & s ect io n = t herma l &
uhu _ tco mp_ s cn_ emi s =
com p ens ati o n_v a lu e s [ 0]
2 At m os p he r ic T ra n smi ssi on : h ttp :// <
Cam er a_I P_add res s > :8 0/ c ontro l /
contr ol ? set & s ect io n = t herma l &
uhu _ tco mp_ a tm_ trn s =
com p ens ati o n_v a lu e s [ 1]
3 Am bi ent T e mp e ra t ur e : http :// <
Cam er a_I P_add res s > :8 0/ c ontro l /
contr ol ? set & s ect io n = t herma l &
uhu _ tco mp_ a tm_ tem p =
com p ens ati o n_v a lu e s [ 2]
4 U RL = " http :/ /"+ ip1 + ": 80/ con tr ol /
contr ol ? set & s ect io n = t herma l &
uhu _ tco mp_ a tm_ tem p =" + \
5 str ( t e mp 2 Ca m er a ) + " " + str (
tem p2C ame ra )
6 res p = r equ es ts . get ( URL , auth =( ’ user
’, ’ p as sword ’) )
Listing 3: Camera access APIs.
The prediction is the most significant task of this
system; it was performed by adopting the TensorFlow
framework. See below for the most significant blocks
of code.
First, the system loads features and labels, see
Listing 4.
1 dat a = ’ ./ data . c sv ’
2 XY _d ata = pd. r ea d_c sv ( data , sep = ’ ,
’, u sec ol s = [ ’ gps b ox t em p er atu re
’,’ ti mes tam p ’ ,’ com pen sat ion ’],
encod ing = ’ utf -8 ’ )
Listing 4: Load features (input) and labels (output) from
an external file.
Next step is checking for the Missing Value and
handing null values, see Listing 5
1 co lu mns = [ ’ gp s box tem per atu re ’ ,’
com pen sat ion ’ ,’ tim es tam p ’]
Machine Learning-aided Automatic Calibration of Smart Thermal Cameras for Health Monitoring Applications
347
2 fro m sklea rn . imp ut e impor t
Sim ple Imp u te r
3 i mr = Sim ple Imp ute r ( mis s in g _va lue s =
np . nan , st rat eg y = ’ c onsta nt ’ ,
fil l_v al ue =0)
4 XY _d ata = i mr . f i t_t ran sfo rm ( X Y_ data .
va lues )
5 XY _d ata = pd. D at aFr ame ( XY_data ,
colum ns = c ol umns )
Listing 5: Load features (input) and labels (output) from
an external file.
Next step is setting the correct type for the com-
pensation values, see Listing 6
1 if ( XY_ da ta [ ’ c o mpe nsa tio n ’ ]. d ty pes
!= ’ f lo at ’):
2 XY_ da ta [ ’ com pen sat ion ’] = (
XY_da ta [ ’ c om p en s ati on ’ ]) . v alues .
as type ( fl oa t )
3 if ( XY_ da ta [ ’ gps b ox t em p er atu re ’ ].
dt ypes != ’ fl oa t ’):
4 XY_ da ta [ ’ gps box t emp era tur e ’] =
( X Y_d at a [ ’ gps box tem per atu re ’ ])
. str . rep la ce ( ’ , ’, ’.’)
5 XY_ da ta [ ’ gps box t emp era tur e ’] =
( X Y_d at a [ ’ gps box tem per atu re ’ ])
. v al ues . a stype ( fl oa t )
Listing 6: Converting values in float.
Next step is the dataset partitioning, see Listing 7
1 fro m sklea rn . m ode l _se lec tio n i mp ort
tra in_ t est _sp l it
2 X ,y = X Y_ dat a . loc [: , ’gps box
tem per atu ra ’ ]. v alu es , XY_da ta . loc
[: , ’ c omp ens azi one ’ ]. v al ue s
3 print (X,y)
4 X_t rain , X_test , y_train , y_ te st =
tra in_ t est _sp l it (X , y , t est _s ize
=0.3 , r and om_ sta te =0)
5 y_ tr ain = np. ravel ( y _tr ai n )
6 y_ te st = np . ra ve l ( y _t es t )
Listing 7: Partitioning dataset.
The compilation of model and the creation of
model are in Listing 8.
1 d ef g e t_m o del _ pom p ei_ p ort a sta b ia () :
2 l0 = tf . ke ra s . l ay er s . D en se ( units
=1 , inp ut_ sha pe =[1])
3 model = tf . k er as . S equ en tia l ([ l0
])
4 model . c omp il e ( loss = ’
mea n _sq uar e d_e rro r ’ ,
5 opt im ize r = tf . keras .
opt imi ze rs . Adam (0.1) )
6 ret ur n mo de l
7
8 model = g e t_m o del _ pom p ei_ p ort a sta b ia
()
Listing 8: Model: definition and compile.
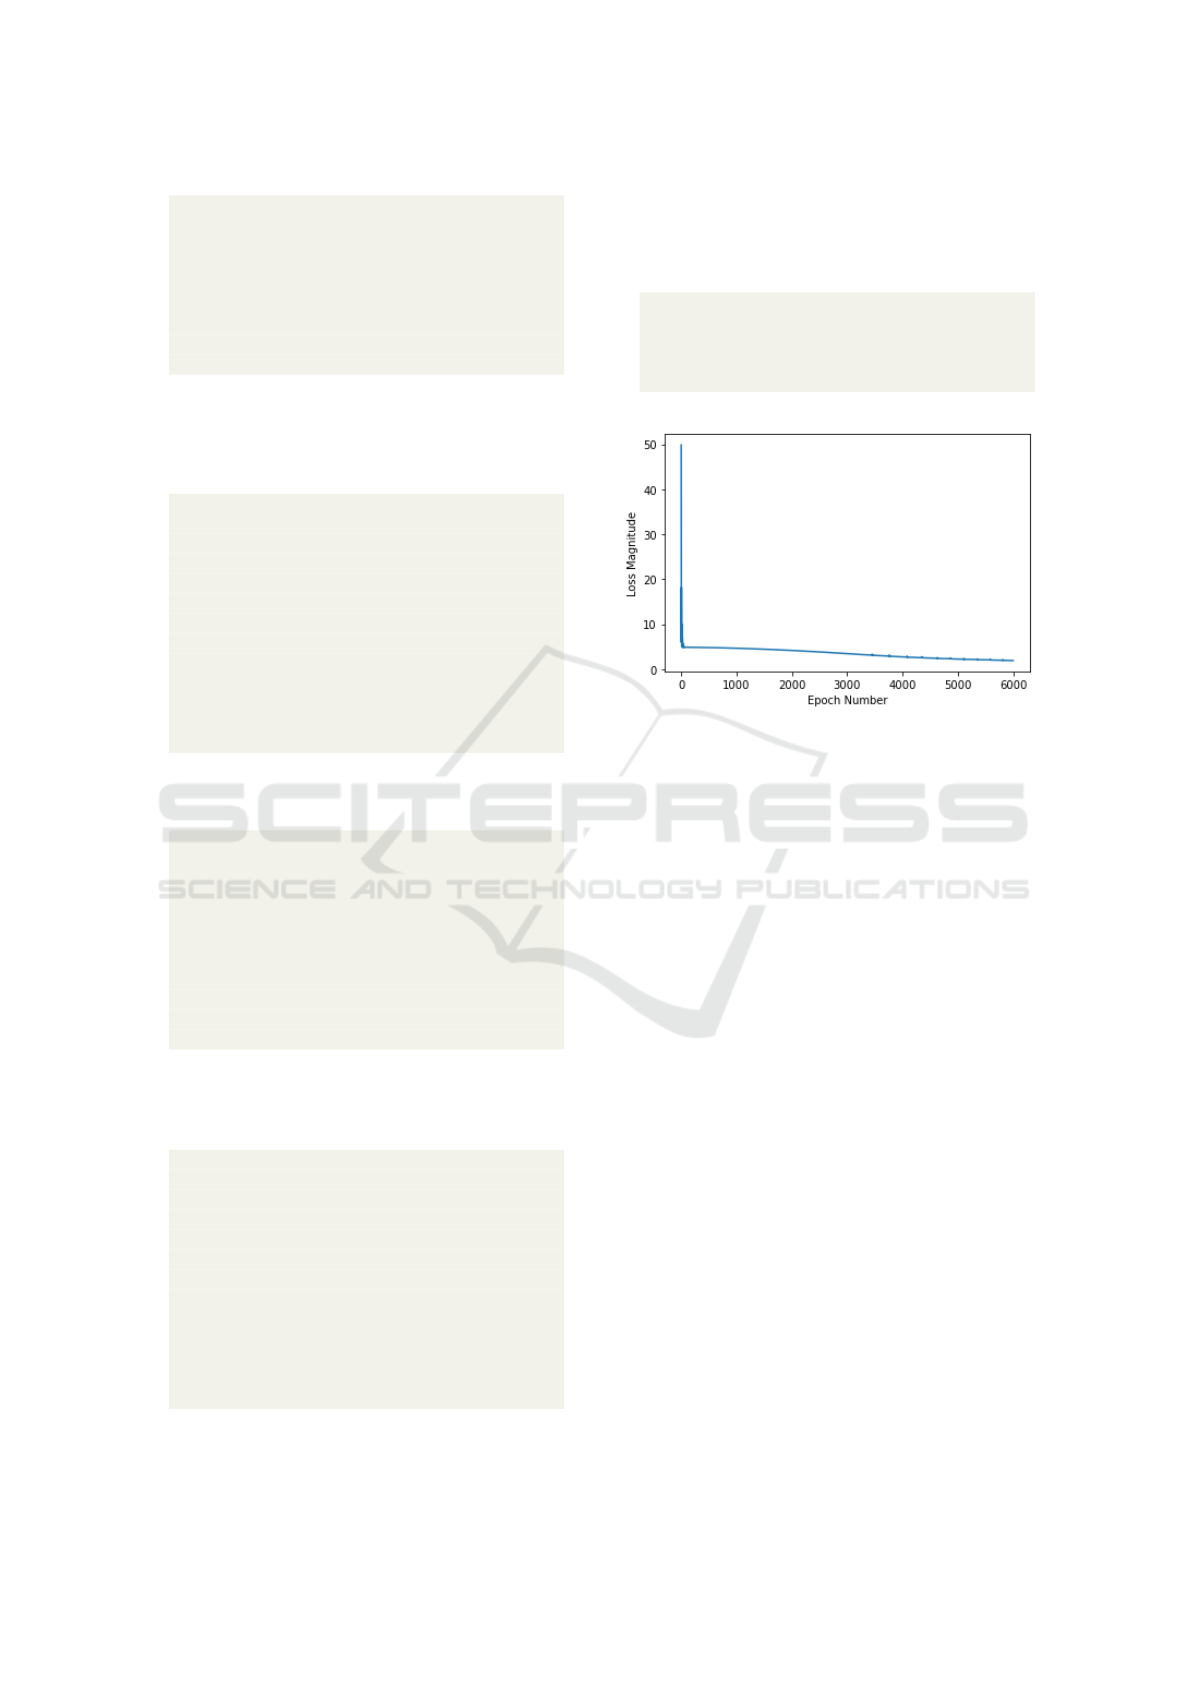
The next step consists in the fitting of the model
followed by the print of performance of the model, as
it can be seen in the next Listing 9 for the code and 5
for the loss performance.
1 hi st ory = mo de l . fi t ( X _trai n , y _trai n
, epo ch s =6000 , v erbos e =0)
2 p lt . x la bel ( ’ Epoch N um be r ’)
3 p lt . y la bel ( " Loss Mag ni tud e ")
4 p lt . plot ( h ist or y . h istor y [ ’ lo ss ’ ])
Listing 9: Fitting and printing performance.
Figure 5: Model performance.
Finally, save the model with model.save command
for the use on the field device.
3.4 Hardware Platform
The physical components of our system are briefly
listed below.
• IoT sensor;
• Raspberry Pi;
• Thermal camera;
Our system includes some SONOFF TH10 / TH16
based smart sensors and switches. The firmware
of the sensors and switches has been modified with
a customized version. In fact, through the custom
firmware it was possible to directly access raw sen-
sor data without going through third-party APPs and
on line services as Amazon Alexa or Google Home.
The Raspberry Pi 4 Model B with 4 Gigabytes of
LPDDR4 SDRAM represents the hardware subsys-
tem where training and data prediction can be per-
formed.
The subsystem for measuring body temperature is
represented by the Mobotix M16.
3.5 Software Solution
The software subsystem is divided into two layers:
the Application layer and the Data layer. The appli-
cation layer deals with recording the temperature and
AI4EIoTs 2021 - Special Session on Artificial Intelligence for Emerging IoT Systems: Open Challenges and Novel Perspectives
348

humidity conditions recorded in the location and in
the camera, then deals with the real-time analysis of
the camera configuration and records the temperature,
emissivity and transmissivity values of the measured
objects. Finally, the software subsystem takes care of
the camera temperature compensation.
The software subsystem mainly includes Node-
RED and TensorFlow Core 2.x:
• TensorFlow (TF);
• Node-RED (NR);
TF is an end-to-end open source platform for
machine learning. It has a comprehensive, flexi-
ble ecosystem of tools, libraries and community re-
sources that lets researchers push the state-of-the-art
in Machine Learning and developers easily build and
deploy Machine Learning powered applications. NR
is a programming tool for wiring together hardware
devices, APIs and online services in new and interest-
ing ways.
The data layer is the software subsystem that
manages the data and it is responsible for feeding
the dataset represented by the detected temperature
and humidity values, the brightness level, the date
and time and the temperature compensation values
recorded in the camera. The last set of values entered
into the dataset is used for prediction of the new tem-
perature compensation values.
We developed deep learning models using Python
3.x
4 CASE STUDY
The main issue for outdoor thermal camera installa-
tions is a consequence of the extreme variability of en-
vironmental conditions. The thermal camera, in fact,
would need constant temperature, humidity, wind and
luminosity. More variable environmental conditions
are than more calibrations are needed.
The challenge was to allow the use of the thermal
camera in outdoor installation, see Figure 6.
At first the model was trained considering all the
possible characteristics: temperature far from ther-
mal camera, temperature close to the thermal cam-
era, wind, humidity, luminosity, etc. After the first
tests we found that by removing all but one of the fea-
tures, the result did not change. The performance of
the model, in fact, depends almost exclusively on the
ambient temperature.
We chose TensorFlow for both development and
deploy because its extensive open-source user and de-
veloper community and because the Keras interface
was available with almost no effort.
Figure 6: ARM Linux KIT doing compensation.
There are two main versions of the platform:
TensorFlow core version as the end-to-end machine
learning platform and TensorFlow Lite version as the
deep learning framework for on-device inference. We
chose to use the core version of TensorFlow because
the small amount of calculations to do did not justify
the use of the lite version. In addition, the core ver-
sion is capable of doing on-device training even on
ARM devices.
5 RESULTS
In order to provide a preliminary evidence for our so-
lution, We took into account two scenarios for our ex-
periments.
In the first scenario, we considered an indoor lo-
cation for the camera, with and without adopting the
support of the black body.
In the second scenario, the camera was placed
in an outdoor location, without any external support,
such as the black body.
The experiments conducted with the support of
the black body brought no significant results, and this
the reason why they were not included in this work.
5.1 Indoor without Automatic
Compensation based on Machine
Learning
The experiments were conducted on 3 subjects from
9 in the morning until 12 in the morning. All subjects
were instructed to move in front of thermal camera
and maintain a stationary state for at least 10 seconds.
Our experimental results were compared with a nor-
mal mercury thermometer because of its reliability.
No automatic compensation here. Results are in Ta-
ble 1 where we show only the first 10 samples.
Machine Learning-aided Automatic Calibration of Smart Thermal Cameras for Health Monitoring Applications
349
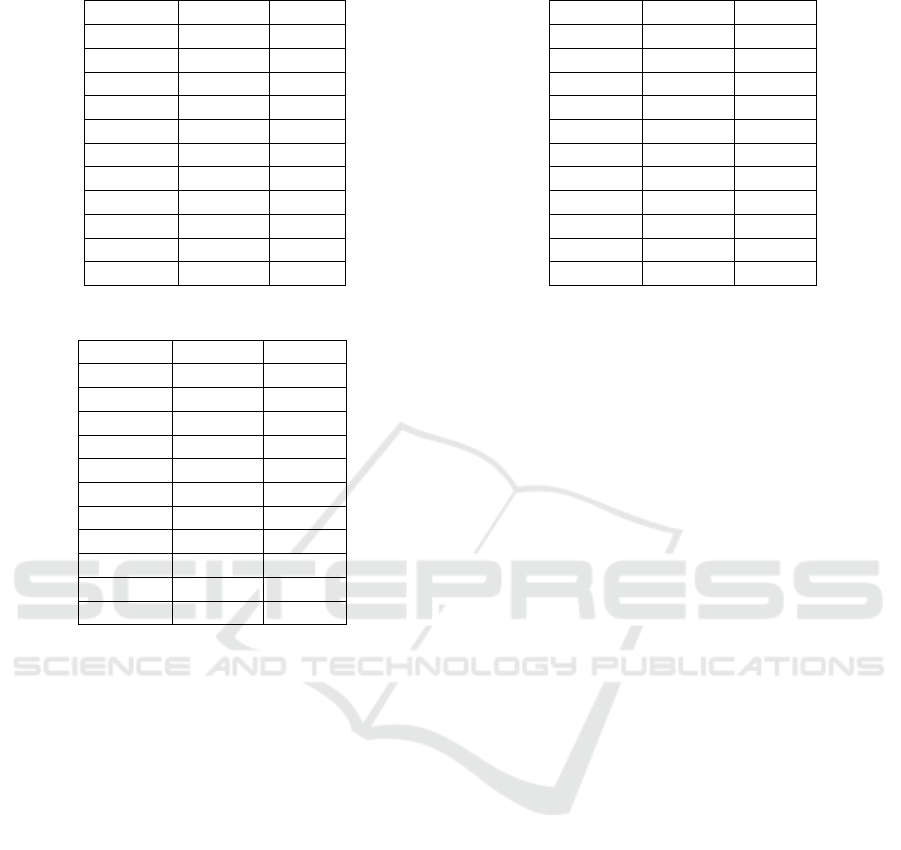
Table 1: Indoor w/out Automatic Compensation.
Camera Manual Error
36,4
◦
C 37,3
◦
C 0,9
◦
C
36,4
◦
C 37,2
◦
C 0,8
◦
C
36,6
◦
C 37,3
◦
C 0,7
◦
C
36,6
◦
C 37,1
◦
C 0,5
◦
C
36,6
◦
C 37,5
◦
C 0,9
◦
C
36,6
◦
C 37,8
◦
C 1,2
◦
C
36,6
◦
C 38
◦
C 1,4
◦
C
36,6
◦
C 38,4
◦
C 1,8
◦
C
36,6
◦
C 38,5
◦
C 1,9
◦
C
36,3
◦
C 38,1
◦
C 1,8
◦
C
... ... ...
Table 2: Indoor with Automatic Compensation.
Camera Manual Error
36,5
◦
C 36,3
◦
C -0,2
◦
C
36,5
◦
C 36,6
◦
C 0,1
◦
C
36,5
◦
C 36,8
◦
C 0,3
◦
C
36,5
◦
C 36,5
◦
C 0
◦
C
36,5
◦
C 36,6
◦
C 0,1
◦
C
36,5
◦
C 36,6
◦
C 0,1
◦
C
36,5
◦
C 36,6
◦
C 0,1
◦
C
36,5
◦
C 36,4
◦
C -0,1
◦
C
36,5
◦
C 36,6
◦
C 0,1
◦
C
36,5
◦
C 36,6
◦
C 0,1
◦
C
... ... ...
Here are the results from almost 300 samples:
• Average value = 1,19
◦
C;
• Variance = 0,258777778
◦
C;
• Standard deviation = 0,508702052
◦
C;
5.2 Indoor with Automatic
Compensation based on Machine
Learning
The experiments were conducted on 4 subjects from 2
in the afternoon until 6 in the afternoon. All subjects
were instructed to move in front of thermal camera
and maintain a stationary state for at least 10 seconds.
Our experimental results were compared with a nor-
mal mercury thermometer because of its reliability.
No automatic compensation here. Results are in Ta-
ble 2 where we show only the first 10 samples.
Here are the results from almost 300 samples:
• Average value = -0,008
◦
C;
• Variance = 0,0366
◦
C;
• Standard deviation = 0,191311265
◦
C;
Table 3: Outdoor w/out Automatic Compensation.
Camera Manual Error
37
◦
C 36,1
◦
C -0,9
◦
C
35,5
◦
C 35,8
◦
C 0,3
◦
C
36,8
◦
C 35,9
◦
C -0,9
◦
C
37,6
◦
C 35,9
◦
C -1,7
◦
C
36,7
◦
C 35,7
◦
C -1
◦
C
36,5
◦
C 36,3
◦
C -0,2
◦
C
34,2
◦
C 35,9
◦
C 1,7
◦
C
35,6
◦
C 35,5
◦
C -0,1
◦
C
34,8
◦
C 35,9
◦
C 1,1
◦
C
37,8
◦
C 36,4
◦
C -1,4
◦
C
... ... ... ...
5.3 Outdoor without Automatic
Compensation based on Machine
Learning
The experiments were conducted on 10 subjects from
5 in the morning until 9 in the morning. All subjects
were instructed to move in front of thermal camera
and maintain a stationary state for at least 10 seconds.
Our experimental results were compared with a nor-
mal mercury thermometer because of its reliability.
No automatic compensation here. Results are in Ta-
ble 3 where we show only the first 10 samples.
Here are the results from almost 300 samples:
• Average value = 0,588235294
◦
C;
• Variance = 6,028258824
◦
C;
• Standard deviation = 2,455251275
◦
C;
5.4 Outdoor with Automatic
Compensation based on Machine
Learning
The experiments were conducted on 10 subjects from
1 in the afternoon until 3 in the afternoon. All subjects
were instructed to move in front of thermal camera
and maintain a stationary state for at least 10 seconds.
Our experimental results were compared with a nor-
mal mercury thermometer because of its reliability.
Results are in Table 4 where we show only the first 10
samples.
Here are the results from almost 300 samples:
• Average value = 0,708888889
◦
C;
• Variance = 1,139010101
◦
C;
• Standard deviation = 1,192803625
◦
C;
AI4EIoTs 2021 - Special Session on Artificial Intelligence for Emerging IoT Systems: Open Challenges and Novel Perspectives
350

Table 4: Outdoor with Automatic Compensation.
Camera Manual Error
33
◦
C 34
◦
C 1
◦
C
34,5
◦
C 35,1
◦
C 0,6
◦
C
34,7
◦
C 35,2
◦
C 0,5
◦
C
34
◦
C 34
◦
C 0
◦
C
34,7
◦
C 35,3
◦
C 0,6
◦
C
36
◦
C 36
◦
C 0
◦
C
34
◦
C 34,9
◦
C 0,9
◦
C
33
◦
C 34
◦
C 1
◦
C
33,5
◦
C 34
◦
C 0,5
◦
C
35
◦
C 35,5
◦
C 0,5
◦
C
... ... ...
Table 5: With compensation VS without compensation.
Actual value Error w/out AI Error with AI
36,4
◦
C 0,9
◦
C 0,2
◦
C
36,4
◦
C 0,8
◦
C 0,1
◦
C
36,6
◦
C 0,7
◦
C -0,1
◦
C
36,6
◦
C 0,5
◦
C 0
◦
C
36,6
◦
C 0,9
◦
C 0
◦
C
36,6
◦
C 1,2
◦
C 0,2
◦
C
36,6
◦
C 1,4
◦
C 0
◦
C
36,6
◦
C 1,8
◦
C 0,1
◦
C
36,6
◦
C 1,9
◦
C 0
◦
C
36,3
◦
C 1,8
◦
C 0,1
◦
C
... ... ...
5.5 Measurements w/out Automatic
Compensation versus
Measurements with Automatic
Compensation
We conducted tests for 10 hours using a system with-
out automatic compensation and repeated the mea-
surements using a system with automatic compensa-
tion. Results are in Table 5 where we show only the
first 10 samples.
Here are the results from almost 300 samples:
• Average error value with AI = 0,208
◦
C;
• Average error value without AI = 1,239
◦
C;
5.6 Final Results
Experiments have shown that it is possible to reduce
human calibration. In fact, starting from a model
trained on the basis of only 108 samples, taken in
three day, it is possible to obtain a satisfactory error
trend. As you can see in Table 6.
The experiments were carried out mainly in sum-
mer and winter. A further step was taken to under-
Table 6: Final results.
Case Average Variance STD Dev
Indoor
w/out AI
1,19 0,26 0,51
Indoor
with AI
-0,01 0,04 0,19
Outdoor
w/out AI
0,59 6,03 2,45
Outdoor
with AI
0,71 1,14 1,19
stand how to manage the two datasets. We compared
the performance of the models in three different sce-
narios. The first scenario was to create the winter
model from winter data alone. The second scenario
consisted in considering the set of winter and summer
datasets. Finally, we first created the model with the
summer dataset only, then we trained the model by
adding the winter dataset to it. The best performances
are from the third scenario.
6 CONCLUSIONS AND FUTURE
WORKS
The critical situation induced by last year’s pandemics
has pushed all organisations to accelerate the deploy-
ment of digital media and resources, and has, there-
fore, also put a strain on the technology sector it-
self, which has been asked for immediate solutions,
both in production and deployment. Although there
seemed to be many alternatives available, not all of
them proved to be as usable or functional as they
should have been.
The digital technologies most stressed by this
health emergency were, on the one hand, all those re-
lated to the need to migrate massively to smart work-
ing and remote working, and on the other hand, all the
medical equipment used in health centres and places
where the physical presence of people could not be
replaced by a virtual one, such as hospitals and places
for the supply of essential goods.
It is precisely in these places, which inevitably
represent the playground for episodes of contagion,
that massive technological support was required to set
up systems to support the monitoring of people and
limit episodes of risk. Checking the febrile state at
the entrance to supermarkets, hospitals, public areas
and private areas, such as shops or pharmacies, was
one of the preliminary preventive measures adopted,
at least to discourage people potentially carrying the
virus from spreading it among others.
Manual checking of fever status at the entrance
of high-traffic area was not sustainable in the long pe-
Machine Learning-aided Automatic Calibration of Smart Thermal Cameras for Health Monitoring Applications
351

riod, also exposing the operators in charge themselves
to a high risk and requiring to sanitize frequently tools
and equipments.
So, thermal cameras have offered a potential miti-
gation facility to these latter problems, by providing a
contact-less mean for detecting people with fever-like
symptoms in high-traffic areas.
Anyway, in our experience, when also compared
to other experiences
6
, the evidence suggests ther-
mal cameras are still far from being a complete au-
tonomous solution, because several aspects, among
which a still limited accuracy, a high bias from a
wrong set up, the inability to recognise body parts,
and, finally raising data privacy concerns. The same
problem of data privacy was arisen with the introduc-
tion on smart app for implementing the back tracking
of infected or potentially infected people
7
.
Beyond privacy concerns, accuracy of measure-
ments can’t be neglected, because it negatively affects
the monitoring system, both when infected person
are not detected (incorrect false negative) and when
healthy people are detected as infected (incorrect false
positive); the first one produces free undisturbed cir-
culation of infected people and increase the spreading
of contagion; on the other hand, the second one can
lead the healthcare system to collapse, when starts re-
covering procedures needlessly.
High Accuracy performed by thermal cameras and
any other system, requires a precise and continuous
calibration, because the environmental conditions can
suddenly and quickly change. Furthermore, a fre-
quent re-tuning of such kind of systems requires a not
trivial effort by operators and organizations that have
to manage the monitoring systems.
Artificial intelligence and advanced machine
learning techniques can mitigate this aspect by pro-
viding mechanisms for improving accuracy of mea-
surements by enabling automatic tuning of systems,
according to preliminary learning process and an on
line inference process. In this work, we have pro-
posed a complete system for building a monitoring
system based on thermal cameras that exploit ma-
chine learning techniques to induce a different behav-
ior in the cameras, according to different environment
condition. we provided the full details about software
and hardware platform implemented for performing
preliminary experiments.
The lesson we learned by the experiments we per-
formed is that thermal cameras technology is not yet
6
https://theconversation.com/are-thermal-cameras-a-
magic-bullet-for-covid-19-fever-detection-theres-not-
enough-evidence-to-know-139377
7
https://www.webmd.com/lung/news/20200928/
privacy-concerns-hindering-digital-contact-tracing
mature enough to guarantee monitoring with a high
level of reliability on its own. The current technology
included in the thermal camera does not include, for
example, face recognition and, consequently, is un-
able to discard those measurements deriving from in-
significant parts (head, shoulders, ground and other
hot objects, etc.).
In the future, by combining thermal measurements
with more complex intelligence, as the one provided
by image recognition and processing, it might be
thought to indicate the position of the eyes to the ther-
mal camera for a more reliable measurement of body
temperature.
REFERENCES
Bardou, M., Seng, P., Meddeb, L., Gaudart, J., Honnorat,
E., and Stein, A. (2016). Modern approach to infec-
tious disease management using infrared thermal cam-
era scanning for fever in healthcare settings. Journal
of Infection.
Chiang, M.-F., Lin, P.-W., Lin, L.-F., Chiou, H.-Y., Chien,
C.-W., Chu, S.-F., and Chiu, W.-T. (2008). Mass
screening of suspected febrile patients with remote-
sensing infrared thermography: alarm temperature
and optimal distance. Journal of the Formosan Medi-
cal association, 107(12):937–944.
Chiu, W., Lin, P., Chiou, H., Lee, W., Lee, C., Yang, Y., Lee,
H., Hsieh, M., Hu, C., Ho, Y., et al. (2005). Infrared
thermography to mass-screen suspected sars patients
with fever. Asia Pacific Journal of Public Health,
17(1):26–28.
Ghassemi, P., Pfefer, T. J., Casamento, J. P., Simpson, R.,
and Wang, Q. (2018). Best practices for standard-
ized performance testing of infrared thermographs in-
tended for fever screening. PloS one, 13(9):e0203302.
Kang, J. K., Hoang, T. M., and Park, K. R. (2019). Person
re-identification between visible and thermal camera
images based on deep residual cnn using single input.
IEEE Access, 7:57972–57984.
Leach, K. C., Ellsworth, M. G., Ostrosky, L. Z., Bell, C. S.,
Masters, K., Calhoun, J., Ferguson, L., Distefano, S.,
and Chang, M. L. (2021). Evaluation of a telethermo-
graphic system for temperature screening at a large
tertiary-care referral hospital during the coronavirus
disease 2019 (covid-19) pandemic. Infection Control
& Hospital Epidemiology, 42(1):103–105.
Mercer, J. B. and Ring, E. F. J. (2009). Fever screening
and infrared thermal imaging: concerns and guide-
lines. Thermology International, 19(3):67–69.
Selent, M. U., Molinari, N. M., Baxter, A., Nguyen, A. V.,
Siegelson, H., Brown, C. M., Plummer, A., Higgins,
A., Podolsky, S., Spandorfer, P., et al. (2013). Mass
screening for fever in children: a comparison of 3 in-
frared thermal detection systems. Pediatric emergency
care, 29(3):305–313.
AI4EIoTs 2021 - Special Session on Artificial Intelligence for Emerging IoT Systems: Open Challenges and Novel Perspectives
352

Sharma, N., Jain, V., and Mishra, A. (2018). An analysis
of convolutional neural networks for image classifica-
tion. Procedia computer science, 132:377–384.
Sun, G., Akanuma, M., and Matsui, T. (2016). Clini-
cal evaluation of the newly developed infectious dis-
ease/fever screening radar system using the neural net-
work and fuzzy grouping method for travellers with
suspected infectious diseases at narita international
airport clinic. Journal of Infection, 72(1):121–123.
Sun, G., Hakozaki, Y., Abe, S., Vinh, N. Q., and Matsui,
T. (2012). A novel infection screening method us-
ing a neural network and k-means clustering algorithm
which can be applied for screening of unknown or un-
expected infectious diseases. The Journal of infection,
65(6):591–592.
Sun, G., Matsui, T., Hakozaki, Y., and Abe, S. (2015). An
infectious disease/fever screening radar system which
stratifies higher-risk patients within ten seconds us-
ing a neural network and the fuzzy grouping method.
Journal of Infection, 70(3):230–236.
Machine Learning-aided Automatic Calibration of Smart Thermal Cameras for Health Monitoring Applications
353
