
A Novel Technique for Modeling Vehicle Crash using Lumped Parameter
Models
Gulshan Noorsumar
a
, Svitlana Rogovchenko
b
, Kjell G. Robbersmyr
c
,
Dmitry Vysochinskiy
d
and Andreas Klausen
e
Department of Engineering Sciences, University of Agder, Grimstad, Norway
Keywords:
Mathematical Model, Collision Mitigation, Lumped Parameter Model, Piece-wise Linear Spring Stiffness,
Vehicle Pitching, Maximum Dynamic Crush.
Abstract:
This paper presents a novel technique for modeling a full frontal vehicle crash. The crash event is divided
into two phases; the first until maximum crush and the second part when the vehicle starts pitching forward.
This novel technique will help develop a three degrees of freedom (DOF) lumped parameter model (LPM)
for crash and support in the vehicle development process. The paper also highlights the design process for
reducing vehicle pitching in occupant protection load cases. The model has been validated against a finite
element (FE) simulation of a full frontal crash of a Chevrolet Silverado developed by the National Highway
Traffic Safety Administration (NHTSA), and the LPM shows good correlation with the FE test data.
1 INTRODUCTION
Vehicle crashes have been among the major causes of
mortality in recent times (Du Bois et al., 2004). In Oc-
tober 2015, the European Commission had launched
a study to identify the most common crash scenarios
leading to serious injuries in a vehicle crash. The re-
sults of this study point to the fact that a frontal crash
is the most common crash scenario, followed by a side
impact, where occupants are severely injured (Noor-
sumar et al., 2020). Euro NCAP is a voluntary car
safety assessment program introduced to ensure safer
cars for occupants and vulnerable road users. This
program has been instrumental in driving regulations
across the globe and improving vehicle safety stan-
dards. During the past decades, several crash miti-
gation and avoidance techniques have been employed
by vehicle design engineers to meet these stringent
regulations. The vehicle front-end and side structures
have been modified to improve energy absorption ca-
pability (Elkady and Elmarakbi, 2012). Vehicle de-
sign engineers have resorted to various methodologies
a
https://orcid.org/0000-0002-6718-4508
b
https://orcid.org/0000-0001-8002-4974
c
https://orcid.org/0000-0001-9578-7325
d
https://orcid.org/0000-0002-0453-0012
e
https://orcid.org/0000-0002-5411-3655
to improve the vehicle structure to absorb energy in
case of a crash and prevent intrusions in the occupant
compartment. These methodologies have been par-
tially successful in replacing full-time physical tests
in the vehicle development process. The vehicle in-
dustry still conducts a lot of physical crash tests to
validate the crash response generated from mathemat-
ical models.
One of the recent approaches is using finite ele-
ment methods (FEM) to model the full vehicle im-
pact scenario and conduct simulations to predict the
vehicle and occupant injury values. (Benson et al.,
1986) presented the calculations of crashworthiness
design thereby, laying the foundations for applica-
tion of FEM in the automotive industry. This tech-
nique has high accuracy in predicting injury values,
however the process involves manual efforts and is
computationally intensive. Lumped parameter mod-
els (LPM) were first used in modeling vehicle crash
by (Kamal, 1970). In this paper the vehicle was rep-
resented by three lumped mass components and eight
resistances representing the deformable parts in the
vehicle. Mentzer et al. (Mentzer et al., 1992) em-
ployed real time crash data to determine parameters
for LPM used to represent the crash scenario. The
force deformation curves derived from these models
helped determine predictive models aiding in vehicle
62
Noorsumar, G., Rogovchenko, S., Robbersmyr, K., Vysochinskiy, D. and Klausen, A.
A Novel Technique for Modeling Vehicle Crash using Lumped Parameter Models.
DOI: 10.5220/0010529200620070
In Proceedings of the 11th International Conference on Simulation and Modeling Methodologies, Technologies and Applications (SIMULTECH 2021), pages 62-70
ISBN: 978-989-758-528-9
Copyright
c
2021 by SCITEPRESS – Science and Technology Publications, Lda. All rights reserved

development.
Recently, LPMs were used by Elkady et al. to de-
velop a multi-DOF mathematical model to simulate a
crash event with active vehicle dynamics control sys-
tems (VDCS) (Elkady and Elmarakbi, 2012; Elkady
et al., 2012). The model replicated a full frontal
and offset impact between two vehicles and compared
the performance of a baseline vehicle with a vehicle
equipped with VDCS features. It also includes a 3-
DOF occupant impact model using Lagrangian for-
mulation. Munyazikwiye et al. use a mass-spring-
damper model with two lumped mass components
representing a vehicle impacting a rigid barrier. Af-
ter identifying the parameters, the model in this study
shows good correlation with test data which demon-
strates that a simple LPM can be used to represent the
impact dynamics successfully (Munyazikwiye et al.,
2013). Multi body modeling has also been used in the
past for simulating vehicle dynamics model for real-
istic applications (Riegl and Gaull, 2018).
Occupant injury prediction is an area of research
where the vehicle-occupant interaction in a vehicle
impact scenario is studied and the injury patterns of
occupants in the car are determined with mathemati-
cal models. Large vehicle deceleration has been iden-
tified as one of the main causes of head and chest in-
juries, and vehicle rotational motions in different axis
also lead to occupant injuries (Chang et al., 2006).
In a full frontal impact, vehicle pitch and drop are
significantly greater compared to rolling and yawing
motions. In the recent past, increasing focus on un-
belted occupants to meet FMVSS 208 (Federal Mo-
tor Vehicle Safety Standards) requirements has led re-
searchers to observe that vehicle pitch and drop con-
tributed to higher head and neck injury values. The
objective of a vehicle structure is not just to absorb en-
ergy and optimize crash pulses, but also to minimize
vehicle pitch and drop (Chang et al., 2006; Woitsch
and Sinz, 2013). Chang et al. have developed an
FE model to study vehicle pitch and drop in body-
on-frame vehicles. The model is correlated to barrier
tests and also tries to predict factors affecting vehicle
pitch and drop in a crash event (Chang et al., 2005).
The research from Chang et al. points to the fact that
design of vehicle rails plays an important role in the
load distribution during an impact scenario for body-
on-frame vehicles. The out-of-plane bending of the
vehicle rails increases the role of a vertical component
of the barrier force, causing an imbalance in the vehi-
cle, leading to forward pitching on the vehicle. Wei
et al. have estimated the relationship between energy
absorbing components and the crash pulse, establish-
ing the fact that the bumper and the front rails both
significantly contributing to the energy absorption in
a full frontal crash event (Wei et al., 2016).
In this paper, we simplify the system by splitting
the vehicle motion into two phases corresponding to
• the horizontal linear motion, and
• the rotation of the vehicle body.
We have decided to replicate a full frontal vehicle
crash event at 56 kilometers per hour (kmph) employ-
ing an LPM with multiple DOFs to predict
• the maximum deformation in the vehicle to absorb
energy, and
• the pitch angle of the vehicle due to the crash re-
sponse.
2 METHODOLOGY
Literature documents that a crash event leads to pitch-
ing, rolling and yawing of the vehicle along with the
deceleration of the vehicle and movement in horizon-
tal and vertical directions. It is difficult to model the
impact scenario in different axes and generating the
governing equations. It was also observed that the
time for the vehicle to attain minimum velocity after
impact also coincides with the maximum deformation
on the vehicle.
In this study, we separate the horizontal transla-
tional motion from the vertical motion during the im-
pact event. In a full frontal crash event the vehi-
cle is observed to be experiencing forward pitching;
whereas the effect of rolling and yawing can be ne-
glected. Taking into account these assumptions we
split the crash event into two phases:
• time till maximum deformation and minimum ve-
hicle velocity after start of crash event t
1
, and
• time after maximum deformation to the end of the
crash event t
2
.
2.0.1 FEM Simulations
In this study, finite element simulation for a 2014
Chevrolet Silverado (Administration et al., 2016) run-
ning at 56 kmph and hitting a frontal barrier at 0% off-
set was conducted. The FE model was developed by
National Crash Analysis Center (NCAC) in collabo-
ration with NHTSA (National Highway Traffic Safety
Administration) through the reverse engineering pro-
cess (Administration et al., 2016). The FE model con-
sisting of 1476 parts, 2,741,848 nodes and 2,870,507
elements has been correlated to NHTSA Oblique Test
and Insurance Institute for Highway Safety (IIHS)
Small Overlap Front Test. The FE model weighs 2582
A Novel Technique for Modeling Vehicle Crash using Lumped Parameter Models
63
kg which is close to the physical test vehicle weigh-
ing 2624 kg. It replicates the material and geometrical
properties of the physical vehicle (Singh et al., 2018).
The FE model was run on LS-DYNA with 32
CPUs in an HPC environment and the correspond-
ing curves generated were used for the parameter
estimation and validation of the LPM in MATLAB
Simulink. In the FE simulation, the acceleration of
some nodes on the vehicle body are recorded by the
solver LS-DYNA. These nodes are selected by the
user at the preprocessing stage. This process was em-
ployed to determine the acceleration of the vehicle
CG as well as the barrier forces, to be used for val-
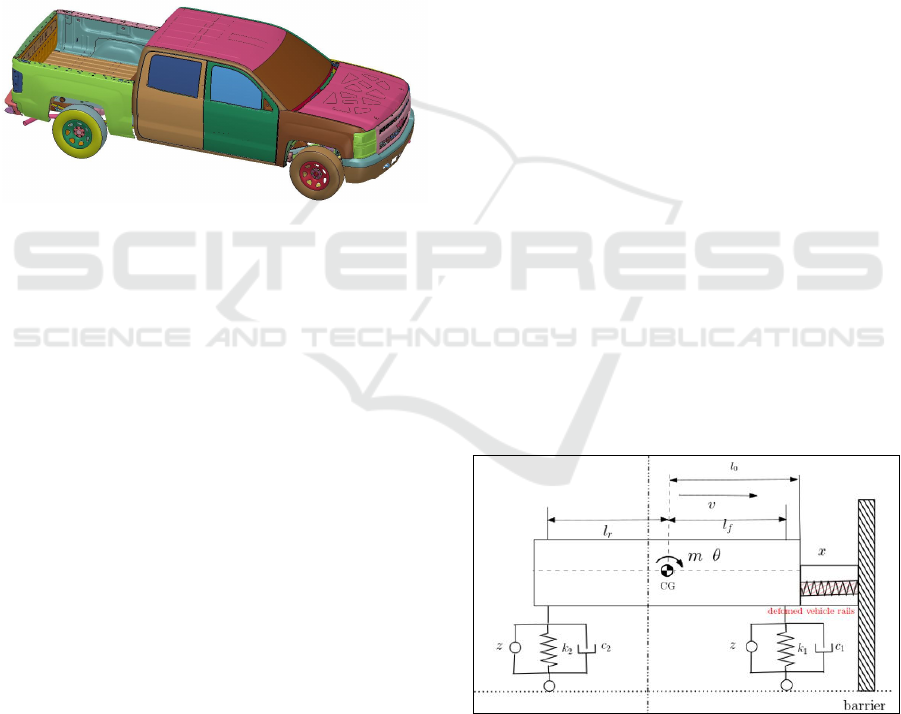
idation in this study. Figure 1 shows the FE model
used in the simulations.
Figure 1: FE Model of a 2014 Chevrolet Silverado devel-
oped by NCAC.
This FE model generated the piecewise linear
curve data for spring and damper coefficients. The al-
gorithm uses Newton-Euler numerical integration to
achieve the computed values and predict the time for
maximum dynamic crush of the vehicle. The algo-
rithm developed is explained in the next section.
2.1 Lumped Parameter Model
The LPM developed is a single-mass system with a
spring and damper unit in the front, known as Kelvin
model, representing the bumper system and the de-
formable system. The front springs allow transla-
tional motion only in the direction of x-axis (Huang,
2002). The suspension of the vehicle is represented
by a pair of springs and dampers which allow trans-
lation in the vertical z-axis and rotation around the
y-axis. The center of mass of the vehicle has 3 DOFs
making this system fairly complex to solve in a single
system. The lumped mass body can move in the direc-
tion of horizontal (x) and vertical (z) axes along with
rotation around one (y) axis. The center of gravity
(CG) of the vehicle is located at a distance l
f
from the
front end and l
r
from the rear end suspension points.
The distance l
0
represents the distance of the CG from
the front occupant compartment zone.
2.2 Vehicle Crash Model: Phase I
First we model only the translational movement of
the vehicle along the horizontal axis and hitting the
barrier at 0% offset. The mathematical model is de-
veloped in Simulink which replicates the maximum
vehicle deformation till the time of maximum crush
t
m
. This value also corresponds to the time when the
vehicle attains zero or minimum velocity. It should
be noted that the vehicle may not achieve zero veloc-
ity by the time of maximum deformation if the vehi-
cle front end is not able to absorb energy to undergo
plastic deformation. The mathematical model uses a
single DOF equation with a front spring-damper unit.
The stiffness of the spring is tuned to represent the
maximum deformation of the vehicle at a particular
speed. For this problem we have assumed a speed of
56 kmph (NHTSA regulations for frontal crash). The
motion of suspension system in the model has been
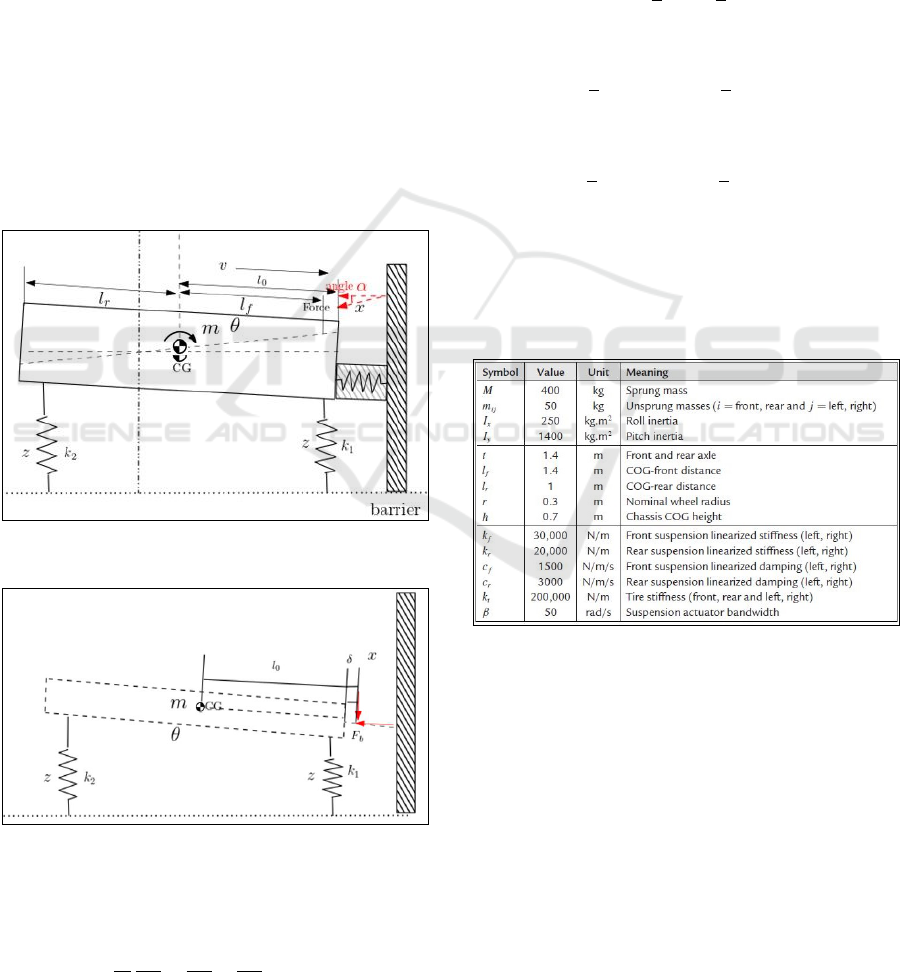
neglected during this phase of the event scenario. Fig-
ure 2 represents the vehicle in a deformed state. The
Simulink model predicts the time till maximum defor-
mation of the vehicle and the maximum displacement
of the vehicle CG.
The prediction of the values of spring deforma-
tion coefficient k and damper coefficient c used in the
general equation of motion have been a challenge for
researchers in the past (Marzbanrad and Pahlavani,
2011), (Pawlus et al., 2011). There have been several
parameter estimation studies conducted in the past to
determine the stiffness of the vehicle front in a crash
event. The behaviour of the front end system is highly
nonlinear but it has been approximated by a piece-
wise linear relationship (Munyazikwiye et al., 2017;
B Munyazikwiye et al., 2018).
Figure 2: Vehicle representation in Phase 1 of the event:
Deformed front end.
Equation of Motion:
m ¨x + c ˙x + kx = Q
i
(1)
where, Q
i
= 0 (i.e. no force component is added here);
k is the spring coefficient; c is the damper coefficient
SIMULTECH 2021 - 11th International Conference on Simulation and Modeling Methodologies, Technologies and Applications
64
for the bumper model.
In the model developed for the first phase, the spring
and damper coefficients are parameterized using a
gradient-descent optimization algorithm developed
in (Klausen et al., 2014) for a single mass-spring-
damper system. The code searches for a global min-
ima by performing 100 re-runs of gradient descent
optimization, each with randomly generated initial
parameter values. The algorithm was modified to
improve the correlation between the test and com-
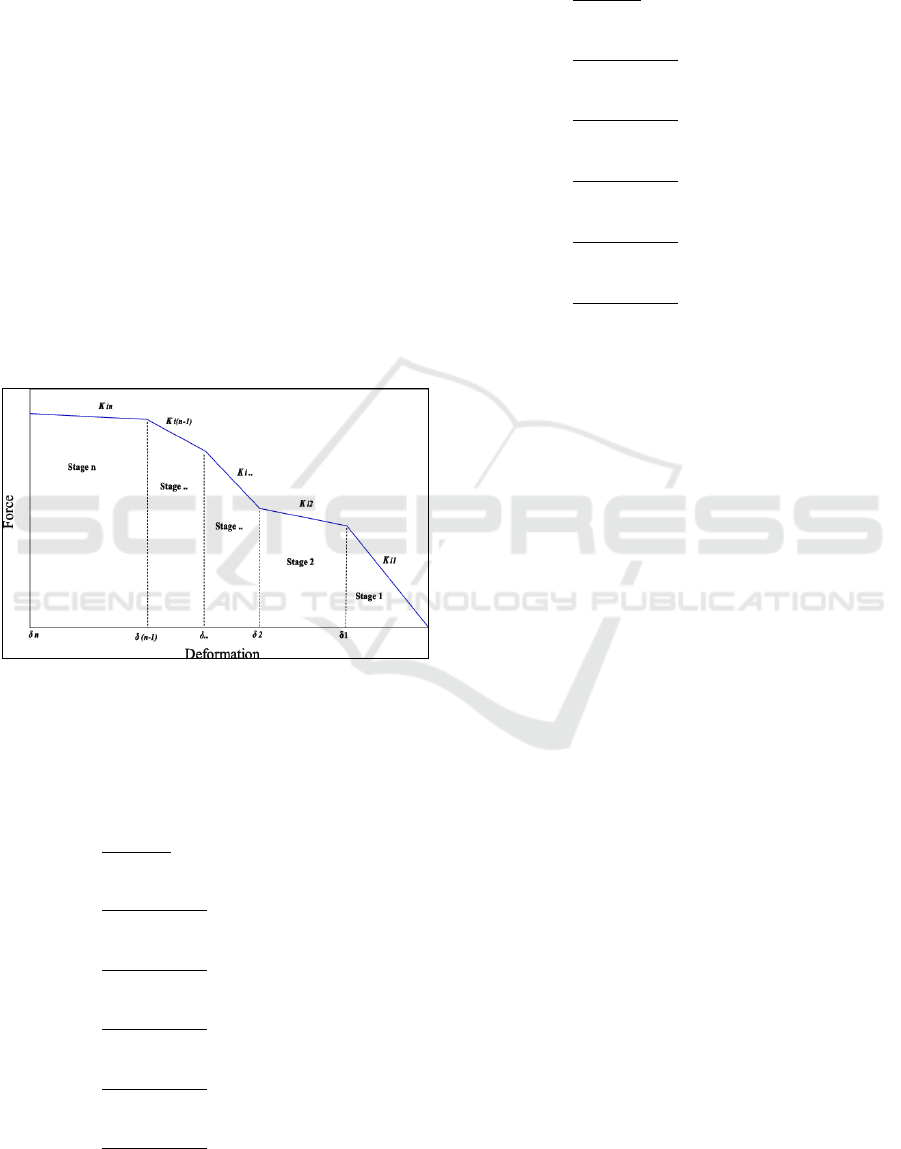
puted values. The non-linear force-deformation curve
for spring-damper system has been assumed to be
piecewise-linear with six breakpoints in the curve.
The forces on the spring are calculated using the gen-
eral relationship between the force and deformation
for a spring-damper system (Elkady and Elmarakbi,
2012), see Figure 3. The stiffness of the spring k and
the spring force component F
k
vary according to the
deflection values in the spring and are defined as fol-
lows.
Figure 3: General piecewise force-deformation characteris-
tics (Elkady and Elmarakbi, 2012).
The spring stiffness and damping coefficients in
the model, are defined as the piecewise-linear func-
tions of x and ˙x, respectively. These functions are
k(x) =
(k
2
−k
1
)·| ˆx|
x
1
+ k
1
for, | ˆx| ≤ x
1
,
(k
3
−k
2
)·(| ˆx|−x
1
)
(x
2
−x
1
)
+ k
2
for, x
1
≤ | ˆx| ≤ x
2
(k
4
−k
3
)·(| ˆx|−x
2
)
(x
3
−x
2
)
+ k
3
for, x
2
≤ | ˆx| ≤ x
3
(k
5
−k
4
)·(| ˆx|−x
3
)
(x
4
−x
3
)
+ k
4
for, x
3
≤ | ˆx| ≤ x
4
(k
6
−k
5
)·(| ˆx|−x
4
)
(x
5
−x
4
)
+ k
5
for, x
4
≤ | ˆx| ≤ x
5
(k
7
−k
6
)·(| ˆx|−x
5
)
(C−x
5
)
+ k
6
for, x
5
≤ | ˆx| ≤ C
The damper characteristics are defined similar to
the spring characteristics in the model
c( ˙x) =
(c
2
−c
1
)·|
ˆ
˙x|
˙x
1
+ c
1
for, |
ˆ
˙x| ≤ ˙x
1
,
(c
3
−c
2
)·(|
ˆ
˙x|− ˙x
1
)
( ˙x
2
− ˙x
1
)
+ c
2
for, ˙x
1
≤ |
ˆ
˙x| ≤ ˙x
2
(c
4
−c
3
)·(|
ˆ
˙x|− ˙x
2
)
( ˙x
3
− ˙x
2
)
+ c
3
for, ˙x
2
≤ |
ˆ
˙x| ≤ ˙x
3
(c
5
−c
4
)·(|
ˆ
˙x|− ˙x
3
)
( ˙x
4
− ˙x
3
)
+ c
4
for, ˙x
3
≤ |
ˆ
˙x| ≤ ˙x
4
(c
6
−c
5
)·(|
ˆ
˙x|− ˙x
4
)
( ˙x
5
− ˙x
4
)
+ c
5
for, ˙x
4
≤ |
ˆ
˙x| ≤ ˙x
5
(c
7
−c
6
)·(|
ˆ
˙x|− ˙x
5
)
(v
0
− ˙x
5
)
+ c
6
for, ˙x
5
≤ |
ˆ
˙x| ≤ v
0
where, k is the spring coefficient; c is the damper
coefficient; ˆx is the computed vehicle deformation; ˙x
is the vehicle velocity;
ˆ
˙x is the computed vehicle ve-
locity; v
0
is the velocity at the time of maximum dy-
namic crush; C is the maximum dynamic crush;
F
k
and F
c
are the built-up spring and damping
forces defined by the following equations
F
k
= k(x) · x, (2)
F
c
= c( ˙x) · ˙x (3)
The proposed algorithm uses an optimization ap-
proach to minimize an objective function. The ob-
jective function to be minimized is the error function
E(Θ, t) where Θ denotes the unknown variables in the
mode. The error function is defined as follows:
E(Θ, t) = E
1
(Θ, t) + E
2
(Θ, t) + E
3
(Θ, t), where
(4a)
E
1
(Θ, t) = |(a
FE
− a
LPM
)| (4b)
E
2
(Θ, t) = |(v
FE
− v
LPM
)| (4c)
E
3
(Θ, t) = |(x
FE
− x
LPM
)| (4d)
where, a is the acceleration; v is the vehicle veloc-
ity; and x is the displacement.
The error function E(Θ, t) determines the differ-
ence between the FE and computed values at every
point, and the optimization algorithm tries to mini-
mize these error values by altering Θ = [k
i
, c
i
]∀i ∈
[1, 7]. The corresponding spring and damper coeffi-
cient values developed from this minimization algo-
rithm have been discussed in the results section of the
paper.
A Novel Technique for Modeling Vehicle Crash using Lumped Parameter Models
65
2.3 Vehicle Crash Model: Phase II
The second phase for the model describes what hap-
pens after the instant the vehicle achieves maximum
dynamic crush and minimum velocity. The vehicle
starts to pitch forward at this instant. Several studies
were conducted to understand the reason behind the
vehicle pitching forward (Chang et al., 2005; Chang
et al., 2006), suggesting that for body-on-frame vehi-
cles one of the reasons is the out of plane bending in
vehicle rails leading to a vertical force component in
the moment balance equation. The vertical force com-
ponent is added to gravity force acting downwards
and creates an imbalance of loading which leads to
the vehicle pitching. The prediction of this pitching
angle is important for determining the injury to oc-
cupants and a low pitching angle influences occupant
protection design in a vehicle. In this phase of the
event as shown in Figure 4 and Figure 5, we consider
only vertical motion of the suspension springs and a
rotation about the y-axis with angle θ.
Figure 4: Vehicle representation in Phase II of the event:
Vehicle Pitching forward.
Figure 5: Vehicle representation in Phase II with forces act-
ing on the vehicle and suspension springs in play.
We use the Lagrangian Formulation (Goldstein
et al., 2002):
d
dt
∂L
∂ ˙q
i
−
∂L
∂q
i
+
∂D
∂q
i
= Q
i
(5)
where, in the general case, L = T −V , T is the total
kinetic energy of the system equal to the sum of the
kinetic energies of the particles, q
i
i = 1..n are gen-
eralized coordinates and V is the potential energy of
the system. For dissipation forces a special function
D must be introduced alongside L, Q
i
is the external
force acting on the system, which in this case is the
vertical force component experienced by the vehicle
at the time of maximum dynamic crush.
Kinetic Energy:
T =
1
2
J
˙
θ
2
+
1
2
m ˙x
2
(6)
Potential Energy :
V =
1
2
k
1
(x − l
f
θ)
2
+
1
2
k
2
(x + l
r
θ)
2
(7)
Dissipation Energy :
D =
1
2
c
1
( ˙x − l
f
˙
θ)
2
+
1
2
c
2
( ˙x + l
r
˙
θ)
2
(8)
The values of k
1
, k
2
, c
1
, c
2
, l
f
and l
r
are taken from
standard automotive parameters from literature data
(Savaresi et al., 2010). Table 1 shows the parameter
values adopted from this study.
Table 1: Automotive Parameters set (Savaresi et al., 2010).
The value of the vehicle mass m and the moment
of inertia J for the lumped mass system has been cal-
culated from the FE model of the vehicle. The gov-
erning equations of motion are
Q
i
=J
¨
θ + (k
1
l
2
f
+ k
2
l
2
r
)θ + (c
1
l
2
f
+ c
2
l
2
r
)
˙
θ
+ (k
2
l
r
− k
1
l
f
)x + (c
2
l
r
− c
1
l
f
) ˙x (9)
−Q
i
=m ¨x + (k
1
+ k
2
)x + (c
1
l
f
+ c
2
l
r
)
˙
θ
+ (k
2
l
r
− k
1
l
f
)θ + (c
1
+ c
2
) ˙x (10)
SIMULTECH 2021 - 11th International Conference on Simulation and Modeling Methodologies, Technologies and Applications
66
3 RESULTS AND DISCUSSION
In this section we compare the results of the LPM
model with FE data generated from LS-DYNA sim-
ulations for a Chevrolet Silverado vehicle at 56kmph
with a full frontal impact loadcase.
3.1 Phase I
As mentioned in the previous section, Part I of the
event simulates the time till maximum deformation
of the vehicle; the spring and damper coefficients are
determined using the Gradient Descent Optimization
with an error function explained in the previous sec-
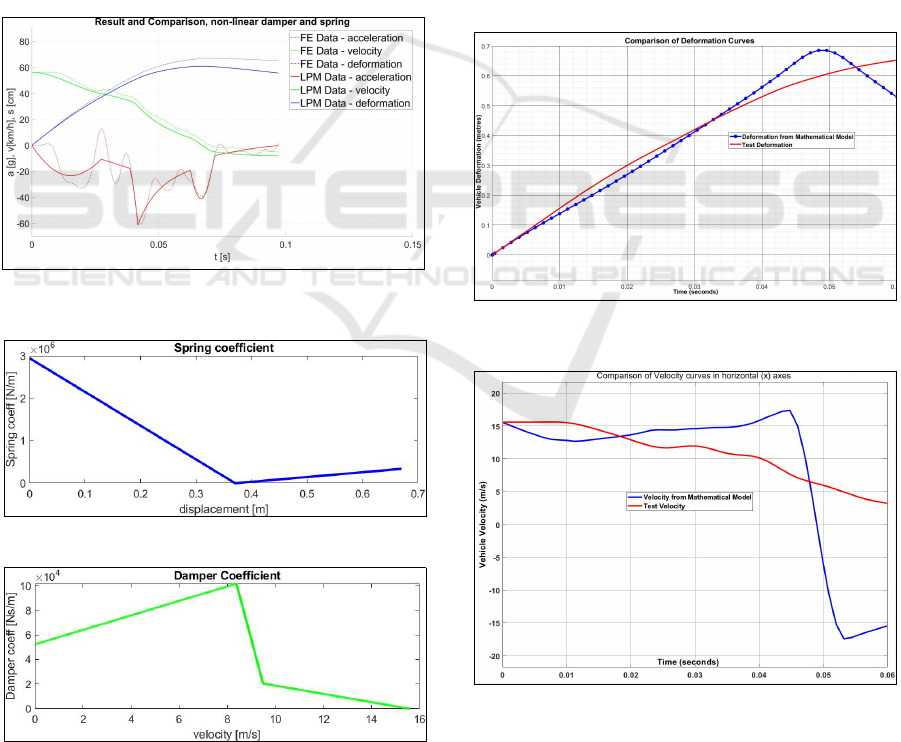
tion. The computed and test (FE) values are plotted in
Figure 6 and shows good correlation of results. The
algorithm predicts the stiffness and damping coeffi-
cient values as shown in Figures 7 and 8.
Figure 6: Plot of computed and test values for parameter
model.
Figure 7: Spring coefficient obtained from the algorithm.
Figure 8: Damper Coefficient obtained from the algorithm.
The output from the Gradient Descent Optimiza-
tion algorithm is used to predict the deformation and
vehicle velocity in a MATLAB Simulink model;
Figure 9 shows a plot of maximum vehicle defor-
mation vs test deformation and the plot shows good
correlation. A similar plot (Figure 10) was generated
to compare the velocity of the vehicle at the CG (in
the case of LPM at the CG of the lumped mass). The
time the vehicle attains zero velocity is similar in the
plots but there is a small difference after 0.04s. The
reason for this deviation can be attributed to the spring
and damper characteristics which are approximated
for this study using a piece-wise linear function. The
model can be improved using a non-linear function
for the spring stiffness and damping characteristics.
If the model is simulated beyond the time the vehi-
cle attains zero velocity, a rebound is observed in the
velocity. This velocity rebound could be due to the in-
ternal strain energy store in the springs, and it would
be interesting to investigate this further in future re-
search.
Figure 9: Displacement of the vehicle CG curves compari-
son for LPM vs FE model.
Figure 10: X-Velocity curve comparison for LPM vs FE
model.
A Novel Technique for Modeling Vehicle Crash using Lumped Parameter Models
67
3.2 Phase II
The prediction for the second part of the model us-
ing Simulink was conducted and plotted against the
data from FE model. The force Q
i
in the govern-
ing equations is the vertical component of the barrier
force experienced by the vehicle in the crash. The
force curve is derived from the FE model and inputted
into the Simulink model to improve prediction. How-
ever, it will be of interest to mathematically explain
this force component in terms of residual impact en-
ergy after absorption. The Simulink model is run with
numerical integration (variable timestep- ode 45) and
the velocity of the lumped mass in z-direction along
with the pitching angle is compared to data from FE
model.The comparison with other numerical integra-
tion methods was kept out of scope of this study.
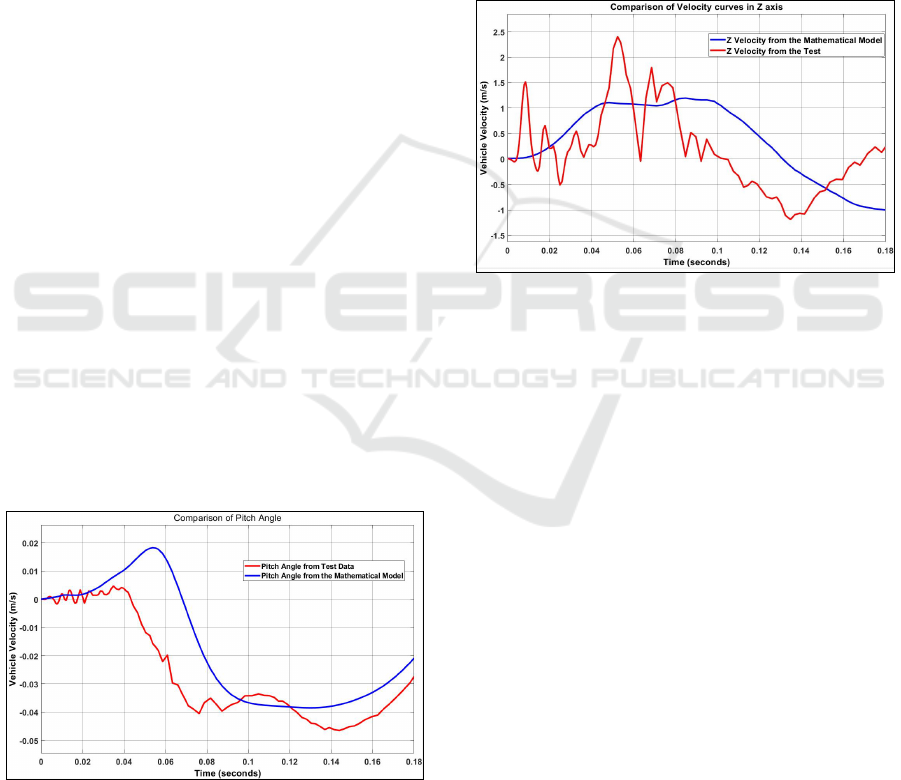
Figure 11 compares the forward pitching angle for
the FE model and the LPM developed in this study.
The pitch angle comparison shows a similar trend ob-
served in both the curves; the vehicle starts to pitch
around the same time during the crash event which
is crucial to designers planning airbag deployment in
vehicles and other active features on cars. The pitch
angle curve for the simulation LPM peaks higher than
the FE data at the start of the vehicle rotation but
slowly follows the FE data curve showing comparable
maximum pitch angle values which is also an impor-
tant observation for a vehicle safety design team. The
linear approximation for the spring and damper coef-
ficients can be a contributing factor to the difference
in the values between the curves along with the barrier
force definition in the model. There might be energy
losses in the model which have not been accounted
for in this study.
Figure 11: Forward Pitch Angle curve overlay for LPM vs
FE model.
Figure 12 compares the z-velocity (vertical veloc-
ity) in the body with the curves generated from FE
data. The trend in the curve is similar but the peak
values are not matching in this simulation model. One
of the contributing factors to this deviation is the use
of standard linear spring and damper coefficient val-
ues for the model (used from literature data). The lin-
ear value for the spring and damper coefficients can
lead to the difference in the values for this parameter
as well. The values of l
f
and l
r
can also be tuned
further to represent the Chevrolet Silverado (2015)
model used in this study. However, the authors have
intentionally avoided fine tuning these values assum-
ing that this data may not be available to vehicle de-
velopment team at the start of the design process. This
makes it inevitable to use standard values for automo-
tive parameters.
Figure 12: Z-Velocity curve comparison for LPM vs FE
model.
4 CONCLUSION AND NEXT
STEPS
The novel technique developed in this paper for mod-
eling a full frontal vehicle crash event successfully
predicts the event kinematics. The study demonstrates
that the two phase simulation model can describe a
highly complex dynamical multiple DOF system with
few equations and parameters, making the process of
using LPMs very simple and reliable for safety design
engineers. The study also highlights that parameter
identification is an important part of accident recon-
struction process and its correlation has an influence
on the deformation and velocity during vehicle crash.
One of the major implications from the model devel-
oped in this study is the design of vehicle rails, as a
contributing factor to vehicle pitching forward.
This assumption used to arrive at a simpler LPM
model providing reliable results include the follow-
ing:
• The spring and damper characteristics are as-
sumed to be piecewise-linear with six breakpoints
although they are non-linear in physical systems.
SIMULTECH 2021 - 11th International Conference on Simulation and Modeling Methodologies, Technologies and Applications
68

• The vehicle acceleration is assumed to be zero at
the time pitching starts in the crash event.
• Energy losses like friction and heat losses in the
vehicle during the crash event are neglected to
simplify the problem.
• Only vehicle rotations about the y-axis (pitching)
are considered for modeling in the full frontal im-
pact scenario; rotations about other axes are con-
sidered negligible and not impacting the occupant
injuries.
The next steps in this study include creating a
mathematical expression for the force components in
the mathematical model for the second phase which
includes pitching of the vehicle. The mathematical
expression for the force would help vehicle design
teams to reduce pitching on the vehicle by changing
the force components acting on the vehicle during a
collision. The prediction for maximum deformation
can be improved by using a non-linear force defor-
mation curve for the spring stiffness curve with larger
breakpoints along with including energy losses in the
model. The model currently uses standard spring and
damper coefficients for the suspension model which
can be tuned to match a particular vehicle being stud-
ied; also including the mass and the distance of the
CG from the vehicle suspension connections.
ACKNOWLEDGMENTS
The authors would like to thank University of Agder
for the support to conduct this research.
REFERENCES
Administration, N. H. T. S. et al. (2016). Crash sim-
ulation vehicle models. URL: https://www. nhtsa.
gov/research-data/databasesand-software.
B Munyazikwiye, B., Vysochinskiy, D., Khadyko, M., and
G Robbersmyr, K. (2018). Prediction of vehicle crash-
worthiness parameters using piecewise lumped pa-
rameters and finite element models. Designs, 2(4):43.
Benson, D., Hallquist, J., Igarashi, M., Shimomaki, K., and
Mizuno, M. (1986). Application of dyna3d in large
scale crashworthiness calculations. Technical report,
Lawrence Livermore National Lab.
Chang, J. M., Ali, M., Craig, R., Tyan, T., El-Bkaily, M.,
and Cheng, J. (2006). Important modeling practices in
cae simulation for vehicle pitch and drop. SAE Trans-
actions, pages 62–72.
Chang, J. M., Rahman, M., Ali, M., Tyan, T., El-Bkaily, M.,
and Cheng, J. (2005). Modeling and design for vehi-
cle pitch and drop of body-on-frame vehicles. SAE
transactions, pages 329–338.
Du Bois, P., Chou, C. C., Fileta, B. B., Khalil, T. B., King,
A. I., Mahmood, H. F., Mertz, H. J., Wismans, J.,
Prasad, P., and Belwafa, J. E. (2004). Vehicle crash-
worthiness and occupant protection.
Elkady, M. and Elmarakbi, A. (2012). Modelling and anal-
ysis of vehicle crash system integrated with different
vdcs under high speed impacts. Open Engineering,
2(4):585–602.
Elkady, M., Elmarakbi, A., and MacIntyre, J. (2012). En-
hancement of vehicle safety and improving vehicle
yaw behaviour due to offset collisions using vehicle
dynamics. International journal of vehicle safety,
6(2):110–133.
Goldstein, H., Poole, C., and Safko, J. (2002). Classical
mechanics.
Huang, M. (2002). Vehicle crash mechanics. CRC press.
Kamal, M. M. (1970). Analysis and simulation of vehicle to
barrier impact. SAE Transactions, pages 1498–1503.
Klausen, A., Tørdal, S. S., Karimi, H. R., Robbersmyr,
K. G., Je
ˇ
cmenica, M., and Melteig, O. (2014). Mathe-
matical modeling and optimization of a vehicle crash
test based on a single-mass. In Proceeding of the 11th
World Congress on Intelligent Control and Automa-
tion, pages 3588–3593. IEEE.
Marzbanrad, J. and Pahlavani, M. (2011). A system identifi-
cation algorithm for vehicle lumped parameter model
in crash analysis. International Journal of Modeling
and Optimization, 1(2):163.
Mentzer, S. G., Radwan, R. A., and Hollowell, W. T. (1992).
The sisame methodology for extraction of optimal
lumped parameter structural crash models. Technical
report, SAE Technical Paper.
Munyazikwiye, B. B., Karimi, H. R., and Robbersmyr,
K. G. (2013). Mathematical modeling of vehicle
frontal crash by a double spring-mass-damper model.
In 2013 XXIV International Conference on Informa-
tion, Communication and Automation Technologies
(ICAT), pages 1–6. IEEE.
Munyazikwiye, B. B., Karimi, H. R., and Robbersmyr,
K. G. (2017). Application of genetic algorithm on pa-
rameter optimization of three vehicle crash scenarios.
IFAC-PapersOnLine, 50(1):3697–3701.
Noorsumar, G., Robbersmyr, K., Rogovchenko, S., and
Vysochinskiy, D. (2020). Crash response of a repaired
vehicle-influence of welding uhss members. Techni-
cal report, SAE Technical Paper.
Pawlus, W., Karimi, H. R., and Robbersmyr, K. G.
(2011). Development of lumped-parameter mathe-
matical models for a vehicle localized impact. Journal
of mechanical science and technology, 25(7):1737–
1747.
Riegl, P. and Gaull, A. (2018). Modeling and validation of
a complex vehicle dynamics model for real-time ap-
plications. In Proceedings of 8th International Con-
ference on Simulation and Modeling Methodologies,
Technologies and Applications - SIMULTECH,, pages
403–413. INSTICC, SciTePress.
Savaresi, S. M., Poussot-Vassal, C., Spelta, C., Sename, O.,
and Dugard, L. (2010). Semi-active suspension con-
trol design for vehicles. Elsevier.
A Novel Technique for Modeling Vehicle Crash using Lumped Parameter Models
69

Singh, H., Ganesan, V., Davies, J., Paramasuwom, M.,
Gradischnig, L., Wood, P., and Mogal, V. (2018).
Structural countermeasure/research program mass and
cost increase due to oblique offset moving deformable
barrier impact test. Technical report.
Wei, Z., Karimi, H. R., and Robbersmyr, K. G. (2016).
Analysis of the relationship between energy absorb-
ing components and vehicle crash response. Technical
report, SAE Technical Paper.
Woitsch, G. and Sinz, W. (2013). Influence of pitching and
yawing during frontal passenger vehicle crash tests on
driver occupant’s kinematics and injury. International
journal of crashworthiness, 18(4):356–370.
SIMULTECH 2021 - 11th International Conference on Simulation and Modeling Methodologies, Technologies and Applications
70
