
Toward Understanding Personalities Working on Computer:
A Preliminary Study Focusing on Collusion/Plagiarism
Ayomide Bakare, Sergey Masyagin, Giancarlo Succi
a
and Xavier Vasquez
Innopolis University, Russia
Keywords:
Collusion, Plagiarism, User Behaviour, Computer Activity, Computer Processes, Computer-based Plagiarism.
Abstract:
Ample research has been carried out in the area of collusion, plagiarism and e-learning. Collusion is a form of
active cheating where two or more parties secretly or illegally cooperate. Collusion is at the root of common
knowledge plagiarism. While plagiarism requires two or more entities to compare, collusion can be determined
in isolation. It is also possible that collusion does not lead to positive plagiarism checks. It is therefore the aims
of this preliminary study to; (i) identify the factors responsible for collusion in e-assessment (ii) determine the
prominent factor that is representative of collusion and (iii) through user behaviour including, but not limited
to, application switching time, determine collusion. Innometrics software was used to collect data in two
compulsory exams (first one written and then oral) taken by the students. Discrepancies in the performance
and grades of students in the two exams served as the ground truth in labelling possible collusion. We claim
that user computer activities and application processes can help understand user behaviours in e-assessment.
It is on this premise that we develop a machine learning model to predict collusion through user behaviour in
e-assessment.
1 INTRODUCTION
e-Learning is nothing new. In a sense, the first pres-
ence of distance learning were already in place in
the ’50s of the previous century. Then, the advent
of Internet in the ’90s made it a common mecha-
nism for delivering instruction (Succi and Spasojevic,
2000a; Succi and Spasojevic, 2000b) and it has been
refined through the first decade of the present millen-
nium (Di Cerbo et al., 2008a; Di Cerbo et al., 2008c;
Di Cerbo et al., 2008b). In recent times, e-learning
has become a necessity and its adoption has grown
rapidly (Khomyakov et al., 2020; Yekini et al., 2020;
Almaiah et al., 2020). This adoption unequivocally
translates to an increase in e-assessment
1
and in turn
an increase in cheating (Mellar et al., 2018). Forms of
cheating, collusion and plagiarism, are critical chal-
lenges that face the use of e-learning assessment (e-
assessment) tool. There’s a high level of cheating
reported from the survey of students from different
countries (Bylieva et al., 2020).
Plagiarism is a widely popular term in e-
learning. Different educational institutions have dif-
ferent meanings for the term in their academic mis-
a
https://orcid.org/0000-0001-8847-0186
1
https://en.wikipedia.org/wiki/Electronic assessment
conduct policy or ethics memorandum. In this study,
we introduce the term ”plagiarism”, in the context of
e-learning, as an illegal imitation or transfer of artistic
or scientific work without information about its origi-
nal work or author (Skalka and Drlik, 2009):
turning in someone else’s work as your own,
changing words but copying the sentence struc-
ture of colleagues,
copying from online materials without citing
the source,
copying so many words or ideas from a source
that it makes up the majority of your work,
whether you give credit or not.
On the other hand, closely related to plagiarism is
collusion. Collusion is also outlined in various poli-
cies within the area of academic misconduct and in-
tegrity. It is difficult to draw the line between collab-
oration and collusion (especially where group work
is concerned). Collusion is the presentation by a stu-
dent of an assessment task as his or her own which
(Sutherland-Smith, 2013);
in whole or in part is the result of unauthorised
collaboration with another person/persons,
is plagiarised due to inappropriate collaboration
during group work,
476
Bakare, A., Masyagin, S., Succi, G. and Vasquez, X.
Toward Understanding Personalities Working on Computer: A Preliminary Study Focusing on Collusion/Plagiarism.
DOI: 10.5220/0010527904760483
In Proceedings of the 16th International Conference on Evaluation of Novel Approaches to Software Engineering (ENASE 2021), pages 476-483
ISBN: 978-989-758-508-1
Copyright
c
2021 by SCITEPRESS – Science and Technology Publications, Lda. All rights reserved

is the product of two or more students working
together without official authorization,
is a form of academic dishonesty (cheating).
In a university in the United Kingdom, 59 lectur-
ers’ and 451 students’ understandings of plagiarism
and collusion were compared by (Barrett and Cox,
2005) through a scenario-based questionnaire. They
found that although generally there was a sound un-
derstanding of plagiarism by staff and students, the
same could not be said of collusion. Their research
illustrated that staff considered the issue of collu-
sion much more problematic to resolve than that of
plagiarism and that many staff believe that assess-
ment is the primary way in which students learn’
so that a ‘blanket ban’ on collaboration is ‘unrealis-
tic’. Detecting collusion could be manual or through
some automated software proctoring or grader sys-
tems. Data mining has also been used to predict stu-
dent’s cheating in online assessments, focusing not
only on the student’s personality, perceptions, behav-
iors, stress situations, but also the professor’s teach-
ing style (Ochoa and Wagholikar, 2006). (Chuang,
2015) proposed three possible non-verbal cues, time
delay, visual focus of attention (VFOA), and affec-
tive state (facial expressions) as indicators of cheating
in e-assessments. Video data streamed via each stu-
dent’s webcam was collected and recorded through
a proctoring application while students were taking
the e-assessment. The study found that the impact
of student’s delay time to answer a question, varia-
tion of a student’s head pose relative to the computer
screen, and the student’s certainty rating (confusion)
for the question has a significant statistical relation to
cheating behaviors. There are many different ways
students can collude. There are websites that allows
student to submit exam questions (in cases of take-
home exams), student having someone else take the
test in-place, or communicating with other students
over cellular (Moten et al., 2013). We focus only on
user computer-based activities during e-assessment or
online computer based tests (CBT). In essence, all
possible collusion schemes (outside what user activity
on a computer) like impersonation, non-digital cheat-
ing, or cellular calls, are not considered. All these
schemes can be easily detected through video proc-
toring.
We explore a more sophisticated and unconven-
tional route through machine learning models in pre-
dicting collusion based on user computer-based activ-
ity while taking an e-assessment (without any proc-
toring software like in (Chuang, 2015)). We collect
data on the user processes and activities, on the com-
puter, during the duration of the e-assessment. These
includes actions like looking up answers on a web-
site, chatting with colleagues online, pulling up ma-
terials online or on local computer, among others,
which translates to user activities and running com-
puter processes. With this data, we ran some data
pre-processing steps and built different models on it.
The contribution of this study is to test the hypothesis
that the average time between switching application
or processes is significantly related to collusion dur-
ing e-assessment tasks taken by student.
Therefore, we define our research questions as fol-
lows:
RQ1. What are the factors responsible for collusion
in e-learning? Our objective here is to report
on finding the factors responsible for collusion
in e-assessments.
RQ2. What is the prominent user behaviour that is
representative of collusion? Our objective here
is to determine which of the user behaviours
from research is a good representation of col-
lusion.
RQ3. Is user switching time between applications a
sufficient indicator of collusion? Here, we look
at one of many user behaviours representative
of collusion and our objective is to determine if
user switching time is a sufficient behaviour to
predict collusion.
This paper is organized as follows. Section 2 present
the background theories of our investigation, and, in
particular, Section 3 presents the non invasive mea-
surement tool that we are analysing to collect the data.
Section 4 presents our empirical analysis, and Section
5 reviews critically the results that we have obtained.
Section 6 summarizes the results of our position, and
draws some conclusion and outlines our future work
in this area.
2 BACKGROUND
The problem of predicting collusion based on user
computer-based activities will be treated strictly as a
classification problem for simplicity. Similar to the
approach taken in (Krouska et al., 2017), it would
be best to perform a comparative analysis of three
well-known classifiers, namely Logistic Regression
2
(LR), Na
¨
ıve Bayes
3
(NB), Support Vector Machine
4
(SVM), and k-Nearest Neighbors
5
(k-NN).
Logistic regression has a wide range of applica-
2
https://en.wikipedia.org/wiki/Logistic regression
3
https://en.wikipedia.org/wiki/Naive
Bayes classifier
4
https://en.wikipedia.org/wiki/Support-vector machine
5
https://en.wikipedia.org/wiki/KNN
Toward Understanding Personalities Working on Computer: A Preliminary Study Focusing on Collusion/Plagiarism
477

tions and a very good baseline model is an impor-
tant model for evaluating and investigating the rela-
tionships between one or more independent variables
and a response variables. It can identify the effect of
one variable while adjusting for other observable dif-
ferences in relation to the target. A logistic regres-
sion model is typically estimated by ordinary least
squares, which minimizes the differences between the
observed sample values and the fitted values from the
generalized linear model (1). The data set is applied
on the logistic regression model to build a base model
for classification. The general form of logistic regres-
sion model (2) is:
Z
i
= α + β
1
freq processes
i
+ β
2
avg time per process
i
+ β
3
avg
switching time
i
+ ε (1)
Generally
Pr(Cheat = 1 | Z
i
) =
exp(Z
i
)
1 + exp(Z
i
)
(2)
Na
¨
ıve Bayes Classifier (4) is also a popular classi-
fier like LR. It is known as one of the state of art
techniques for many of different applications which
makes this classifier useful and accurate in provid-
ing results (Zhang, 2004). It belongs to the group
of probabilistic classifier because it uses the concept
of Bayes’ theorem (3) for classifying the data with
strong independence assumptions. Na
¨
ıve Bayes algo-
rithm can be used for binary classification as well the
multi-label classification.
P(A | B) =
P(B | A) ∗ P(A)
P(B)
(3)
P(x
i
| y) =
1
q
2πσ
2
y
exp
−
(x
i
− µ
y
)
2
2σ
2
y
!
(4)
Another choice of classifier is k-NN, which is a non-
parametric classifier. Although this algorithm re-
quires large amount of data to make more accurate
predictions, we include it only as a proof of concept.
In k-NN classification, the output is a class member-
ship. An new sample data is classified based on ma-
jority vote of its neighbors and the sample assigned
to the class most common among it’s k nearest neigh-
bors (k is a positive integer, typically small). Given
a positive integer k, k-nearest neighbors looks at the
k observations closest to a sample observation x
0
and
estimates the conditional probability that it belongs to
class j using the formula;
P(Y = j|X = x
0
) =
1
k
∑
i∈D
0
I(y
i
= j) (5)
where D
0
is the dataset of k-nearest observations and
I(y
i
= j) is an indicator variable that evaluates to 1 if
a given observation (x
i
, y
i
) in D
0
is a member of class
j, and 0 if otherwise.
SVM model which is a linear, non-probabilistic,
binary, instance-based and online learning classifier
(Srivastava and Bhambhu, 2010). SVM can also ef-
ficiently perform a non-linear classification using the
kernel trick
6
which can be referenced in further study.
We would consider only Logistic Regression in this
preliminary study.
Table 1: Common machine learning algorithms (classi-
fiers).
Classifier Approach
Logistic Regression Regression model
k-Nearest Neighbor Online based learning
Support Vector Machines Supervised learning
Na
¨
ıve Bayes Probabilistic learning
3 A SHORT INTRODUCTION TO
INNOMETRICS
Innometrics is a non invasive tool that is aimed to
record all the actions performed by the user from dif-
ferent points of view, in one hand, it can track which
applications is being used, the time spend on it and
classify it, and from another side it also possible to
track all the background processes running at the user
device and track the their resources utilization.
Therefore, by having the information collected by
Innometrics, we have the opportunity to understand
much better the tasks that the user is performing, the
time that he has spent on it, the computer resources
and to estimate of the amount of energy used.
4 EMPIRICAL ANALYSIS
The data used in this paper was extracted using In-
nometrics software during two online assessment ex-
ams, namely prefinal (written exam) and final (oral
exam) taken by students of Innopolis University in
2020 (Maurer et al., 1999; Vernazza et al., 2000; Sil-
litti et al., 2004; Scotto et al., 2004; Scotto et al., 2006;
Sillitti et al., 2012; Janes and Succi, 2014; Coman
et al., 2014). Prefinal exam took place before the fi-
nal exam and students were required to participate in
both exams. A total of 160 students participated in the
course of the assessments. The data collection pro-
6
https://en.wikipedia.org/wiki/Kernel method
ENASE 2021 - 16th International Conference on Evaluation of Novel Approaches to Software Engineering
478
cess was carried out in accordance to the ethics com-
mittee and parties involved have been undisclosed in
this paper. The assessment exams are different for
groups of student which introduces randomness into
the data. In total, 91,396 non-unique user and non-
user activities and 352,775 of non-unique running
processes were collected in the duration of the assess-
ment. Innometrics software was able to collect data
only after given consent and permission by the stu-
dent right before the assessment started.
The data points collected by the Innometrics soft-
ware are user email, executable name, IP address,
MAC address, process id, start time and end time
of activity, window/application title, status of activ-
ity (whether idle or not), type of desktop operating
system and data collection time. All data were nu-
merical except user email, executable name, win-
dow/application title, status of activity, and type of
desktop operating system. Innometrics and its prede-
cessors have been heavily used in empirical software
engineering research, and this has been the cultural
basis of this work (Marino and Succi, 1989; Valerio
et al., 1997; Kivi et al., 2000; Succi et al., 2001b;
Succi et al., 2001a; Sillitti et al., 2002; Succi et al.,
2002; Mus
´
ılek et al., 2002; Kov
´
acs et al., 2004; Paul-
son et al., 2004; Clark et al., 2004; Pedrycz and Succi,
2005; Ronchetti et al., 2006; Moser et al., 2008b;
Moser et al., 2008a; Rossi et al., 2010; Petrinja
et al., 2010; Corral et al., 2011; Pedrycz et al., 2011;
Fitzgerald et al., 2011; Rossi et al., 2012; Pedrycz
et al., 2012; Corral et al., 2013; Di Bella et al., 2013;
Corral et al., 2014; Corral et al., 2015).
Also, students were graded after the assessments
for both prefinal exam (written) and final exam (oral).
Since colluding during the oral was near impossible,
the discrepancies in performance and grades of stu-
dents in both exams formed the ground truth in cate-
gorizing students into those who colluded and did not
collude. Overall, three categories were formed based
on two divisions as shown in Table 2. Division A or
Cat-A are student with significantly decreasing grades
between written and oral exams are likely cheaters
and labeled accordingly. Students that fall in Division
B do not have significant decrease in grades from writ-
ten to oral exams. It is totally acceptable for students
to have and increase in grade or performance from
written to oral, which show additional preparation on
students part. Students in Division B are labelled as
non-cheaters. Division B is then further divided as
shown in Table 2. Cat-B1 are students who got high
grades in both exams and Cat-B2 are students who got
average to low marks in which there’s no significant
difference between written and oral grades.
Table 2: Student categorization.
Group Category Count Label
Division A Cat-A 33 Colluded
Division B
Cat-B1 85 No Collusion
Cat-B2 42 No Collusion
Table 3: Features used in experiment sets.
Exp. Set Predictor(s) Target
Set A devices,
unique processes,
total time spent,
avg switching time
cheated
Set B avg switching time cheated
4.1 Feature Selection and Engineering
The raw data was preprocessed to remove redun-
dant or irrelevant features (all features except email,
start time, MAC address, status of activity, process
id, and end time). New features (no. of devices,
no. unique processes, total time spent on test, and
average switching time) were also engineered, us-
ing Spark SQL with pyspark library in Python. For
the base generalized linear model, expected important
window/application title feature was dropped for fu-
ture works. The data was grouped by user email, IP
address and MAC address and the following new fea-
tures were engineered:
1. Number of devices used by user
2. Number of unique processes run during test
3. Total time spent during test
4. Average time spent per processes
5. Average switching time between processes
4.2 Results
We performed two separate sets of experiments using
LR machine learning algorithm to classify students’
collusion or not based on confusion matrices. The
first set of experiments used four predictors; no. of
devices, no. unique processes, total time spent on test,
and average switching time, and the second set used
only one predictor - average switching time. The pre-
dictors and target for each experiment set is shown in
Table 3.
We present precision, recall, and accuracy for all
experiments. The result from Set A experiment is
shown in Tables 4 while that of the Set B is shown in
Tables 5. We used a train-test split of 30% (i.e. 70%
for training dataset) for evaluating the model. We
Toward Understanding Personalities Working on Computer: A Preliminary Study Focusing on Collusion/Plagiarism
479
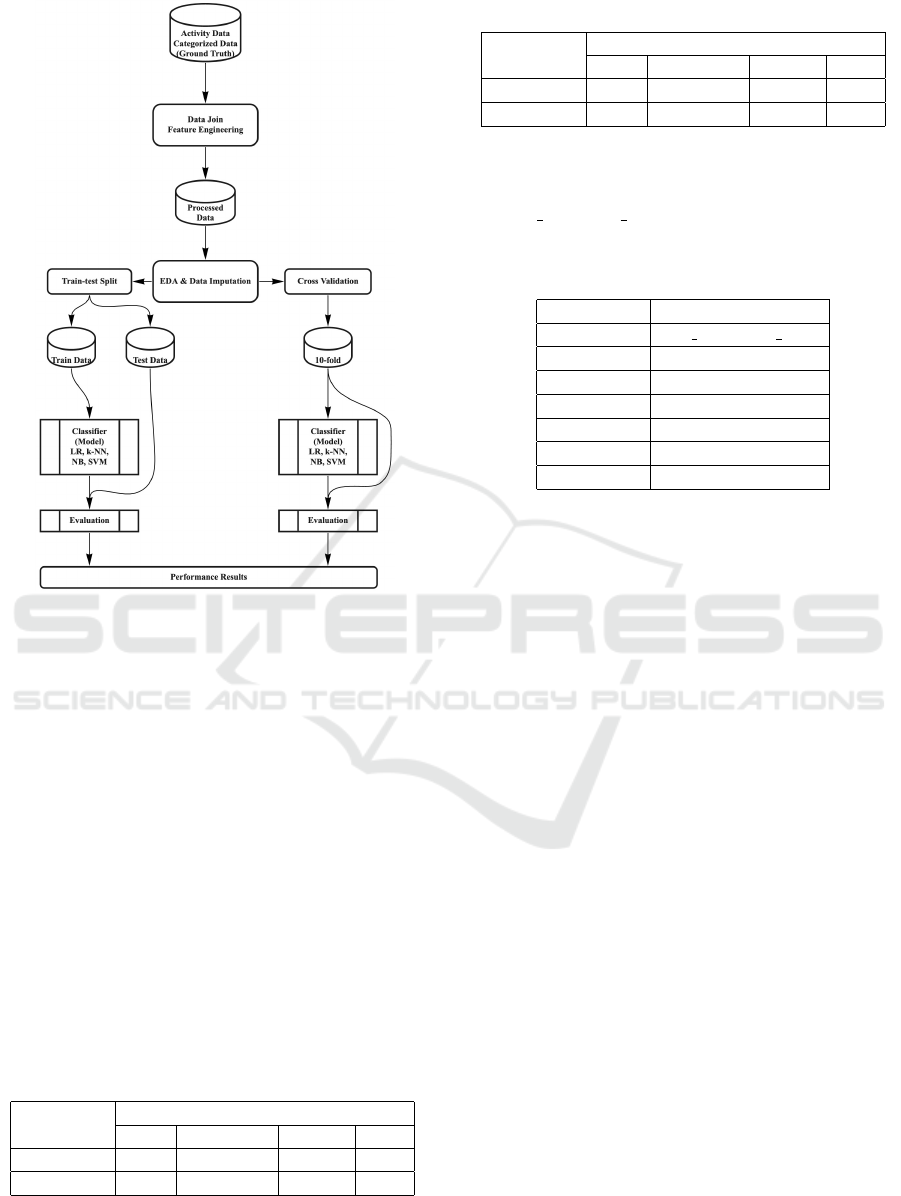
Figure 1: Experimental Method.
used a 10-fold cross-validation to estimate the perfor-
mance of the model on unseen data. We used default
values for the parameter settings of the LR classifier.
The LR classifier was used for the experiment out
of other classifiers to serve as a baseline model for fu-
ture works. For the Set A experiment, the accuracy
of the model was 81% using test dataset and 80% us-
ing cross-validation. A difference was recorded be-
tween the f1-scores of test dataset (89%) and cross-
validation (72%) which means that the model overfit-
ted to that one group of data in the train-test split ap-
proach. Cross-validation f1-score is also high which
means that the model is able to generalize well across
varying datasets. In Set B experiment, the same trend
is noticed between f1-scores of test dataset and cross-
validation. The accuracy and f1-scores of the clas-
sifier using test dataset and cross-validation are very
close.
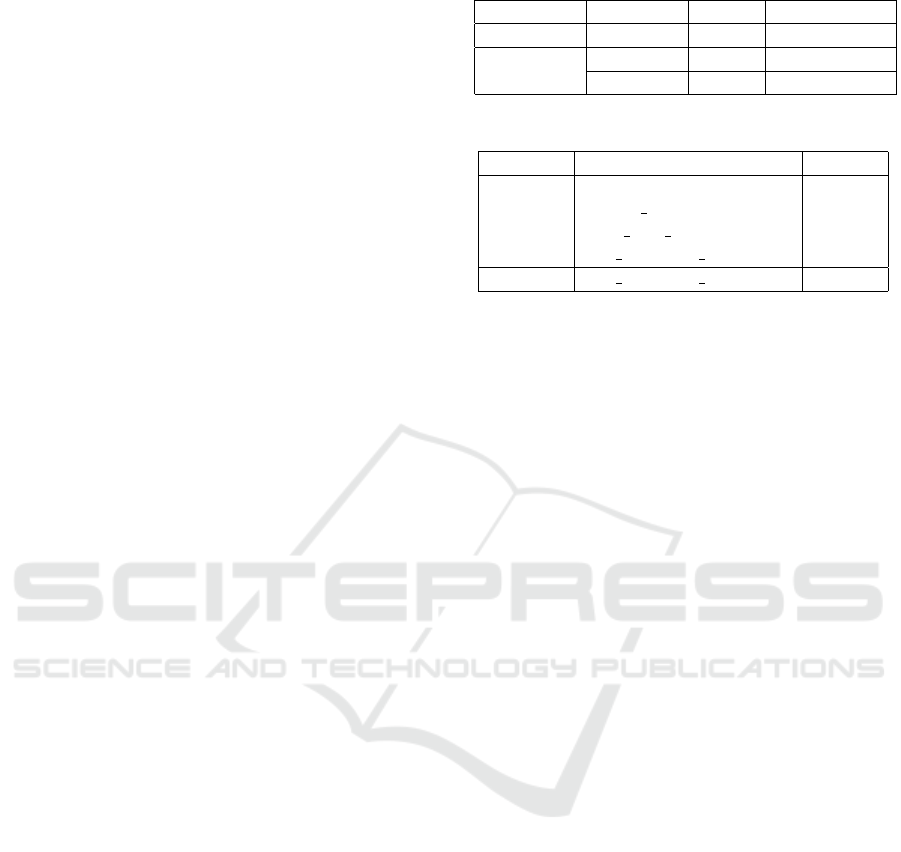
Table 4: Classification result of Set A.
Clf.
Logistic Regression
Acc. Precision Recall f1
Test set 0.81 0.80 0.98 0.89
Cross-val. 0.80 0.66 0.80 0.72
The results of this current algorithm as shown in Ta-
ble 6 provide the possibility of building a proctor-
Table 5: Classification result of Set B.
Clf.
Logistic Regression
Acc. Precision Recall f1
Test set 0.73 0.73 0.98 0.85
Cross-val. 0.81 0.66 0.81 0.73
ing system that could flag suspicious students in re-
motely administered exams automatically. It shows
that avg switching time is indeed a significant predic-
tor of collusion.
Table 6: Ols regression result.
Value
Predictor avg switching time
α 0.05
t-table 3.642
p-value 0.01
t-statistic 3.522
F-statistic 12.40
R-squared 0.06
4.3 Threats to Validity
Here, we discuss the threats to internal and external
validity of our results.
4.3.1 Internal Validity
Internal validity are the possible issues of our tech-
niques or data acquisition that can lead to false results
and imprecision. Here, we reveal potential sources of
such problems.
In order to determine ground truth, student’s re-
sults from prefinal and final had to be compared to
determine if the student colluded or not. This process
is prone to human error and may not exactly depict
whether the student colluded or not since no student
was caught in the act.
4.3.2 External Validity
External validity is the extent to which the conclu-
sions of this study can be generalized. Here, we
present the limitations of this study.
Collusion is highly consequential and repercus-
sions are usually weighty. Therefore results from the
model need to be re-validated against actual cases
of collusion. Also, the preliminary results of the
study cannot be generalized to cases of open-book e-
assessment because students are allowed to access re-
sources online which will lead to switching between
applications more frequently.
ENASE 2021 - 16th International Conference on Evaluation of Novel Approaches to Software Engineering
480

5 DISCUSSION
There is an unclear understanding and agreement of
what collusion is amongst students, instructors, fields
of study, and institutions (Sutherland-Smith, 2013).
In general, students value learning together, and per-
sonal qualities such as friendship and trust, above pol-
icy mandates on academic conduct. Therefore stu-
dents may argue that they are ‘helping friends’ and
collaborating as required by the university and do not
see such actions as open to allegations of collusion
(Ashworth et al., 1997). In a survey conducted (Sut-
ton and Taylor, 2011) among 1038 respondents in
relation to academic integrity and collusion, it was
found from the responses that the major factors lead-
ing to collusion by student are trust, cooperation, in-
formation technology use, and conscientious working
(RQ1.). Some other factors found to be responsi-
ble for collusion are injustice (group-based emotions,
group-based deprivation), collective identity (group
identification and group action), and efficacy (unified
effort and collective power) (Parks et al., 2020).
This preliminary study investigated user behaviors
(specifically average time of switching processes) us-
ing data collected by Innometrics software and found
that average time of switching between processes has
a positive significant relationship for predicting col-
lusion behaviors (RQ3.). The results of this LR clas-
sifier as shown in Table 6 provide the possibility of
building a proctoring system that could flag suspi-
cious students in remotely administered exams auto-
matically.
User switching time between applications is only
one of many user behaviours strongly indicative of
collusion while taking e-assessment task. Student de-
lay time to answer a question and the student certainty
rating for the question through a proctoring applica-
tion through VFOA has been found to be a prominent
user behaviour representative of cheating RQ2.. Also,
further processing of the user application window (or
tab, in case of web browsers) title, collected by Inno-
metrics software, can also be indicative of collusion.
6 CONCLUSIONS AND FURTHER
WORK
In this preliminary study, we have found that indeed
there is a positive relationship between user switching
time between processes and collusion. This specific
behaviour is interesting and indeed is worth investi-
gating further. It is noteworthy that this behaviour
in itself is insufficient in making a concrete or com-
plete decision on collusion. There are other user be-
haviours that indeed contribute to detecting cheating
behaviours during computer based assessments.
There are several limitations and open questions
left in this study. The study of user behaviours during
computer based assessment is broad with a lot of dif-
ferent variables or behaviours to consider. The result
presented in section 5 shows a positive relationship
between average switching time between processes
and collusion. A high switching time positively in-
dicates a high probability of cheating. Exploring the
title of application processes and applying natural lan-
guage processing will also be a great indication of col-
lusion. While this study focuses on collusion, the re-
sults can be extended to plagiarism. We acknowledge
that this is not a complete solution due to the limit in
the amount of data and other important predictor vari-
ables not covered. It should be noted that the work
herein predicts if a student exhibited behaviours (of
which switching time between processes is one met-
ric) related to collusion and does not indicate whether
a student actually colluded or not. Finally, it would
be interesting to determine if such differences in be-
haviour have an impact in the consumption of energy
of the device that is being used, which is indeed one
of the key goals of the Innometrics tool.
ACKNOWLEDGMENTS
This research project is carried out under the support
of the Russian Science Foundation Grant N
o
19-19-
00623.
REFERENCES
Almaiah, M., Al-Khasawneh, A., and Althunibat, A.
(2020). Exploring the critical challenges and factors
influencing the e-learning system usage during covid-
19 pandemic. Education and Information Technolo-
gies, 25.
Ashworth, P., Bannister, P., and Thorne, P. (1997). Guilty in
whose eyes? university students’ perceptions of cheat-
ing and plagiarism in academic work and assessment.
Studies in Higher Education, 22:187–203.
Barrett, R. and Cox, A. (2005). ’at least they’re learning
something’: the hazy line between collaboration and
collusion. Assessment & Evaluation in Higher Edu-
cation, 30:107–122.
Bylieva, D., Lobatyuk, V., and Nam, T. (2020). Aca-
demic dishonesty in e-learning system. Sustainable
Economic Development and Application of Innovation
Management, pages 1–6.
Chuang, C. (2015). Improving proctoring by using non-
verbal cues during remotely administrated exams.
Toward Understanding Personalities Working on Computer: A Preliminary Study Focusing on Collusion/Plagiarism
481

Clark, J., Clarke, C., De Panfilis, S., Granatella, G., Predon-
zani, P., Sillitti, A., Succi, G., and Vernazza, T. (2004).
Selecting components in large cots repositories. Jour-
nal of Systems and Software, 73(2):323–331.
Coman, I. D., Robillard, P. N., Sillitti, A., and Succi,
G. (2014). Cooperation, collaboration and pair-
programming: Field studies on backup behavior.
Journal of Systems and Software, 91:124–134.
Corral, L., Georgiev, A. B., Sillitti, A., and Succi, G. (2013).
A method for characterizing energy consumption in
Android smartphones. In Green and Sustainable Soft-
ware (GREENS 2013), 2nd International Workshop
on, pages 38–45. IEEE.
Corral, L., Georgiev, A. B., Sillitti, A., and Succi, G. (2014).
Can execution time describe accurately the energy
consumption of mobile apps? An experiment in An-
droid. In Proceedings of the 3rd International Work-
shop on Green and Sustainable Software, pages 31–
37. ACM.
Corral, L., Sillitti, A., and Succi, G. (2015). Software As-
surance Practices for Mobile Applications. Comput-
ing, 97(10):1001–1022.
Corral, L., Sillitti, A., Succi, G., Garibbo, A., and Ramella,
P. (2011). Evolution of Mobile Software Development
from Platform-Specific to Web-Based Multiplatform
Paradigm. In Proceedings of the 10th SIGPLAN Sym-
posium on New Ideas, New Paradigms, and Reflec-
tions on Programming and Software, Onward! 2011,
pages 181–183, New York, NY, USA. ACM.
Di Bella, E., Sillitti, A., and Succi, G. (2013). A multivari-
ate classification of open source developers. Informa-
tion Sciences, 221:72–83.
Di Cerbo, F., Dodero, G., and Succi, G. (2008a). Extend-
ing Moodle for collaborative learning. In Proceedings
of the 13th Annual SIGCSE Conference on Innova-
tion and Technology in Computer Science Education,
ITiCSE 2008, Madrid, Spain,, volume 40, page 324.
ACM.
Di Cerbo, F., Dodero, G., and Succi, G. (2008b). So-
cial Networking Technologies for Free-Open Source
E-Learning Systems. In Open Source Development,
Communities and Quality: IFIP 20th World Computer
Congress, Working Group 2.3 on Open Source Soft-
ware, Milano, Italy, volume 275 of IFIP, page 289.
Springer.
Di Cerbo, F., Forcheri, P., Dodero, G., and Succi, G.
(2008c). Tools for supporting hybrid learning strate-
gies in open source software environments. In Hybrid
Learning and Education: First International Confer-
ence, ICHL 2008 Hong Kong, China, Proceedings,
pages 328–337. Springer Berlin Heidelberg.
Fitzgerald, B., Kesan, J. P., Russo, B., Shaikh, M., and
Succi, G. (2011). Adopting open source software: A
practical guide. The MIT Press, Cambridge, MA.
Janes, A. and Succi, G. (2014). Lean Software Development
in Action. Springer, Heidelberg, Germany.
Khomyakov, I., Masyagin, S., and Succi, G. (2020). Expe-
rience of Mixed Learning Strategies in Teaching Lean
Software Development to Third Year Undergradu-
ate Students. In International Workshop on Fron-
tiers in Software Engineering Education, pages 42–
59. Springer.
Kivi, J., Haydon, D., Hayes, J., Schneider, R., and Succi,
G. (2000). Extreme programming: a university team
design experience. In 2000 Canadian Conference
on Electrical and Computer Engineering. Confer-
ence Proceedings. Navigating to a New Era (Cat.
No.00TH8492), volume 2, pages 816–820 vol.2.
Kov
´
acs, G. L., Drozdik, S., Zuliani, P., and Succi, G.
(2004). Open Source Software for the Public Ad-
ministration. In Proceedings of the 6th Interna-
tional Workshop on Computer Science and Informa-
tion Technologies.
Krouska, A., Troussas, C., and Virvou, M. (2017). Compar-
ative evaluation of algorithms for sentiment analysis
over social networking services. Journal of Universal
Computer Science, 23:755–768.
Marino, G. and Succi, G. (1989). Data Structures for Par-
allel Execution of Functional Languages. In Pro-
ceedings of the Parallel Architectures and Languages
Europe, Volume II: Parallel Languages, PARLE ’89,
pages 346–356. Springer-Verlag.
Maurer, F., Succi, G., Holz, H., K
¨
otting, B., Goldmann, S.,
and Dellen, B. (1999). Software Process Support over
the Internet. In Proceedings of the 21st International
Conference on Software Engineering, ICSE ’99, pages
642–645. ACM.
Mellar, H., Peytcheva-Forsyth, R., Kocdar, S., Karadeniz,
A., and Yovkova, B. (2018). Addressing cheating in
e-assessment using student authentication and author-
ship checking systems: teachers’ perspectives. Inter-
national Journal for Educational Integrity, 14.
Moser, R., Pedrycz, W., and Succi, G. (2008a). A Compara-
tive Analysis of the Efficiency of Change Metrics and
Static Code Attributes for Defect Prediction. In Pro-
ceedings of the 30th International Conference on Soft-
ware Engineering, ICSE 2008, pages 181–190. ACM.
Moser, R., Pedrycz, W., and Succi, G. (2008b). Analysis of
the reliability of a subset of change metrics for defect
prediction. In Proceedings of the Second ACM-IEEE
International Symposium on Empirical Software En-
gineering and Measurement, ESEM ’08, pages 309–
311. ACM.
Moten, J., Fitterer, A., Brazier, E., Leonard, J., and Brown,
A. (2013). Examining online college cyber cheating
methods and prevention measures. Electronic Journal
of e-Learning, 11.
Mus
´
ılek, P., Pedrycz, W., Sun, N., and Succi, G. (2002).
On the Sensitivity of COCOMO II Software Cost Es-
timation Model. In Proceedings of the 8th Interna-
tional Symposium on Software Metrics, METRICS
’02, pages 13–20. IEEE Computer Society.
Ochoa, A. and Wagholikar, A. (2006). Use of data min-
ing to determine cheating in online student assess-
ment. Electronics, Robotics and Automotive Mechan-
ics Conference, 1.
Parks, R., Lowry, P., Wigand, R., Agarwal, N., and Therese,
W. (2020). Why students engage in cyber-cheating
through a collective movement: A case of deviance
and collusion. Computers & Education (C&E).
ENASE 2021 - 16th International Conference on Evaluation of Novel Approaches to Software Engineering
482

Paulson, J. W., Succi, G., and Eberlein, A. (2004). An em-
pirical study of open-source and closed-source soft-
ware products. IEEE Transactions on Software Engi-
neering, 30(4):246–256.
Pedrycz, W., Russo, B., and Succi, G. (2011). A model
of job satisfaction for collaborative development pro-
cesses. Journal of Systems and Software, 84(5):739–
752.
Pedrycz, W., Russo, B., and Succi, G. (2012). Knowl-
edge Transfer in System Modeling and Its Realization
Through an Optimal Allocation of Information Gran-
ularity. Appl. Soft Comput., 12(8):1985–1995.
Pedrycz, W. and Succi, G. (2005). Genetic granular classi-
fiers in modeling software quality. Journal of Systems
and Software, 76(3):277–285.
Petrinja, E., Sillitti, A., and Succi, G. (2010). Compar-
ing OpenBRR, QSOS, and OMM assessment models.
In Open Source Software: New Horizons - Proceed-
ings of the 6th International IFIP WG 2.13 Confer-
ence on Open Source Systems, OSS 2010, pages 224–
238, Notre Dame, IN, USA. Springer, Heidelberg.
Ronchetti, M., Succi, G., Pedrycz, W., and Russo, B.
(2006). Early estimation of software size in object-
oriented environments a case study in a cmm level 3
software firm. Information Sciences, 176(5):475–489.
Rossi, B., Russo, B., and Succi, G. (2010). Modelling Fail-
ures Occurrences of Open Source Software with Reli-
ability Growth. In Open Source Software: New Hori-
zons - Proceedings of the 6th International IFIP WG
2.13 Conference on Open Source Systems, OSS 2010,
pages 268–280, Notre Dame, IN, USA. Springer, Hei-
delberg.
Rossi, B., Russo, B., and Succi, G. (2012). Adoption of
free/libre open source software in public organiza-
tions: factors of impact. Information Technology &
People, 25(2):156–187.
Scotto, M., Sillitti, A., Succi, G., and Vernazza, T. (2004). A
Relational Approach to Software Metrics. In Proceed-
ings of the 2004 ACM Symposium on Applied Comput-
ing, SAC ’04, pages 1536–1540. ACM.
Scotto, M., Sillitti, A., Succi, G., and Vernazza, T. (2006). A
non-invasive approach to product metrics collection.
Journal of Systems Architecture, 52(11):668–675.
Sillitti, A., Janes, A., Succi, G., and Vernazza, T. (2004).
Measures for mobile users: an architecture. Journal
of Systems Architecture, 50(7):393–405.
Sillitti, A., Succi, G., and Vlasenko, J. (2012). Understand-
ing the Impact of Pair Programming on Developers
Attention: A Case Study on a Large Industrial Exper-
imentation. In Proceedings of the 34th International
Conference on Software Engineering, ICSE ’12, pages
1094–1101, Piscataway, NJ, USA. IEEE Press.
Sillitti, A., Vernazza, T., and Succi, G. (2002). Service
Oriented Programming: A New Paradigm of Software
Reuse. In Proceedings of the 7th International Con-
ference on Software Reuse, pages 269–280. Springer
Berlin Heidelberg.
Skalka, J. and Drlik, M. (2009). Avoiding plagiarism in
computer science e-learning courses. Problems of Ed-
ucation in the 21st Century, 16:95–101.
Srivastava, D. and Bhambhu, L. (2010). Data classification
using support vector machine. Journal of Theoretical
and Applied Information Technology, 6.
Succi, G., Benedicenti, L., and Vernazza, T. (2001a). Anal-
ysis of the effects of software reuse on customer sat-
isfaction in an RPG environment. IEEE Transactions
on Software Engineering, 27(5):473–479.
Succi, G., Paulson, J., and Eberlein, A. (2001b). Prelim-
inary results from an empirical study on the growth
of open source and commercial software products. In
EDSER-3 Workshop, pages 14–15.
Succi, G., Pedrycz, W., Marchesi, M., and Williams, L.
(2002). Preliminary analysis of the effects of pair pro-
gramming on job satisfaction. In Proceedings of the
3rd International Conference on Extreme Program-
ming (XP), pages 212–215.
Succi, G. and Spasojevic, R. (2000a). A Survey on the
Effectiveness of the Internet-Based Facilities in Soft-
ware Engineering Education. In Proceedings of the
13th Conference on Software Engineering Education
& Training, CSEET ’00, pages 66–75. IEEE Com-
puter Society.
Succi, G. and Spasojevic, R. (2000b). Using Internet-Based
Newsgroups in Software Engineering Education. In
Proceedings of the 2000 International Conference on
Simulation and Multimedia in Engineering Educa-
tion (ICSEE 2000), San Diego, CA, USA. Society for
Computer Simulation International.
Sutherland-Smith, W. (2013). Crossing the line: collusion
or collaboration in university group work? Cross-
ing the line: collusion or collaboration in university
group work?, 55:51–58.
Sutton, A. and Taylor, D. (2011). Confusion about collu-
sion: working together and academic integrity. As-
sessment & Evaluation in Higher Education, 36:831–
841.
Valerio, A., Succi, G., and Fenaroli, M. (1997). Domain
analysis and framework-based software development.
SIGAPP Appl. Comput. Rev., 5(2):4–15.
Vernazza, T., Granatella, G., Succi, G., Benedicenti, L.,
and Mintchev, M. (2000). Defining Metrics for Soft-
ware Components. In Proceedings of the World Mul-
ticonference on Systemics, Cybernetics and Informat-
ics, volume XI, pages 16–23.
Yekini, N., Adigun, J., Ojo, O., and Akinwole, A. (2020).
Assessment of adoption of e-learning and m-learning
during covid-19 lockdown in nigeria. Int Aca J Edu
Lte, 1.
Zhang, H. (2004). The optimality of naive bayes. In Pro-
ceedings of the 17th International FLAIRS Confer-
ence.
Toward Understanding Personalities Working on Computer: A Preliminary Study Focusing on Collusion/Plagiarism
483
