
A Comparison of Methods for the Evaluation of
Text Summarization Techniques
Marcello Barbella, Michele Risi
a
and Genoveffa Tortora
b
Department of Computer Science, University of Salerno, Fisciano (SA), Italy
Keywords:
Automatic Text Summarization Algorithms, Extractive, Abstractive, ROUGE Metric, Bert.
Abstract:
Automatic Text Summarization techniques aim to extract key information from one or more input texts au-
tomatically, producing summaries and preserving the meaning of content. These techniques are divided into
two main families: Extractive and Abstractive, which differ for their operating mode. The former picks up
sentences directly from the document text, whilst the latter produces a summary by interpreting the text and
rephrases sentences by incorporating information. Therefore, there is the need to evaluate and verify how close
a summary is to original text. The research question is: how to evaluate the quality of the summaries produced
by these techniques? Different metrics and scores have been proposed in the literature (e.g., ROUGE) for the
evaluation of text summarization. Thus, the main purpose of this paper is to deeply estimate the behaviour
of the ROUGE metric. In particular, we performed a first experiment to compare the metric efficiency for
the evaluation of the Abstractive versus Extractive Text Summarization algorithms while, in a second one, we
compared the obtained score for two different summary approaches: the simple execution of a summarization
algorithm versus the multiple execution of different algorithms on the same text. The conclusions lead to the
following interesting results: ROUGE does not achieve excellent results, because it has similar performance
on both the Abstractive and Extractive algorithms; multiple execution works better than single one most of the
time.
1 INTRODUCTION
Today is available a great deal of textual data, arising
from various sources. Being able to get knowledge
from these, especially from long texts, is an increas-
ingly complex challenge for humans. The informa-
tion technology development, particularly in the Ar-
tificial Intelligence (AI) field, has brought out ever
more sophisticated techniques for managing and pro-
cessing data. New innovative algorithms, inter alia,
are always proposed for the processing and extraction
of the most useful information from texts, even those
written by human.
These techniques, grouped as Automatic Text
Summarization, allow the creation of summaries
composed of key concepts of any input text. In order
to obtain algorithms capable of producing a summary
from a text, these are divided into two main families:
• Extractive: it selects phrases from the input text,
choosing those that best cover all the key informa-
tion, discarding redundancy;
a
https://orcid.org/0000-0003-1114-3480
b
https://orcid.org/0000-0003-4765-8371
• Abstractive: it tries to elaborate a new corpus, us-
ing different and more appropriate words, a differ-
ent semantic composition, so as to output a sim-
pler text.
As can be easily deduced from the above, the
Abstractive Automatic Text Summarization (AATS)
techniques are much more interesting than the Extrac-
tive (EATS) ones. The literature proposes different
approaches for both methodologies, exploiting super-
vised and unsupervised algorithms (Dalal and Malik,
2013). The main question is to evaluate the quality of
the summaries produced by these methods. The dif-
ficulty in comparing one summary with another, re-
quires a metric that is easily comparable and as possi-
ble unbiased.
ROUGE (Recall-Oriented Understudy Gisting
Evaluation) is the most used topic evaluation metric.
It is based on the overlapping (expressed as a numeric
value) of words between the system summary and the
human one, without considering their semantic and
syntactic correctness.
The current literature is more focused on finding
new summarization algorithms rather than on those to
200
Barbella, M., Risi, M. and Tortora, G.
A Comparison of Methods for the Evaluation of Text Summarization Techniques.
DOI: 10.5220/0010523002000207
In Proceedings of the 10th International Conference on Data Science, Technology and Applications (DATA 2021), pages 200-207
ISBN: 978-989-758-521-0
Copyright
c
2021 by SCITEPRESS – Science and Technology Publications, Lda. All rights reserved

evaluate them. This work, instead, tends to compare
various algorithms on a standard dataset and with a
well-defined methodology. In particular, the goal con-
sists of two distinct research activities: i) evaluate the
performance of the ROUGE metric on the results of
the Abstractive and Extractive algorithms; ii) test the
efficiency of its score on two different summarization
methods.
By definition, in order to produce a summary,
EATS choose parts from the original text, while
AATS tend to use new words so, the former should
perform much better because they may have a greater
overlapping of words. Is done a first experiment to
prove this hypothesis. A second one, instead, involves
a test on two different methodologies: the simple exe-
cution of a text summarization (TS) algorithm versus
a multiple sequential execution on the same text, in
order to evaluate by the chosen metric, which of the
technique is better if the compression rate increases.
The paper is structured as follows: In Section 2,
the most recent technologies proposed by the litera-
ture on Abstractive and Extractive methods are ex-
plored. Section 3 shows the experiment design, taking
care to ensure its reproducibility. The experiment is
conducted on a standard dataset
1
. Section 4 discusses
the experiment results, whilst in Section 5 the threats
to validity are discussed. Finally, Section 6 draws the
conclusions as well as outlines some ideas for future
works.
2 STATE OF THE ART
As seen in the previous section, there are two types of
approaches to TS: Extractive and Abstractive. Below
are explored the most common techniques for the two
types, trying to understand what is the best way of
evaluation of a system-generated summary.
(de Oliveira, 2005) shows by specific experiments,
that for a human, the summary quality evaluation is
subjective, because it depends on individual criteria
of relevance, comprehensibility and readability.
Unfortunately, often the evaluation metrics of-
fer a statistical approach, counting the overlapping
of words between the generated summary and the
original text, not considering the semantic mean-
ing of what the text offers. In this work, the
ROUGE metric for the experiment results is consid-
ered (but there are various other evaluation methods
such as Pyramid (Nenkova and Passonneau, 2004)
and SSAS (Vadapalli et al., 2017; Gupta and Gupta,
2019)).
1
CNN/Daily-Mail is mostly used by researchers to eval-
uate new summarization techniques.
2.1 Extractive Method
Most recent studies, particularly in Deep Learning
(DL) and AI fields, have led to consolidate innovative
and more sophisticated EATS techniques. Here are
described some of the most interesting ones found in
literature, including those based on Neural Networks,
Graphs and Semantic approaches.
In (Keyvanpour et al., 2019) are clearly explained
the basic steps of a TS task. These include a pre-
processing phase, a sentence scoring phase and a fi-
nal phase of text extraction and summary generation.
In order to represent a text with the aim of text sum-
marization, the literature suggests some methods, by
the use of vectors and matrices that will represent the
features extracted from the text.
Neural Network Approaches. Neural networks are
widely used especially for the generation of complex
features starting from the input text. (Suleiman and
Awajan, 2019) gives an overview of the most com-
mon algorithms used today: the Restricted Boltz-
mann Machine (Verma and Nidhi, 2017; Rezaei et al.,
2019), particular neural networks composed of an in-
put layer and a hidden layer, where the connection
occurs only between neurons of different layers, the
Variation Auto-Encoder (Yousefi-Azar and Hamey,
2017) based on a neural network consisting of an en-
coder, a decoder and a loss function and the Recurrent
Neural Networks (Chen and Le Nguyen, 2019) made
up of a sequence of hidden layers where, for the TS
field, a sequence of words is given as input to the net-
work, while output is formed by the summary words.
Graph Approaches. Instead in (Janjanam and
Reddy, 2019) is introduced an approach for TS us-
ing Graphs. A popular TS model based on the graph
approach is PageRank. It is based on Hits algorithms
developed by Google (Page et al., 1999). Other inter-
esting approaches in the literature see the use of the
graph as a semantic network between sentences (Han
et al., 2016) or as input for a convolutional net-
work (Yasunaga et al., 2017).
Semantic Approaches. Many commonly used TS
models are based on statistical methods, which usu-
ally do not consider the semantic or contextual mean-
ing of the analyzed text. But through the Semantic
Role Labeling, sentences in a document are well clus-
tered, facilitating the formation of groups of similar
elements. In (Liu et al., 2018), authors used Seman-
tic Analysis to represent sentences in an Abstractive
mode, generating summaries with promising results.
Instead, in (Khan et al., 2018) is established that se-
mantic knowledge of the text is fundamental also in
the methodology of AATS.
A Comparison of Methods for the Evaluation of Text Summarization Techniques
201

2.2 Abstractive Method
In recent years, after the rapid expansion of neural
networks and DL techniques, researchers have built a
solid base for the creation of Abstractive algorithms,
which goes beyond the classical approaches of Nat-
ural Language Processing (NLP). In particular, DL
models like those based on seq2seq and attention-
model, have brought the study of AATS to a high
level, sometimes obtaining better results than Extrac-
tive methods.
Seq2seq Model. It is a popular neural network model
based on the encoder-decoder architecture. Gener-
ally, in the literature, particular types of neural net-
works are chosen as internal components for the en-
coder and decoder, such as Recurrent Neural Net-
work (RNN) (Nallapati et al., 2016), Gated Recurrent
Neural Network (GRU) or Long Short Term Memory
(LSTM). The latter are the most used because they de-
termine long-term dependencies, overcoming the gra-
dient problem.
Transformer Network. In (Vaswani et al., 2017)
is proposed a new network architecture, called
Transformer, based exclusively on the attention-
mechanism. It avoids the use of recurrence, as has
been done so far by sequence modeling, providing a
new approach that allows the dependencies modeling
without the consideration of their distance in the input
or output sequence.
2.3 ROUGE Metric
The ROUGE measure identifies a set of different in-
dexes to quantify the quality of a system summary.
In literature, the most used metrics are ROUGE-
1, ROUGE-2 and ROUGE-L based on the different
granularity of the analyzed texts. Indeed, ROUGE-1
refers to the overlapping of unigrams between the sys-
tem summary and the reference summary; ROUGE-
2 to the overlapping of bigrams; instead ROUGE-L
measures the longest common word sequence, com-
puted by the Longest Common Subsequence (LCS)
algorithm.
2.4 Bert
In (Devlin et al., 2018) is introduced Bert (Bidirec-
tional Encoder Representations from Transformers).
Its model architecture consists of a bidirectional mul-
tilayer Transformer encoder, based on the implemen-
tation of (Vaswani et al., 2017).
3 EXPERIMENT DESIGN
3.1 Scope Definition
The proposed experiment has two research questions
(RQs). The first is inspired by a wide study of the lit-
erature, which has raised some doubts regarding to the
most commonly used metric to evaluate the quality of
Automatic Text Summarization algorithms. In partic-
ular, this work focuses on understanding how well the
ROUGE metric score is actually good for evaluating
the quality of a summary, both for Extractive and Ab-
stractive methods (as explained above the Extractive
methods should produce better results). The second
target is based on exploring how better it is to use a
multiple execution of TS algorithms instead of a sin-
gle execution, based on the ROUGE scores. Summing
up:
• RQ1: How different is the ROUGE score achieved
by the EATS methods compared to the AATS
ones? Can this metric score be representative of
the quality of a summary generated by a text sum-
marization algorithm?
Object of study is the ROUGE score obtained in
both the EATS and AATS algorithms. Purpose is
to estimate reliability and efficiency of this metric
in both cases.
• RQ2: How much differs the multiple execution
of a summary (execution in sequence of two TS
algorithms on the same text, where the output of
the first is used as input for the second) compared
to the single execution (the summary is obtained
with a single execution of an algorithm)? Is the
ROUGE score relevant to evaluate the two meth-
ods?
Object of study is related to the multiple and single
execution of TS algorithms. Purpose is to evalu-
ate the quality of the generated summary by the
two techniques against the ROUGE score.
For both RQs: Perspective is a researcher’s point of
view and Context of experiment execution is the use
of TS algorithms on a standard texts dataset.
3.2 Experiment Planning
The planning phase shows in detail the various steps
followed for the experiment.
Context Selection. The experiment was conducted
in off-line mode. The goal for the first RQ, is to com-
pare the validity and accuracy of the ROUGE met-
ric for the two types of Automatic Text Summariza-
tion approaches. For the second RQ instead, will be
DATA 2021 - 10th International Conference on Data Science, Technology and Applications
202
compared two TS methodologies to evaluate their ef-
ficiency by using the same metric.
Hypotheses Formulation. For the statistical analy-
sis of the experiment, two hypotheses are formulated:
the null and the alternative, with the aim to confirm
or reject one of them. Formal descriptions of both
hypotheses for the two RQs are provided in the fol-
lowing, taking into consideration the ROUGE metric
for the comparison.
• RQ1 Null: AATS methods have different perfor-
mances from the EATS ones. (This is because the
Extractive methods use in the output summary,
parts of the original text that should provide a
different overlap ratio of N-grams, compared to
the Abstractive methods, which use new words in
the generated summary and therefore different N-
grams).
H
0
: µ
ROUGE Ext
6= µ
ROUGE Abs
(1)
where µ is the mean and ROUGE the score of each
summary.
• RQ1 Alternative: The AATS methods have almost
the same performance as the EATS ones. (This
may show that the ROUGE metric is not suitable
for the system generated summary evaluation).
H
A
: µ
ROUGE Ext
= µ
ROUGE Abs
(2)
• RQ2 Null: Multiple executions of the TS algo-
rithms on the same text, lead to less or equal result
of a single execution on the same text.
H
0
: µ
ROUGE Multiple
≤ µ
ROUGE Single
(3)
• RQ2 Alternative: Multiple executions of the TS
algorithms on the same text, lead to better results
than those of a single execution on the same text.
H
A
: µ
ROUGE Multiple
> µ
ROUGE Single
(4)
where µ is the mean and ROUGE the score of each
summary.
Variable Selection. A fundamental step during the
experiment planning, is the variables selection. Inde-
pendent variables are the ones that we can control and
modify during the experiment. The dependent vari-
ables instead, measure the effect of the experiment on
the different combinations of independent variables.
Our RQs are:
• RQ1 Independent Variables: the EATS and AATS
methods. For each of these, different algorithms
will be executed.
• RQ1 Dependent Variables: The ROUGE score for
the output of each algorithm. The results will
be averaged in order to have a single comparable
measure.
• RQ2 Independent Variables: TS techniques that
included single and multiple executions of the
summary. For each of these, will be executed dif-
ferent algorithms in different combinations.
• RQ2 Dependent Variables: The ROUGE score for
the output of each algorithm. The results will
be averaged in order to have a single comparable
measure.
Subjects Selection. For both RQ1 and RQ2, the
sampling of the subjects follows the Simple Random
Sampling model, where the subjects are randomly
chosen from a list of the population. In this case,
therefore, the texts to be summarized are randomly
chosen from the referenced dataset composed of ap-
proximately 287.000 elements. For computational ef-
ficiency, each algorithm is run on a block of 1000
texts. Each of these selected texts is submitted to all
algorithms, in order to have an accurate comparison
of the results on the same input. In the first experi-
ment, a total of 40.000 summaries are executed, so 40
blocks of 1000 texts for each one. In the second ex-
periment, are considered only 1000 texts, due to the
computational complexity and the long time required
to the conclusion of the experiment.
Design Type Choice and Tools. In this section, is
described the test methodology.
• Principle General Design. The made choice is
to use randomization and balancing techniques.
Tests are performed by random blocks of data.
For the balancing design principle, each test will
be run with a block of 1000 texts to be analyzed.
This allows great performances and valid statisti-
cal results for each test.
• Standard Design Type. For RQ1, is chosen a fac-
tor with two treatments as Design Type. Indeed,
by these experiments, we want to compare the
EATS and AATS methods. Also for RQ2 is cho-
sen the same Design Type, that is a factor with two
treatments. In particular, we want to compare the
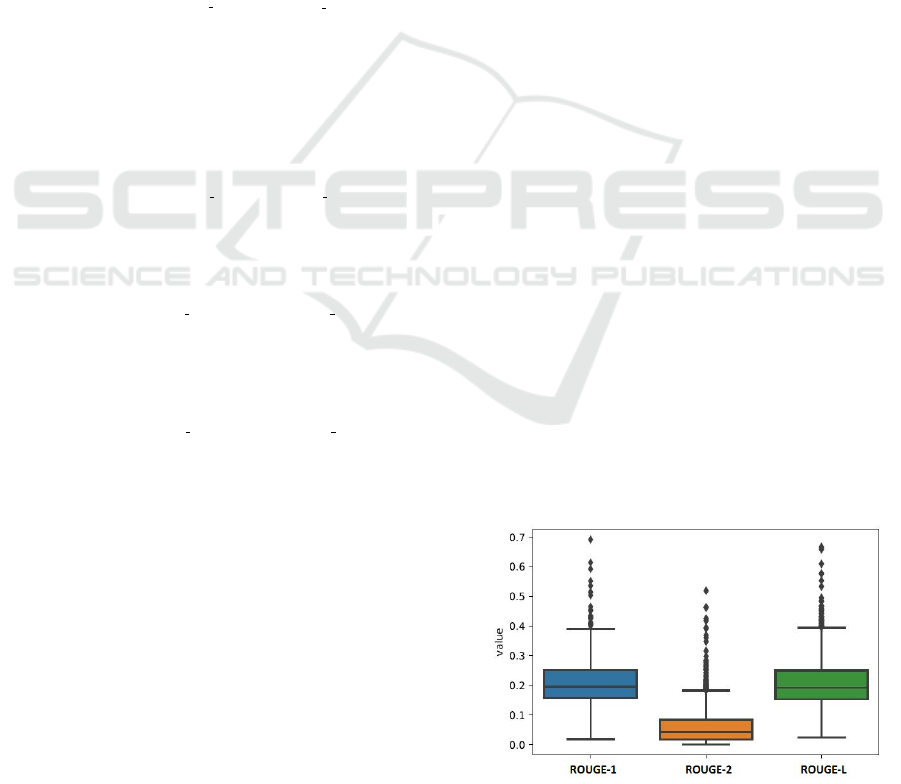
Figure 1: Boxplot of ROUGE metric scores computed on
1000 summaries by TextRank algorithm.
A Comparison of Methods for the Evaluation of Text Summarization Techniques
203
performance of the summary obtained by a sin-
gle versus a multiple execution. For each exper-
iment, are used all the considered algorithms. In
particular, for the multiple tasks, we consider the
execution of an EATS algorithm followed by an
execution of an AATS one (and vice versa). For
the experiments execution, has been developed a
particular software using Python.
3.3 Operation Phase
The experiment operation phase consists of three
steps:
Preparation. For the experiment to conduct, in this
phase must be checked the correctness of: the code
that will extract the random texts from the dataset, the
scores of the ROUGE metric and the algorithm set-
ting. It is also important to set up the code for collect-
ing the results. All calculated scores are placed in a
dataset containing the average results for each block
of summaries.
Execution. The experiment lasted several days, due
to the computation time required to run tests. For
RQ1, the algorithms worked in parallel, grouped ac-
cording to the TS methodology and fed by the same
input texts. For RQ2 was chosen a sequential com-
putation of the scores. Initially, for both RQs, dataset
texts were randomly selected and summarized by var-
ious algorithms. Finally, all the summaries were ana-
lyzed with the ROUGE metric.
Data Validation. Data validation was done by ran-
domly checking some entries and making sure of the
consistency of the CSV file. It was also checked
whether the sample’s ROUGE score respected the
standard expected from the algorithm authors.
4 RESULTS ANALYSIS
In this section are discussed, analyzed and interpreted
the two experiments results, highlighted by some
graphs, and finally verifying their statistical validity.
4.1 Descriptive Analysis
Starting from the hypothesis of same distribution for
each block of summaries, since texts are randomly
Table 1: Descriptive statistics.
ROUGE Metric Mean Median Standard deviation
ROUGE-1 0.205 0.194 0.002
ROUGE-2 0.059 0.041 0.002
ROUGE-L 0.204 0.189 0.003
chosen from dataset, below are shown some key fea-
tures of the achieved results. For this purpose, is ana-
lyzed a random execution of TextRank algorithm. Ta-
ble 1 shows mean, median and standard deviation val-
ues for the three types of ROUGE metrics to better
understand the subsequent plots.
First of all, it’s analyzed the results distribution by
a boxplot and a histogram of randomly results. (Each
result is referred to a set of 1000 summaries, which
differs for algorithm and input text). Figure 1 shows
1000 scores for ROUGE-1, ROUGE-2 and ROUGE-
L, taken from the execution of TextRank algorithm.
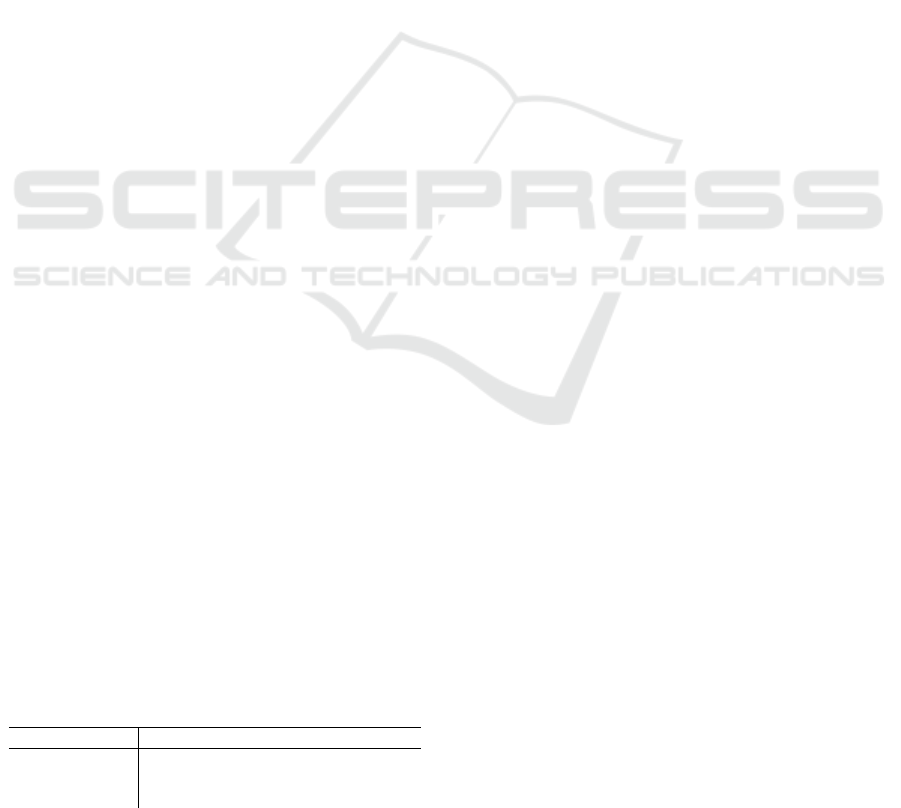
Figure 2 shows each ROUGE metric distribution
by three representative histograms. As anticipated
by boxplots, ROUGE-1 and ROUGE-L approximate
quite well the normal distribution. This guarantees the
good distribution of data points along all the observa-
tions, and allows us to consider the mean as a valid
representation measure. So, as highlighted, when be-
low is mentioned the ROUGE metric for the evalua-
tion of the experiments, the scores will be referred to
the ROUGE-1.
4.2 Results
4.2.1 RQ1 Results
Aim of the first research question was to estimate the
effectiveness of the ROUGE metric on evaluating TS
algorithms. The comparison was made on the results
of both the EATS and AATS methods, on randomly
chosen texts by the experiment design guidelines.
For this purpose have been considered 40 blocks,
everyone composed of 1000 summaries. To represent
results, was made an average within each block and
subsequently an overall average for each algorithm.
Figure 3 reports the average score for the 7 exam-
ined algorithms related to ROUGE metric. The first
four (i.e., TextRank, Lsa, Luhn and LexRank) are Ex-
tractive, and the last three (i.e., GloVe, Word2Vec,
Doc2Vec) are Abstractive. As we can see, the aver-
age mean is very close to each algorithm. In gen-
eral, LexRank is the best performer algorithm, scoring
about 10% better than the others. On the other hand,
the Abstractive algorithms tend to have very similar
values and, even if slightly, all their scores below the
mean.
Bert is one of the most innovative TS algorithms in
recent years, and it leads to better results. It is avail-
able for both the Extractive and the Abstractive ap-
proaches and results for each of them are very close.
Table 2 summarizes all the algorithms used in this
experiment, reporting the relative mean and standard
deviation, for ROUGE metric.
DATA 2021 - 10th International Conference on Data Science, Technology and Applications
204
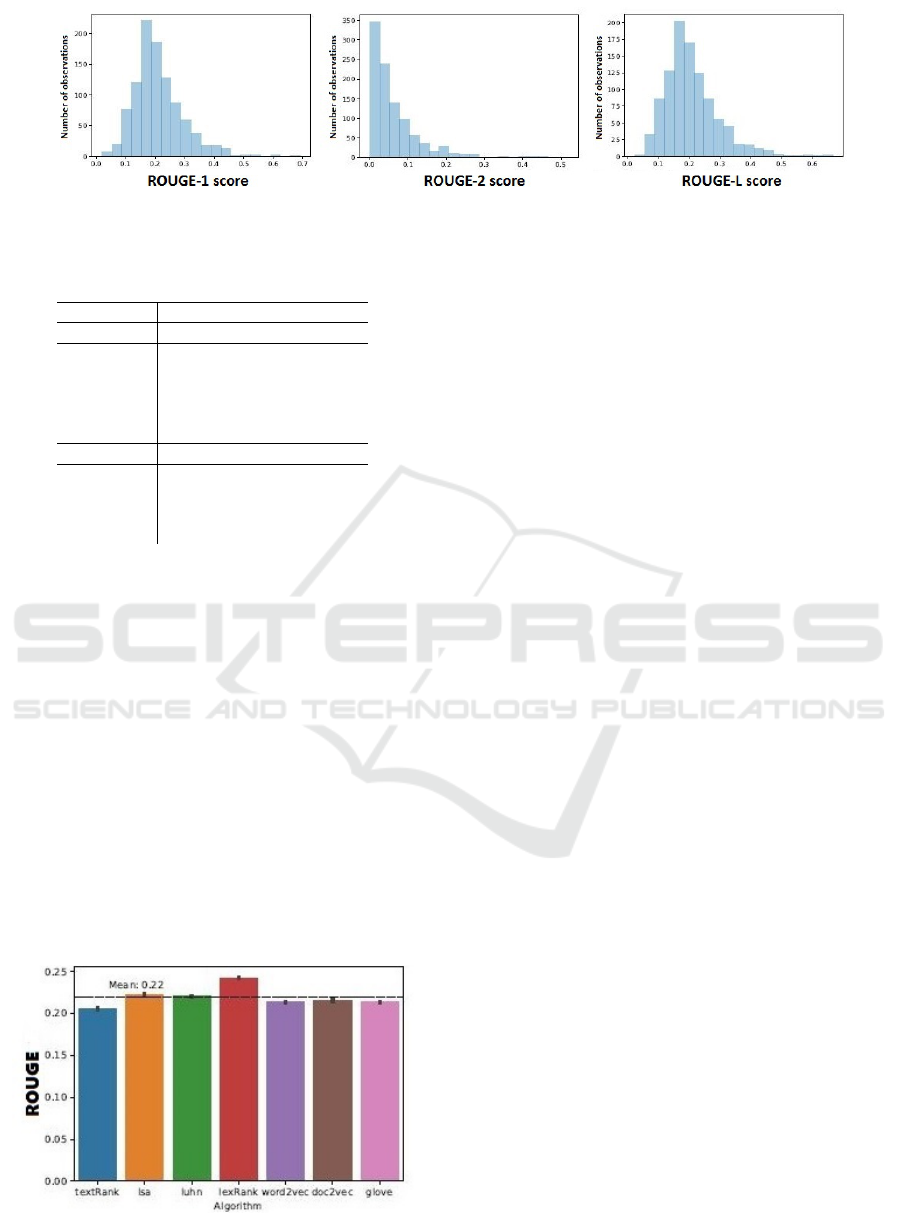
Figure 2: Histogram showing the data distribution for ROUGE-1, ROUGE-2, ROUGE-L scores using TextRank algorithm.
Table 2: Mean and standard deviation for all the used algo-
rithms and ROUGE metric.
Algorithm ROUGE
Extractive Mean Standard deviation
TextRank 0.205 0.002
Lsa 0.223 0.004
Luhn 0.220 0.003
LexRank 0.242 0.003
Bert Ext. 0.284 0.099
Abstractive Mean Standard deviation
Word2Vec 0.213 0.003
Doc2Vec 0.215 0.002
GloVe 0.213 0.003
Bert Abs. 0.288 0.099
A statistical validity test to confirm or reject the
hypothesis has been also conducted. To this end, was
performed the t-test on the distribution of results for
each summary, paired for Abstractive and Extractive.
The freedom degrees for this test are equal to the ob-
served population of 40.000 summaries. Test results
provide a p-value = 2.2e-16, below the required 0.05
for the experiment’s statistical validity. This confirms
the alternative hypothesis of equality between the Ex-
tractive and Abstractive ROUGE scores.
The tested idea was that Extractive approaches
should work much better than Abstractive ones. Re-
sults, instead, showed that this assumption is not true.
In most cases, both algorithms worked similarly. The
reasons can be very different, and confirm the as-
sumption that ROUGE is not a good metric to evalu-
ate TS algorithms. Indeed, remembering that ROUGE
Figure 3: ROUGE average scores of the experiment con-
ducted on Abstractive and Extractive algorithms.
compares a system-generated summary with a human
one, and that the score is given by a statistical cal-
culation relating to the N-grams overlapping between
the two texts, by this logic the more the summaries
use different words, the more the ROUGE metric will
perform poorly. But this system does not consider
the semantics of sentences. So, the Abstractive meth-
ods would be at a strong disadvantage and it could be
deduced that algorithms that take random sentences
from the original text work very well.
To reinforce the thesis that ROUGE is not much
representative, we can also consider the gold standard
that is the human-generated summary. It should be
the best available summary of a text (and is the opti-
mal target of our algorithms). But if we consider dif-
ferent human-generated summaries, starting from the
same source text, the results can be widely different
but all valid and acceptable. However, if we calculate
the ROUGE score between two gold standards, this
would not satisfy us.
ROUGE does not take care of all these consider-
ations and can direct us towards results that do not
represent the key quality of a summary. So, the ex-
periments showed that the Abstractive algorithms per-
form similarly to the Extractive ones, considering the
ROUGE score. This confirms that ROUGE can be
considered a bad method for evaluating summaries
generated by TS algorithms.
4.2.2 RQ2 results
Aim of the second research question was to analyze
the achieved results of single versus multiple sum-
mary executions. For each block of summaries, is
computed the ROUGE score average on both a sum-
mary and the total of compared summaries. Two types
of multiple execution were considered:
1. Extractive algorithms on Abstractive input.
2. Abstractive algorithms on Extractive input.
Figure 4 shows the two obtained results. We can
clearly note that multiple algorithms executions per-
formed better than single ones almost always. Only
exception is for Bert, which in both cases obtained
A Comparison of Methods for the Evaluation of Text Summarization Techniques
205
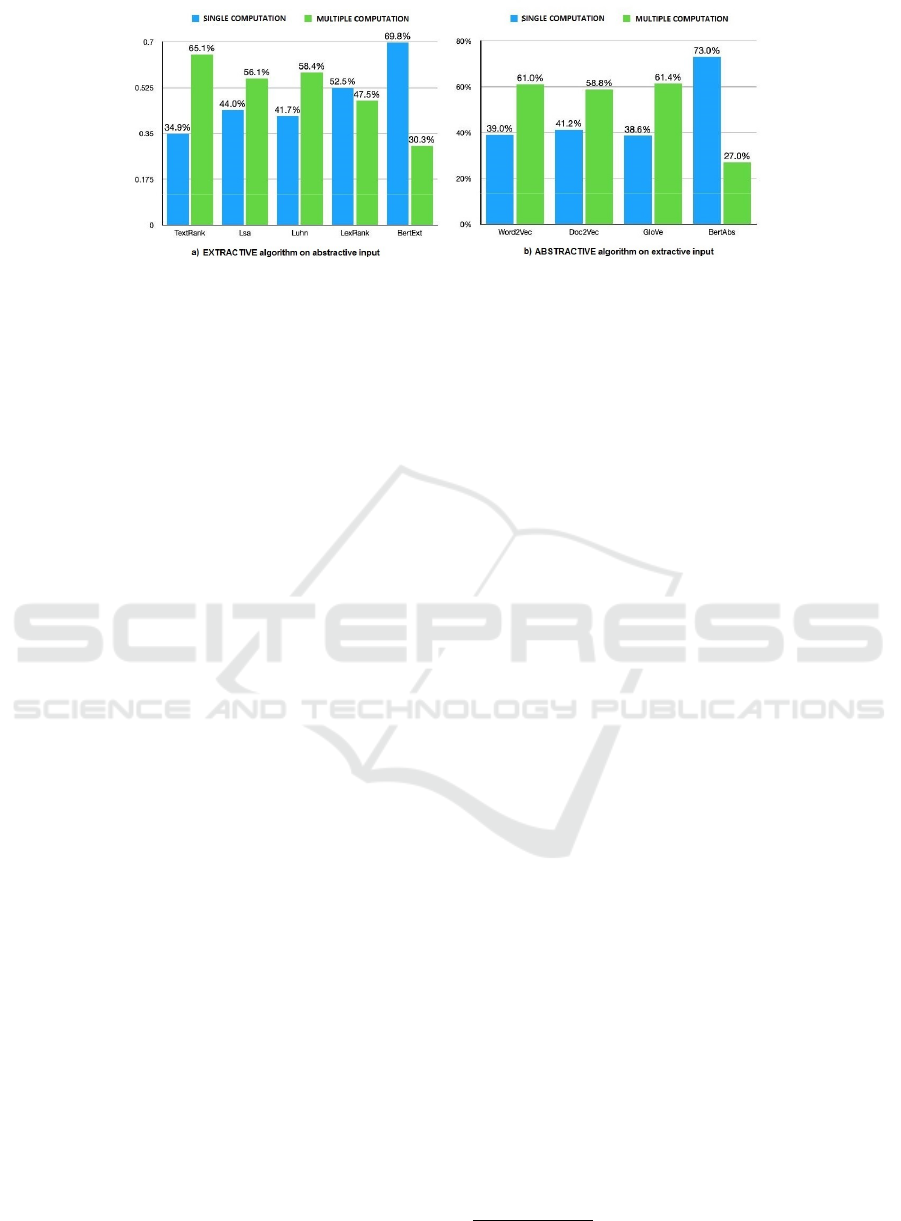
Figure 4: Results comparison for summaries between single computation (blue) and multiple computation (green) for each
methodology.
the best scores in single execution (confirmed by the
average of the ROUGE score shown in the two plots
too).
For both types of experiment is performed a t-test,
to ensure the statistical validity. This test was con-
ducted considering the differences between the Ex-
tractive and Abstractive methodologies (see Fig. 4).
For each test, the multiple execution approach of a
summary is compared with the single one. The popu-
lation is made up of 1000 paired summaries.
Results are quite different one from another: t-test
for the Extractive method scored a p-value of 0.4, so
there is no statistical validity for this experiment. In-
stead, t-test for the Abstractive method obtains a p-
value of 0.018, less than the required 0.05 for statis-
tical validity so, in this case, we can confirm the al-
ternative hypothesis, that the multiple execution per-
forms better than the single execution. These results
are very interesting, and they shows that the multi-
ple execution method worked better than the single
one in all algorithms, except for Bert (see Fig. 4b).
A possible explanation can be attributed to the com-
pression ratio obtained from multiple algorithms runs:
a first execution can remove redundant information,
and a second one compresses key concepts into a
better-scoring summary. This demonstrates that the
compression ratio has led algorithms to preserve as
much information as possible of the original text for
putting them in the output summary. On the other
hand, Bert produces different results. The average of
the achieved score is higher than all the other algo-
rithms. Of course, Bert is actually one of the best
approaches that comes from the state of the art in text
summarization. It uses a new architecture of a deep
neural network, that is far from the other algorithms
tested in this experiment. Unlike what was expected,
the single execution on Bert performs over 30% com-
pared to the multiple one.
Having a more compressed reference summary
can take advantage from the ROUGE score, because
the ratio of overlapping N-grams, especially if well
selected between two algorithms, can lead to dis-
torted results. In fact, we must think that although the
ROUGE score is very good for multiple executions,
must be seriously considered also the summary read-
ability. In this experiment, we therefore confirmed the
alternative hypothesis. In most cases, multiple runs
score better than single ones.
5 THREATS TO VALIDITY
The results validity of an experiment can be compro-
mised by various types of threats: the Conclusion, In-
ternal, Construct and External Validity. In this section
we see these threats for RQ1 (extendable to RQ2).
Conclusion Validity. Having comparable results for
all experiments successfully closed, there is no threat
of low statistical power. By the choice of doing a
large number of tests for each algorithm with after the
computing of results average of each block of sum-
maries, are reduced the violation hypothesis of statis-
tical tests and the random heterogeneity of subjects
and also avoided Fishing. Finally the ROUGE metric
guarantees the reliability of the measurements.
Internal Validity. The experiment results are all re-
producible, so there are not risks of historical and
maturation threats. By an in-depth study of software
packages used for tests, are mitigated also the instru-
mentation threats.
Construct Validity. The use of the ROUGE metric
allows a numeric comparison, so it neutralizes the
inadequate preoperative explanation of constructs.
Since we are evaluating a special measure for texts
summaries quality, is not possible the use of a second
metric, so there could be a risk relative to the mono-
method bias in case of measurement bias
2
. Others
threats of this type are not considered because are re-
lated to human behaviors.
2
“Measurement bias” refers to any systematic or non-
random error that occurs in a study data collection.
DATA 2021 - 10th International Conference on Data Science, Technology and Applications
206

External Validity. For the random selection of the
texts to be summarized, is reduced the threat of in-
teraction of selections and treatments (that is having
a non-representative population sample). The lack of
a large calculation power does not allow the use of
optimal algorithms for the topic. For this, a series of
algorithms was used to have a comparison of their re-
sults, reducing the threat of interaction of settings and
treatments. Finally, the only threat to interaction of
history and treatment can come from new and more
powerful TS methods.
6 CONCLUSIONS
The main goal of this paper was to doubt on the valid-
ity of the ROUGE evaluation metric for TS algorithms
and after, try to understand if a single execution of
an algorithm led to better results than a multiple ex-
ecution one. From our experiments, we deduced that
ROUGE is not efficient, and that a multiple execu-
tion leads to better results than the single one (also if
evaluated by ROUGE). Summing up, a good ROUGE
score is not synonymous of good summary quality, if
we consider readability and syntactic correctness too.
For future developments, it will be possible to
extend the analysis to other algorithms, also if less
known. The goal may be to discover new approaches
that can directly evaluate the summary quality, avoid-
ing statistical measurements. One idea could be the
use of NLP algorithms for text comprehension. An-
other scenario may be the evaluation of summaries re-
lated to a specific topic, training different algorithms
with data from a narrow interest field, in order to have
interesting and more accurate results.
REFERENCES
Chen, L. and Le Nguyen, M. (2019). Sentence selective
neural extractive summarization with reinforcement
learning. In 11th Intl. Conf. on Knowl. and Sys. Eng.
(KSE), pages 1–5. IEEE.
Dalal, V. and Malik, L. (2013). A survey of extractive and
abstractive text summarization techniques. In 6th Inlt.
Conf. on Emerging Trends in Eng. and Tech., pages
109–110. IEEE.
de Oliveira, P. C. F. (2005). How to evaluate the ‘goodness’
of summaries automatically. PhD thesis, University
of Surrey.
Devlin, J., Chang, M.-W., Lee, K., and Toutanova, K.
(2018). Bert: Pre-training of deep bidirectional trans-
formers for language understanding. arXiv preprint
arXiv:1810.04805.
Gupta, S. and Gupta, S. (2019). Abstractive summarization:
An overview of the state of the art. Expert Systems
with Applications, 121:49–65.
Han, X., Lv, T., Hu, Z., Wang, X., and Wang, C. (2016).
Text summarization using framenet-based semantic
graph model. Sci. Prog., 2016.
Janjanam, P. and Reddy, C. P. (2019). Text summariza-
tion: An essential study. In Intl. Conf. on Compu-
tational Intelligence in Data Science (ICCIDS), pages
1–6. IEEE.
Keyvanpour, M. R., Shirzad, M. B., and Rashidghalam,
H. (2019). Elts: A brief review for extractive
learning-based text summarizatoin algorithms. In 5th
Intl. Conf. on Web Research (ICWR), pages 234–239.
IEEE.
Khan, A., Salim, N., Farman, H., Khan, M., Jan, B., Ah-
mad, A., Ahmed, I., and Paul, A. (2018). Abstractive
text summarization based on improved semantic graph
approach. International Journal of Parallel Program-
ming, 46(5):992–1016.
Liu, F., Flanigan, J., Thomson, S., Sadeh, N., and
Smith, N. A. (2018). Toward abstractive summariza-
tion using semantic representations. arXiv preprint
arXiv:1805.10399.
Nallapati, R., Zhou, B., Gulcehre, C., Xiang, B.,
et al. (2016). Abstractive text summarization us-
ing sequence-to-sequence rnns and beyond. arXiv
preprint arXiv:1602.06023.
Nenkova, A. and Passonneau, R. J. (2004). Evaluating con-
tent selection in summarization: The pyramid method.
In Human Lang. Tech. Conf. of the North American
Ch. of the Assoc. for Comput. Ling. (HLT-NAACL),
pages 145–152.
Page, L., Brin, S., Motwani, R., and Winograd, T. (1999).
The pagerank citation ranking: Bringing order to the
web. Technical Report 1999-66, Stanford InfoLab.
Rezaei, A., Dami, S., and Daneshjoo, P. (2019). Multi-
document extractive text summarization via deep
learning approach. In 5th Conf. on Knowledge Based
Engineering and Innovation (KBEI), pages 680–685.
IEEE.
Suleiman, D. and Awajan, A. A. (2019). Deep learn-
ing based extractive text summarization: Approaches,
datasets and evaluation measures. In 6th Intll. Conf. on
Social Networks Analysis, Manag. and Sec. (SNAMS),
pages 204–210. IEEE.
Vadapalli, R., Kurisinkel, L. J., Gupta, M., and Varma, V.
(2017). Ssas: semantic similarity for abstractive sum-
marization. In 8th Intl. Joint Conf. on Natural Lang.
Proc., pages 198–203.
Vaswani, A., Shazeer, N., Parmar, N., Uszkoreit, J., Jones,
L., Gomez, A. N., Kaiser, Ł., and Polosukhin, I.
(2017). Attention is all you need. Adv. in Neural Inf.
Processing Systems, 30:5998–6008.
Verma, S. and Nidhi, V. (2017). Extractive sum-
marization using deep learning. arXiv preprint
arXiv:1708.04439.
Yasunaga, M., Zhang, R., Meelu, K., Pareek, A., Srini-
vasan, K., and Radev, D. (2017). Graph-based neu-
ral multi-document summarization. arXiv preprint
arXiv:1706.06681.
Yousefi-Azar, M. and Hamey, L. (2017). Text summariza-
tion using unsupervised deep learning. Expert Systems
with Applications, 68:93–105.
A Comparison of Methods for the Evaluation of Text Summarization Techniques
207
