
Similarity of Software Libraries: A Tag-based Classification Approach
Maximilian Auch
1 a
, Maximilian Balluff
1 b
, Peter Mandl
1 c
and Christian Wolff
2 d
1
University of Applied Sciences Munich, Lothstraße 34, 80335 Munich, Germany
2
University of Regensburg, Universit
¨
atsstraße 31, 93053 Regensburg, Germany
Keywords:
Software Libraries, Classification, Tags, Similarity, Na
¨
ıve Bayes, Logistic Regression, Random Forest, Neural
Network.
Abstract:
The number of software libraries has increased over time, so grouping them into classes according to their
functionality simplifies repository management and analyses. With the large number of software libraries,
the task of categorization requires automation. Using a crawled dataset based on Java software libraries from
Apache Maven repositories as well as tags and categories from the indexing platform MvnRepository.com,
we show how the data in this set is structured and point out an imbalance of classes. We introduce a class
mapping relevant for the procedure, which maps the libraries from very specific, technical classes into more
generic classes. Using this mapping, we investigate supervised machine learning techniques that classify
software libraries from the dataset based on their available tags. We show that a tag-based approach to classify
libraries with an accuracy of 97.46% can be achieved by using neural networks. Overall, we found techniques
such as neural networks and na
¨
ıve Bayes more suitable in this use case than a logistic regression or a random
forest.
1 INTRODUCTION
Nowadays, more and more software libraries are used
in software projects to query other services, to build
APIs according to specifications, to simplify code
and file handling, to integrate finished components, to
simplify testing, analyze code, or to integrate complex
processing, for example in case of distributed calcu-
lations. By using libraries, typically less code needs
to be written and therefore less code need to be tested
and maintained. Thung et al. (Thung et al., 2013)
found in 2013 that 93.3% of software projects exam-
ined in their study use third-party libraries. In aver-
age, these projects included 28 third-party libraries
each.
Within the context of our research project, it is
planned to identify similar software projects auto-
matically in order to derive design decisions and
business-relevant information. The recognition of
similarity should be determined by a hybrid approach
consisting of technical and subject-related similarity.
For technical similarity, libraries could help classify
a
https://orcid.org/0000-0002-4860-7464
b
https://orcid.org/0000-0002-6837-0628
c
https://orcid.org/0000-0003-4508-7667
d
https://orcid.org/0000-0001-7278-8595
software by providing references to the types of pro-
cessing and storage of the data, boundary systems,
providing APIs and the types of usage of the software.
By analyzing technology stacks in similar software
that evolve over time, decisions on selected technolo-
gies, design and architecture should be derived. For
this purpose, however, there is the problem that the li-
braries must be classified in order to detect migrations
from library A to library B with similar functions. As
too many libraries are available, manual classification
is not feasible. Therefore, this research project aims
to evaluate whether libraries crawled from Apache
Maven repositories can be classified automatically
into generic classes derived from classes available on-
line by using machine learning on tags.
Our motivation behind the choice of a pure tag-
based approach is to investigate whether a classifica-
tion of software libraries into mapped classes can al-
ready be accomplished exclusively by the use of tags.
We want to investigate this approach is suitable for
classification or other features, as described in related
work, should be used in addition. Furthermore, the
introduction of new classes for yet too fine-granular
classes and the identification of classes that are too
coarse should provide an opportunity for future re-
search work on this field.
Auch, M., Balluff, M., Mandl, P. and Wolff, C.
Similarity of Software Libraries: A Tag-based Classification Approach.
DOI: 10.5220/0010521600170028
In Proceedings of the 10th International Conference on Data Science, Technology and Applications (DATA 2021), pages 17-28
ISBN: 978-989-758-521-0
Copyright
c
2021 by SCITEPRESS – Science and Technology Publications, Lda. All rights reserved
17

2 RELATED WORK
The field of identifying similar software projects for
categorization is large. A recently conducted and
published systematic literature review (Auch et al.,
2020) shows the variety of approaches and motiva-
tions behind the work. In comparison, the catego-
rization of software libraries is rarely found in pub-
lished research projects. The review paper only points
out the work of Escobar-Avila (Escobar-Avila, 2015),
who published an approach to automatically catego-
rize software libraries. He manually collected the
bytecode (.jar files), profiles and categories of the li-
braries. In total, 158 software libraries written in Java,
which are published and maintained by the Apache
Software Foundation (ASF) were examined. The
bytecode documents were then transformed into a
vector space model representation and clustered af-
terwards.
This approach has some benefits: The major one is
probably that the bytecode of the libraries is one type
of artefact that is always present, since it is needed
to run the application. While some information is
lost in the compilation process (e.g., comments), the
bytecode still contains most of the textual information
found in the source code. With this approach, good
results in binary classification could be achieved with
an accuracy of 86%. However, the author also points
out that the same approach achieved an accuracy of
only 40% in multi-class categorization. Since we are
aiming for a multi-class categorisation in this work,
we decided on using meta-data and have therefore se-
lected a different, tag-based approach.
Related to our approach, a paper with a hybrid
approach was also recently published (Vel
´
azquez-
Rodr
´
ıguez and De Roover, 2020). Their work aims
for an automated multi-label classification, recom-
mending tags for untagged software libraries. To do
so, they use a combination of the existing tags and
word-vectors from binary-files. They point out, that
the data from the indexing platform MVNRepository,
which we also use, has a limited usability. This is
because the necessary tags are often missing or only
a single tag is available. This observation was made
based on a crawled dataset with about 3000 tagged li-
braries. We were also able to identify this limitation
to some extent in our larger dataset and see it as a
challenge for our approach to classify tagged, but not
yet categorized libraries based on their tags. To get
a better understanding of the distribution of tags, we
also describe this distribution of our crawled data in
the following section. Apart from this finding, how-
ever, their study cannot be benchmarked with ours, as
they pursue a different goal on the basis of different
data and methods.
Aside from the work on improving repository
management, similar approaches using tags for a cat-
egorization have been applied to other data and pur-
poses. For instance in social media, pictures and
content are categorized by using user-generated tags
(Mo
¨
ellic et al., 2008). Such approaches can be used to
organize and manage the large amount of data, such as
images shared by platform users. In general, the term
social recommendation tasks is used to describe vari-
ous goals, such as guided search, people profiling, tag
recommendation and finding domain experts, while
taking tags into account (Bogers, 2018). Another pos-
sible application is the categorization of music and
artists using tags (Hong et al., 2008). For example,
a tag-based experiment to find similarities between
artists was conducted. In addition to good results
in the mentioned studies, these approaches describe
some challenges that can also arise when categoriz-
ing software repositories. These challenges include
a lexical variability of a terms as well as highly spe-
cific, personal and noisy tags (Mo
¨
ellic et al., 2008).
Another challenge is caused by applying and evaluat-
ing imbalanced data, which was also identified in the
earlier study (Vel
´
azquez-Rodr
´
ıguez and De Roover,
2020) on the MVNRepository tags. Since we were
confronted with a similar problem in our experiment,
we describe below our approach and all the steps
taken in order to obtain an evalable result.
3 APPROACH
3.1 Dataset
Software libraries for the Java Virtual Machine (JVM)
were crawled between May to July 2020 to create a
machine learning dataset. For this purpose, the li-
braries were collected by their group-id and artefact-
id from the largest public repositories. For that pur-
pose of the search a custom crawler was implemented,
which parses the DOM tree of the repository websites.
The by far largest repository was found to
be Maven Central
1
, which contained slightly over
300,000 libraries. The other five selected reposito-
ries for crawling were Sonatype
2
, Spring IO
3
, Atlas-
sian
4
, Hortonworks
5
and Wso2
6
. After merging and
1
https://repo1.maven.org/maven2/
2
https://oss.sonatype.org/content/repositories/
3
https://repo.spring.io/plugins-release/
4
https://maven.atlassian.com/content/repositories/atlassian-
public/
5
https://repo.hortonworks.com/content/repositories/releases/
6
https://maven.wso2.org/nexus/content/repositories/releases/
DATA 2021 - 10th International Conference on Data Science, Technology and Applications
18
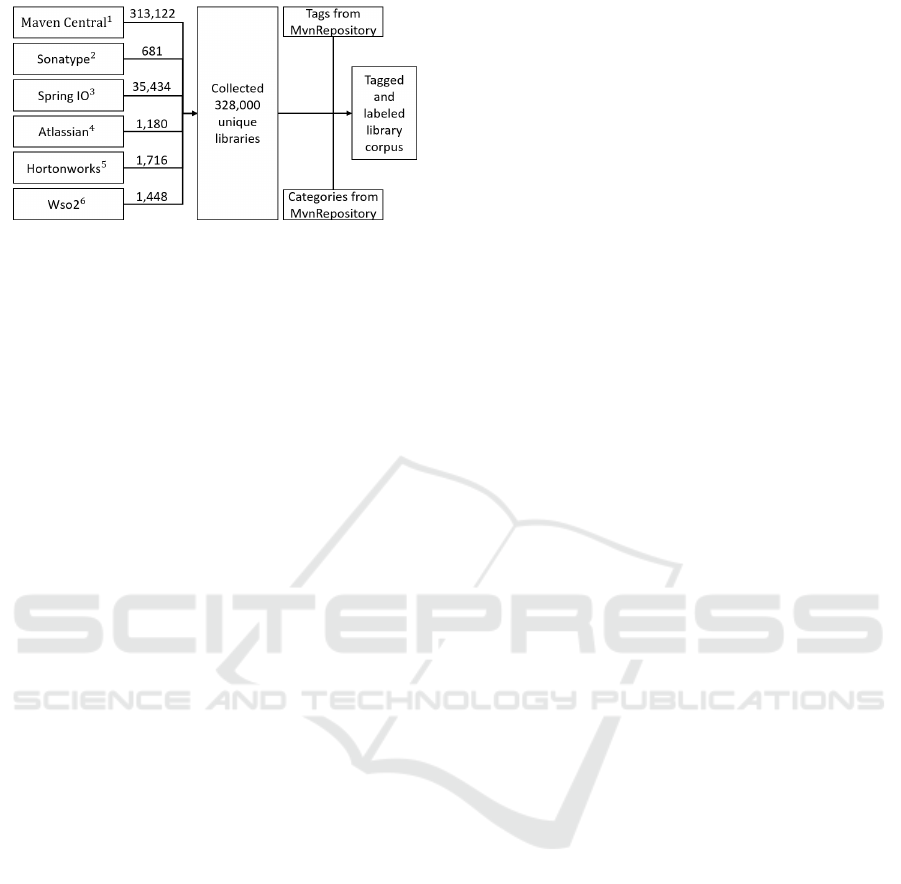
Figure 1: Crawling of maven repositories.
removing duplicates, the dataset has a size of 328,000
software libraries.
Subsequently, tags and labels already assigned
were searched for all crawled libraries. We found the
online service MvnRepository.com, which provides a
searchable index with additional information based
on our crawled repositories. Among other things,
categories and tags are provided for some libraries.
While categories bundle similar libraries of a domain,
tags show more coarse-grained and eventually unique
properties of a library (Vel
´
azquez-Rodr
´
ıguez and De
Roover, 2020). For our dataset, we found around
26,550 libraries that were labeled and tagged already.
Consequently, about 8% of the dataset was initially
available for training and evaluation. 246,400 addi-
tional libraries were provided by the service only in
tagged form. Therefore, about 75% of the crawled
record was still unlabeled, but already tagged. These
libraries are the target of this automated classification
approach in order to reliably categorize the most com-
mon libraries we encountered. This process is shown
again in Figure 1. A quarter of the entire dataset, con-
sisting of about 80,000 libraries, is neither labeled nor
tagged. Whether these are as relevant in terms of fre-
quency of use as the tagged and labeled libraries and
how they could be categorized remains to be clarified.
Therefore, we have removed them from the study and
will include them in future work.
3.2 Labeling and Balancing
As described above, some of the crawled libraries
are already sufficiently tagged and labeled. How-
ever, some classes contain more libraries than oth-
ers. This is due to different reasons. First, it is
due to the domain being crawled. Some subject ar-
eas are supported more strongly and diversely by ex-
isting libraries than others. For example, there are
many more libraries that simplify testing code with
helpful functions than there are libraries that support
the generation of hashes. On the other hand, the la-
bels of MvnRepository.com are chosen in different,
subject-specific granularities. For example, the An-
droid Packages class includes all libraries that pro-
vide any functionality, whether database persistence,
process specific or ui-related. This may be useful for
a search platform, but it may bias the results when
analyzing technically similar software projects. Sec-
ond, persistence related libraries have been divided
into classes by technology. This means that classes
exist that are too fine-grained, e. g. the data per-
sistence classes ”Cassandra Clients”, ”DynamoDB
Clients”, ”Embedded SQL Databases”, ”MySQL
Drivers”, ”PostgreSQL Drivers”, ”Object/Relational
Mapping”, ”JPA Implementations”. These should be
combined into more generic classes like Database or
Persistence for future research goals, such as detect-
ing the migration from e.g. MySQL to PostgreSQL.
As a follow-up step, several efforts were taken to
better balance the data set and to use a more appro-
priate classification for the subsequent research work.
A relabeling is to be mentioned here as a main con-
sideration. For this purpose, we introduce a mapping
which reduces the 162 categories crawled into more
general or concatenated categories if needed. The
mapping to the resulting 69 classes is presented by
tables 1 to 3.
As an additional step in order to better balance
the distribution of the classes in the dataset, classes
with few libraries were specifically enriched. For this
purpose, unlabeled but tagged libraries, which can be
clearly assigned to one of the classes, were manually
labeled afterwards. This procedure was also used to
validate the new class assignment from tables 1 to 3.
As a result of the validation it was recognized that
some libraries only provide examples of functionali-
ties and their utilization. These example libraries of
the crawled dataset are not categorized separately, but
are divided into the respective categories presented
in the tables. However, for planned future research
on the detection of technical similarity of software
projects, these sample libraries should be classified
in a new category. Therefore, an additional cate-
gory ”Example” has been introduced to bundle these
types of libraries. Partly the relabeling was straight-
forward, as the corresponding libraries were already
tagged with tags like ”example”. In some cases we
found that these example libraries did not have the
appropriate tags. However, the group-id and artefact-
id allowed us to draw reliable conclusions about ex-
ample libraries. These were tagged and labeled by
us manually afterwards. In addition, we did more
manual work by applying a qualitative content anal-
ysis (Mayring, 2004) on the dataset and especially
aimed to enrich the underrepresented classes. Con-
sequently, this resulted in a slightly larger dataset for
Similarity of Software Libraries: A Tag-based Classification Approach
19

Table 1: Mapping of crawled labels to newly defined labels.
Crawled labels Mapped labels
Actor Frameworks Actor Frameworks
Android Packages Android Packages
Android Platform Android Platform
Annotation Processing Tools Annotation Processing Tools
Application Servers
Application-/ Web-Server
Network App Frameworks
Tomcat Session Managers
Web Servers
FTP Clients and Servers
Application Layer Protocol In-
tegration
HTTP Clients
REST Framework
SSH Libraries
SSL Component Libraries
WebServices Metadata
WebSocket Clients
Simple Network Management Protocol
Aspect Oriented Aspect Oriented
Barcode Libraries Barcode Handler
Benchmarks
Benchmarks
Microbenchmarks
Bitcoin Bitcoin
Build Models
Build
Build Tools
Maven Plugins
Build Automation Tool PluginsMaven Repositories Api
Gradle Plugins
Bytecode Libraries Bytecode Libraries
Cache Clients
Caching
Cache Implementations
Chart Libraries Chart Libraries
Classpath Tools Classpath Tools
Cloud Computing Cloud Computing
Cluster Management Cluster Management
Code Analyzers
Code analyses
Defect Detection Metadata
Docker Clients Containerization
Command Line Parsers Command Line Parsers
Compression Libraries Compression Libraries
Concurrency Libraries Concurrency Libraries
Configuration Libraries Configuration Libraries
XMPP Integration Libraries
Communication Protocol Inte-
gration
Sms Library
Crawler
Crawler
Web Crawlers
Encryption Libraries Cryptography
ArangoDB Clients
Database
Android DB
Cassandra Clients
Column Database Clients
Database
DB Migration Tools
DynamoDB Clients
ElasticSearch Clients
Embedded SQL Databases
Graph Databases
Hadoop Databases
Hadoop Query Engines
HBase Clients
Table 2: Mapping of crawled labels to newly defined labels.
Crawled labels Mapped labels
JDBC Extensions
JDBC Pools
JPA Implementations
LevelDB Integration
MongoDB Clients
MySQL Drivers
Object/Relational Mapping
PostgreSQL Drivers
RDF Libraries
Redis Clients
SQL Drivers
Dependency Injection Dependency Injection
Distributed Communication
Distributed Communication
Transaction APIs/Managers
Distributed Computing Distributed Computing
Distributed Coordination Distributed Coordination
Distributed Tracing Distributed Tracing
DNS Libraries DNS Libraries
Exception Handling Exception Handling
External Process Execution External Process Execution
CSV Libraries
File Handler
Excel Libraries
HTML Parsers
JSON Libraries
Markdown Processors
PDF Libraries
SVG Libraries
XML Processing
XPath Libraries
YAML Parsers
Distributed File Systems
File SystemS3 Clients
Virtual File Systems
Geospatial Libraries Geospatial Libraries
Graph Algorithms
Graph Algorithms and Tools
GraphViz Libraries
Hashing Libraries Hashing
Eclipse Plugins
IDE ModulesEclipse Runtime
NetBeans Modules
Java Specifications Java Specifications
Job Scheduling Job Scheduling
JWT Libraries JWT Libraries
Expression Languages
Languages / Compiler / Inter-
pretation
Functional Programming
Java Compilers/Parsers
JavaScript Processors
JVM Languages
Language Runtime
Parser Generators
Python Integration
Scala Compilers
Application Metrics
Logging / Monitoring
Logging Bridges
Logging Frameworks
Monitoring Tools
Machine Learning Machine Learning
Mail Clients
Mailing
Mail Server
DATA 2021 - 10th International Conference on Data Science, Technology and Applications
20

Table 3: Mapping of crawled labels to newly defined labels.
Crawled labels Mapped labels
JMX Libraries Managing / Monitoring
Object Serialization Marshalling / Unmarshalling
Enterprise Integration
Messaging / Integration
Enterprise Service Bus
Message Brokers
Message Queue Clients
Money Libraries Money Libraries
Native Access Tools Native Access Tools
Natural Language Processing Natural Language Processing
Off-Heap Libraries Off-Heap Libraries
BPM Engines Operations management
OSGI Containers
OSGiOSGI Frameworks
OSGI Utilities
Reflection Libraries Reflection Libraries
Rule Engines Rule Engines
Full-Text Indexing Libraries
Search Engines
Search Engines
OAuth Libraries
Security / Authentification
Security Frameworks
Social Network Clients Social Network Clients
Stream Processing Stream Processing
Template Engines Template Engines
Assertion Libraries
Testing
Code Coverage Tools
Mocking
Testing Frameworks
Web Browser Automation
Web Testing
CSS, LESS, SASS
UI
JSF Libraries
JSP Tag Libraries
Swing Layouts
Swing Libraries
Web Assets
Web Frameworks
Base64 Libraries
Utilities
Collections
Console Utilities
Core Utilities
Date and Time Utilities
Diff and Patch Libraries
I/O Utilities
I18N Libraries
Math Libraries
MIME Types Libraries
Object Pools
Regular Expression Libraries
String Utilities
Units of Measurement
UUID Generators
Validation Frameworks
Vector/Matrix Libraries
Git Tools
Version-control system tools
Subversion Tools
Web Applications
Web Applications
Web Upload Managers
Testing Frameworks
7%
Web Applications
20%
Example
21%
Maven Plugins
23%
Other 64 classes
24%
Logging Frameworks
5%
Figure 2: Imbalanced distribution of libraries.
training and evaluation. At this point the manual
labeling allowed us to access about 28,600 labeled
and tagged libraries, which is around 9% of the total
dataset. We hosted the modified dataset on our repos-
itory
7
for traceability of the classification approaches
and future works.
Not all crawled classes are too specific. We could
also identify a class that is too generic. The android
package class is by far the largest class and is not
useful for our overall research project, which aims
to identify technically similar software using library
analysis. For this project it would be relevant which
benefit these android packages bring with them. The
class is therefore treated as a collection of libraries
to be dissolved and therefore the libraries belonging
to it are removed from the collected library corpus.
Label-mapping, filtering, and relabeling result in a
new distribution of libraries in classes. Figure 2 gives
an overview of the resulting five largest classes. The
remaining 56 classes cover only 24% of the labeled
data. According to Chawla (Chawla, 2010) a dataset
is imbalanced, if the classes are not represented ap-
proximately equal.
This means that there is still an imbalancement in
the data, which is partly due to the domain. Methods
such as the typically used oversampling or undersam-
pling can help with imbalanced data (Chawla, 2010).
By using random oversampling, replicated data is ap-
pended to the original dataset. With random under-
sampling, on the other hand, data is deleted from the
original dataset. However, these methods do not only
bring advantages, but also information losses or lead
to an overfitting of the trained model. To overcome
these disadvantages, there are various other methods
such as informed undersampling, synthetic sampling
with data generation or cluster-based sampling meth-
ods. Furthermore, cost-sensitive learning methods
can be used, which do not rely on balanced costs for
training, but on weighted costs for misclassification
through cost matrices (He and Garcia, 2009). For fu-
ture work, we still see possibilities for an improved
balancing in the dataset or the application of a training
7
https://github.com/CCWI/corpus-libsim.git
Similarity of Software Libraries: A Tag-based Classification Approach
21

method that is adapted to imbalancement. However,
since these approaches can also have drawbacks, we
have not taken any further balancing approaches for
this first study, but consider them only as future work
if it helps to improve the results in the classification.
3.3 Distribution and Exclusion of Tags
The recognized 437 different tags are partly assigned
across classes and must be checked in their composi-
tion. For example, while the tags ”json” and ”yaml”
refer to a yaml parser and thus libraries are classified
in this class, the tag combination ”json” and ”map-
ping” points to a json library, which supports a dese-
rialization to objects by means of mapping. In order
to be able to follow a tag-based approach, it must first
be ensured that the categorized training and evalua-
tion data, as well as the uncategorized data, are suf-
ficiently and similarly tagged. For this purpose, we
first analyzed the distribution of the tags on the basis
of the newly created dataset. The result is shown in
Figure 3. It is noticeable that a small part of the cate-
gorized libraries are not tagged. This means that they
cannot be considered for the training of a machine
learning model. Furthermore, it is noticeable that a
higher percentage of tagged-only libraries have a sin-
gle tag and less libraries have more than three tags.
Apart from these observations a similar distribution
could be found. Additionally, we checked whether
the uncategorized data contains other tags than those
already categorized. This was not the case, which is
why we considered this to be a good basis for this
research goal. Furthermore the dataset has a few out-
liers, which have up to 13 tags. These are not included
in Figure 3 for a better illustration, but should be men-
tioned.
A first analysis of the crawled dataset has shown
that not all tags have the same relevance. Some tags
were found to be irrelevant when viewing the crawled
dataset and could be excluded for training. These are
tags that occurred across classes and do not contribute
to the description of the functionality of a class. The
excluded tags were ”github”, ”codehaus”, ”apache”,
”experimental”, ”starter”, ”runner”, ”api” and ”bom”.
The first three indicate in most cases where the project
was hosted. The remaining tags to be excluded indi-
cate an irrelevant status, function or structure. By ex-
cluding these tags, we assume that an improved train-
ing result can be achieved.
1 2 3 4
5 6
7
0
10
20
30
40
50
Amount of Tags
Rate in %
categorized and tagged libraries
tagged-only libraries
Figure 3: Distribution of tags in the dataset under separate
consideration of categorized and uncategorized, but tagged,
libraries.
4 METHOD
In this study different algorithms for a multi-class
classification (Manning et al., 2008) were applied.
For this purpose, models were trained and evalu-
ated using multinomial logistic regression (B
¨
ohning,
1992), multinomial na
¨
ıve Bayes (Manning et al.,
2008), a random forest decision tree (Breiman, 2001)
as well as a feed forward neural network (Goodfellow
et al., 2016). In the following, the different algorithms
are briefly explained to provide an overview.
4.1 Multinomial Logistic Regression
As a first approach we applied the logistic regression.
Since it usually relies on binary labels, we have used
the multinomial logistic regression (B
¨
ohning, 1992).
It can be used for the multi-class classification pre-
sented in this work. Unlike the na
¨
ıve Bayes described
below, in logistic regression the analyzed tags are con-
sidered in a statistical dependence. For this purpose,
the implementation by the Apache Spark mllib was
used (Apache Spark, 2020a). The equation 1 shows
the approach. It calculates the probability of the cat-
egorical outcome Y, which can be one of the possi-
ble classes K, while for k=1,2,...,K (Apache Spark,
2020a). In this, X is a vector representation of the
tags for k, while the calculated regression coefficients
representing a vector of weights corresponding to out-
come k are presented as β
k
and β
0
k.
P(Y = k|X,β
k
,β
0k
) =
e
β
k
·X+β
0k
∑
K−1
k
0
=0
e
β
k
0
·X+β
0k
0
(1)
DATA 2021 - 10th International Conference on Data Science, Technology and Applications
22

In addition, the maximum number of iterations
and elastic net regularization can be optimized by
parametrization for the training of the logistic regres-
sion model. For this purpose, we tried different values
but could not find a significantly better result for the
dataset. Therefore, the standard parameters from the
documentation (Apache Spark, 2020a) were used and
no optimization was performed.
4.2 Multinomial Na
¨
ıve Bayes
The na
¨
ıve Bayes (Duda et al., 1973) works even more
simple than the logistic regression. It assumes that
all of the tags assigned to a libraries class are inde-
pendent of each other and is called the ”na
¨
ıve Bayes
assumption”. While this assumption is false in many
real-world tasks, the na
¨
ıve Bayes classifier often per-
forms well. In addition, this assumption of indepen-
decy simplifies training by allowing the tags to be
learned separately for each library. Especially with
larger datasets the training is easier and more efficient
(McCallum et al., 1998). A single iteration over the
training data is sufficient to calculate the conditional
probability distribution of each tag for each class.
The multinomial na
¨
ıve Bayes classifier also supports
multi-class classification and is therefore a possible
method for a reliable classification of libraries in this
study.
Here the probability is calculated after the im-
plementation by Spark (Apache Spark, 2020a) as in
equation 2. This calculates for each feature vector x,
containing the tags of a library, a prediction for each
available class C
k
. Let x
i
stand for the number of ap-
pearances of tags in a specific instance and p
ki
as the
probability that a tag exists for a class.
p(x|C
k
) =
(
∑
i
x
i
)!
∏
i
x
i
!
∏
i
p
ki
x
i
(2)
4.3 Random Forest
The stochastic model approach random forest de-
scribed by Ho (Tin Kam Ho, 1995) is an ensemble
of decision trees. It is used for classification by com-
bining many decision trees to reduce the risk of over-
fitting. Similar to decision trees, the random forest
offers a multi-class classification based on categori-
cal features. The accuracy should increase by com-
bining many decision trees, which is why we decided
to include the random forest algorithm for evaluation
on our library corpus. An implementation was done
according to the documentation of Apache Spark ml-
lib (Apache Spark, 2020b). The parameterization al-
lows the number of trees in the forest and the maxi-
mum depth of each tree in the forest. In addition, a
subsampling rate and a feature subset strategy can be
optimized. After several optimization attempts and
no significant improvements, we have taken the con-
figured default without optimization attempts.
4.4 Neural Network (NN)
Neural networks have become increasingly important
in recent years. A recently published SLR (Auch
et al., 2020) also shows that neural networks have
been used more and more in approaches for the recog-
nition of similar software projects. For the implemen-
tation of our feed forward neural network (Goodfel-
low et al., 2016) we used Keras on top of TensorFlow
2.4 as a high-level API (Keras SIG, 2020).
The applied neural network uses a simple input
layer with a fixed size of 13 x 437. This size is cal-
culated based on the maximum amount of tags per
library and the total amount of tags. As mentioned
in the description of the dataset, the number of tags
can vary for each library. For the network to properly
handle a varying number of tags, we decided to create
13 vectors for each library. Since the libraries of our
dataset have a maximum of 13 tags, each vector cor-
responds to a possible tag. Each of these vectors has
a size of 437, as we were able to identify as many dif-
ferent tags in our dataset. For instance, if the library
has only a single tag, the first vector contains a one
at the index of the tag, while the other 12 vectors are
just containing zero values.
We kept the structure of our feed forward neu-
ral network relatively simple. As described in Fig-
ure 4, the network starts with an input layer followed
by fully connected (dense) hidden layers and a flat-
ten layer. Finally, 69 neurons for each class were set
as the output layer. The hidden layers use a rectified
linear unit (ReLU) activation function (Hara et al.,
2015), while the output layer uses the SoftMax func-
tion. We use the callback function ReduceLROn-
Plateau and EarlyStopping in Keras to improve the
training speed of our model (Zaheer et al., 2018). In
addition, we used the ADAM optimizer which is set
as default in Keras and is popular in the deep learning
community (Zaheer et al., 2018).
During the optimization we experimented with
different hyperparmeters for the introduced network.
Therefore, we applied a 5-fold nested cross validation
(Varma and Simon, 2006) to optimize the number of
neurons per hidden layer and the depth of the network.
For each outer cross validation split, the algorithm
determines the best model based on the validated
mean accuracy of the inner cross validation split. The
best model selected from the inner cross validation
was trained on the complete outer loop training set
Similarity of Software Libraries: A Tag-based Classification Approach
23

and was evaluated on the outer test dataset. Finally,
we found three different models, each with a hidden
layer, being configured using between 150 and 250
neurons. However, models with more than one hidden
layer performed slightly worse, by about 0.5% aver-
age accuracy. Within the scope of the study, we did
not perform any further hyperparameter optimization
since it is computationally expensive as well as the re-
sults of this first study described below were consid-
ered to be sufficient. Nevertheless, we have included
a possible potential for improvement in future work.
Input Layer
Shape: 13 x 437
Dense Layer
150-250 Neurons
(ReLU)
Flatten Layer
Dense Output Layer
69 Neurons
(SoftMax)
Figure 4: Layers of the applied dense neural network.
5 EVALUATION
The evaluation of models in a multi-class problem
requires a different approach than binary classifica-
tion. This applies additionally in the case of an im-
balanced dataset where the distribution of classes is
not evenly distributed (Gu et al., 2009). In case of
a multi-class problem, the usual precision and re-
call measurements cannot be taken over all classes,
since they are usually calculated for each label sepa-
rately. However, it is possible to calculate a weighted
average for measurements like precision, recall and
f1 (Sokolova and Lapalme, 2009), (Scikit-learn De-
velopers, 2020). Therefore, for the evaluation of the
results the weighted precision or weighted ”positive
predictive value” (Tharwat, 2020) (PPV
w
) was calcu-
lated using the formula in equation 3 (Apache Spark,
2020c). This is done by dividing the correctly labeled
libraries - true positives (TP) - by TP and false posi-
tives (FP), which are the libraries that are incorrectly
labeled for the corresponding class. A weighting by
the number of true instances for each class is added
accordingly. The result of each class is summarized
for an overall result.
PPV
w
=
1
N
∑
`∈L
T P
T P + FP
(`) ·
N−1
∑
i=0
ˆ
δ(y
i
− `) (3)
Similar to the PPV
w
the T PR
w
was used, which
is the weighted ”true positive rate” (Tharwat, 2020)
and therefore represents the weighted recall. For this,
unlike the weighted precision, the TP is divided by the
Table 4: The evaluation results of the given models.
Models Measure 5-fold cross
Logistic
Regression
Accuracy 0.4476 (±0.0074)
Weighted Precision 0.3245 (±0.0063)
Weighted Recall 0.4476 (±0.0074)
Weighted F1 0.3465 (±0.0066)
Multinominal
Na
¨
ıve
Bayes
Accuracy 0.9257 (±0.0025)
Weighted Precision 0.9254 (±0.0021)
Weighted Recall 0.9257 (±0.0025)
Weighted F1 0.9213 (±0.0024)
Random
Forest
Accuracy 0.6081 (±0.0082)
Weighted Precision 0.5866 (±0.0165)
Weighted Recall 0.6081 (±0.0082)
Weighted F1 0.5365 (±0.0090)
Neural
Network
Accuracy 0.9746 (±0.0017)
Weighted Precision 0.9738 (±0.0014)
Weighted Recall 0.9736 (± 0.0013)
Weighted F1 0.9734 (±0.0014)
TP and the libraries, which are wrongly categorized
in other classes, also called false negative (FN). The
calculation is shown in equation 4.
T PR
w
=
1
N
∑
`∈L
T P
T P + FN
(`) ·
N−1
∑
i=0
ˆ
δ(y
i
− `) (4)
Since the F-score is the harmonic mean of pre-
cision and recall, it is also considered in this study.
First the F(β)-score is calculated by setting β = 1 to
equally weight the used precision and recall (Zhang
and Zhou, 2014). This is shown in equation 5.
F(β) =
1 + β
2
·
PPV · T PR
β
2
· PPV + T PR
(5)
This calculated F(β) was then used to calculate
the weighted F value (F
w
), which is shown in equa-
tion 6.
F
w
(β) =
1
N
∑
`∈L
F(β, `) ·
N−1
∑
i=0
ˆ
δ(y
i
− `) (6)
Finally, the accuracy was also calculated by the
equation 7. In contrast to binary classification,
multi-class classification problems require metrics
that provide a result across all classes. According to
(Apache Spark, 2020c), accuracy measures the preci-
sion across all labels - the number of times a class was
correctly predicted (TP), normalized by the number of
classes.
ACC =
T P
T P + FP
=
1
N
N−1
∑
i=0
ˆ
δ(
ˆ
y
i
− y
i
) (7)
For the evaluation a k-fold cross validation was
applied. This involves splitting the shuffled dataset k
times to get k random, exclusive subsets. These folds
S
1
,S
2
,...,S
k
should be roughly the same size and can
DATA 2021 - 10th International Conference on Data Science, Technology and Applications
24

be rotated as datasets for training and evaluation. The
dataset for evaluation of the trained model rotates in
every run according to the number of folds (k). All
remaining datasets of a run are used for training the
machine learning model. The result should be cal-
culated across all runs. A detailed description of the
procedure is given by Kohavi (Kohavi, 1995). It is
important to choose a suitable k for the procedure.
Kohavi concludes that choosing k between 10 and 20
reduces the variance of the results, while the bias in-
creases. A smaller k between 2 and 5 will show a
lower bias, but possibly a greater variance in results.
We therefore decided to use a 5-fold cross validation
and additionally a 10-fold cross validation. The result
of the evaluation of the models is shown in Table 4.
The values determined for the respective metric repre-
sent the rounded mean of the evaluation results. The
standard deviation behind the mean value shows the
distribution of the results. The highest achieved ac-
curacy from the 5-fold cross validation is highlighted
in bold. Since the deviations of the results from the
10-fold cross validation against the 5-fold were only
noticeable in the decimal place, we only focus on the
results of the lower biased 5-fold cross validation.
As described in the previous section, we applied
nested cross-validation taking 5-fold outer cross-
validation and 5-fold inner cross-validation for the
neural network while performing hyperparameter tun-
ing. The nested cross-validation reduces the bias
when evaluating different neural networks and gives
an improved estimate of the reachable accuracy on
the test dataset as well as other measurements, like
the error (Varma and Simon, 2006). As a result, we
obtained several trained models that performed differ-
ently on the respective test datasets of the outer cross
validation with little deviation. The result of the neu-
ral network in Table 4 therefore does not represent the
performance of a single trained model, but the aver-
age across all 3 best models.
Additionally it should be noted, that the weighted
F1 value, which normally represents the harmonic
mean of precision and recall, does not have to be be-
tween the calculated values of weighted precision and
weighted recall. This is due to the fact that the F1
metric also takes an imbalancement of the data into
account and does not necessarily have to lie between
precision and recall by calculation (Scikit-learn De-
velopers, 2020).
6 DISCUSSION
As described in the introduction, the goal of this study
was to determine whether the libraries of Apache
Maven repositories can be classified automatically
by their available tags using machine learning tech-
niques. For this purpose, we have applied differ-
ent approaches and can answer this leading question
with a clear ”yes” while achieving a high accuracy of
97.46% with a standard deviation of ±0.0017%. This
result also includes the mapping of the online crawled
classes to more generic classes that are important for
our further research. The question was whether the
machine learning methods would still be able to as-
sign the libraries to their tags even after restructuring
the classes. Considering the accuracy achieved, this
question can also be confirmed.
We found that the neural network models in our
training scenario give the best result on average com-
pared to the other machine learning techniques. The
overall accuracy of 97.46% is almost 5% higher than
na
¨
ıve Bayes. The trained nets also achieved a high
weighted precision and a high weighted recall. These
findings result in a weighted f1 score of 97.34% with a
standard deviation of ±0.0014%. The appended con-
fusion matrix in Table 5, generated from a randomly
picked evaluation run, demonstrates that also within
the separate classes an assignment is mostly correct
and reliable. The na
¨
ıve Bayes approach achieved a
good result as well with 92.57%. The weighted preci-
sion, recall and f1-values are on a similarly high level,
which is why this approach can also be considered re-
liable as well. For the random forest, the standard im-
plementation parameters of Apache Spark were used
in the final evaluation phase (Apache Spark, 2020b).
If necessary, the accuracy and the general result of
the decision tree approach could be further improved
by optimizing the number of trees and the maximum
depth in the forest.
As a clear limitation of the approach, it must be
noted that these good results for the automated classi-
fication of libraries probably do not work in general,
but only on the crawled libraries and their selected
classes. The approach depends strongly on the qual-
ity of the assigned tags and the choice of the classes.
It should be avoided to select too coarse-grained or
too small-grained classes when using these tags. We
still see a need for further research work and there-
fore refer to these points again in the following sec-
tion ”future work”.
7 CONCLUSIONS
With our approach, we want to bring more order to
the large collections of libraries and enable further
research in this field for us and potentially other re-
search teams. Since the percentage of crawled, cate-
Similarity of Software Libraries: A Tag-based Classification Approach
25

gorized software libraries in the Java Maven reposi-
tories is currently just over 8%, we have used a tag-
based approach to label most of the libraries. This
applies to an additional 67% of the libraries found in
the largest mentioned repositories.
At first, we were able to determine the composi-
tion of the categories and tags available online. More-
over, we were able to introduce a more general la-
beling of the libraries, adjusted for our further re-
search work. In addition, a similar distribution of tags
seems to be found for labeled and unlabeled libraries.
Finally, an imbalance in the data was found, which
we assume to be due to the domain under investiga-
tion. Based on these findings, we applied different ap-
proaches for automatic classification. For a tag-based
approach on our presented relabeled dataset, a neural
network with a achieved accuracy of 97.46% seems to
be the most promising. We also found a good result
with the applied na
¨
ıve Bayes approach. In contrast,
logistic regression and random forest decision trees
did not bring sufficient results.
8 FUTURE WORK
With such promising results in the automated classifi-
cation, we see only limited need for further optimiza-
tion work. However, by hyperparameter optimization
of the neural network, there is a chance for even better
results.
Furthermore, we still see a need for the evaluation
of more generic approaches, because 25% of the li-
braries from our dataset as well as libraries from other
platforms might not be tagged. This is where our ap-
proach has limitations for the management of repos-
itory items. For our trained models, tags must exist
and need to be of similar quality. Since this is proba-
bly not always the case, alternative features for classi-
fication should be considered. We see future work in
applying more generic approaches, using NLP to an-
alyze the always available group-ids and artefact-ids
as well as analyze the always available binary code.
This procedure could also be beneficial to the relabel-
ing of libraries from the currently excluded class ”an-
droid packages”, since this class is too generic in our
view. In addition, other features could be taken from
metadata and considered for classification in combi-
nation with the features already listed. If available,
we would consider the amount of tags and downloads,
code metrics, licences, connections between contribu-
tors behind those libraries and keywords/entities from
online websites.
Besides the further classification approaches of
the libraries, our further research work, as already de-
scribed in the introduction, aims to identify similar
software on a domain-related and technical basis. For
the technical basis, we plan to use the classified li-
braries and determine migration paths by analyzing
the development of open source projects on the time-
line. By analyzing the commit history in software
projects, we aim to provide decision support through
automatically generated design decision recommen-
dations.
REFERENCES
Apache Spark (2020a). Classification and regression.
https://spark.apache.org/docs/3.0.0/ml-classification-
regression.html, visited 2021-01-17.
Apache Spark (2020b). Ensembles - rdd-based
api. https://spark.apache.org/docs/3.0.0/mllib-
ensembles.html, visited 2021-01-17.
Apache Spark (2020c). Evaluation metrics - rdd-
based api. https://spark.apache.org/docs/3.0.0/mllib-
evaluation-metrics.html, visited 2021-01-17.
Auch, M., Weber, M., Mandl, P., and Wolff, C. (2020).
Similarity-based analyses on software applications: A
systematic literature review. Journal of Systems and
Software, page 110669.
Bogers, T. (2018). Tag-Based Recommendation, pages 441–
479. Springer International Publishing, Cham.
B
¨
ohning, D. (1992). Multinomial logistic regression algo-
rithm. Annals of the institute of Statistical Mathemat-
ics, 44(1):197–200.
Breiman, L. (2001). Random forests. Machine learning,
45(1):5–32.
Chawla, N. V. (2010). Data Mining for Imbalanced
Datasets: An Overview, pages 875–886. Springer US,
Boston, MA.
Duda, R. O., Hart, P. E., et al. (1973). Pattern classification
and scene analysis, volume 3. Wiley New York.
Escobar-Avila, J. (2015). Automatic categorization of soft-
ware libraries using bytecode. In 2015 IEEE/ACM
37th IEEE International Conference on Software En-
gineering, volume 2, pages 784–786.
Goodfellow, I., Bengio, Y., and Courville, A. (2016). Deep
Learning. MIT Press.
Gu, Q., Zhu, L., and Cai, Z. (2009). Evaluation measures
of the classification performance of imbalanced data
sets. In Cai, Z., Li, Z., Kang, Z., and Liu, Y., editors,
Computational Intelligence and Intelligent Systems,
pages 461–471, Berlin, Heidelberg. Springer Berlin
Heidelberg.
Hara, K., Saito, D., and Shouno, H. (2015). Analysis of
function of rectified linear unit used in deep learning.
In 2015 International Joint Conference on Neural Net-
works (IJCNN), pages 1–8.
He, H. and Garcia, E. A. (2009). Learning from imbalanced
data. IEEE Transactions on Knowledge and Data En-
gineering, 21(9):1263–1284.
DATA 2021 - 10th International Conference on Data Science, Technology and Applications
26

Hong, J., Deng, H., and Yan, Q. (2008). Tag-based artist
similarity and genre classification. In 2008 IEEE
International Symposium on Knowledge Acquisition
and Modeling Workshop, pages 628–631.
Keras SIG (2020). About keras. https://keras.io/about/, vis-
ited 2021-01-31.
Kohavi, R. (1995). A study of cross-validation and boot-
strap for accuracy estimation and model selection. In
Proceedings of the 14th International Joint Confer-
ence on Artificial Intelligence - Volume 2, IJCAI’95,
page 1137–1143, San Francisco, CA, USA. Morgan
Kaufmann Publishers Inc.
Manning, C. D., Sch
¨
utze, H., and Raghavan, P. (2008). In-
troduction to information retrieval. Cambridge uni-
versity press.
Mayring, P. (2004). Qualitative content analysis. A com-
panion to qualitative research, 1(2004):159–176.
McCallum, A., Nigam, K., et al. (1998). A comparison of
event models for naive bayes text classification. In
AAAI-98 workshop on learning for text categoriza-
tion, volume 752, pages 41–48. Citeseer.
Mo
¨
ellic, P.-A., Haugeard, J.-E., and Pitel, G. (2008). Im-
age clustering based on a shared nearest neighbors ap-
proach for tagged collections. In Proceedings of the
2008 International Conference on Content-Based Im-
age and Video Retrieval, CIVR ’08, page 269–278,
New York, NY, USA. Association for Computing Ma-
chinery.
Scikit-learn Developers (2020). sklearn metrics f1-score.
https://scikit-learn.org/stable/modules/generated/
sklearn.metrics.f1
score.html, visited 2021-01-17.
Sokolova, M. and Lapalme, G. (2009). A systematic analy-
sis of performance measures for classification tasks.
Information processing & management, 45(4):427–
437.
Tharwat, A. (2020). Classification assessment methods. Ap-
plied Computing and Informatics.
Thung, F., Lo, D., and Lawall, J. (2013). Automated library
recommendation. In 2013 20th Working Conference
on Reverse Engineering (WCRE), pages 182–191.
Tin Kam Ho (1995). Random decision forests. In Pro-
ceedings of 3rd International Conference on Docu-
ment Analysis and Recognition, volume 1, pages 278–
282 vol.1.
Varma, S. and Simon, R. (2006). Bias in error estimation
when using cross-validation for model selection. BMC
bioinformatics, 7(1):1–8.
Vel
´
azquez-Rodr
´
ıguez, C. and De Roover, C. (2020). Mu-
tama: An automated multi-label tagging approach for
software libraries on maven. In 2020 IEEE 20th Inter-
national Working Conference on Source Code Analy-
sis and Manipulation (SCAM), pages 254–258.
Zaheer, M., Reddi, S. J., Sachan, D., Kale, S., and Kumar,
S. (2018). Adaptive methods for nonconvex optimiza-
tion. In Proceedings of the 32nd International Con-
ference on Neural Information Processing Systems,
NIPS’18, page 9815–9825, Red Hook, NY, USA. Cur-
ran Associates Inc.
Zhang, M. and Zhou, Z. (2014). A review on multi-label
learning algorithms. IEEE Transactions on Knowl-
edge and Data Engineering, 26(8):1819–1837.
Similarity of Software Libraries: A Tag-based Classification Approach
27

APPENDIX
Table 5: Confusion matrix of a neural network 5-fold cross evaluation result showing classes with more than a single eval-
uated library. Rows show the predicted classes and are arranged in the same order as the columns. The columns show the
actual crawled and mapped classes. The 10 randomly excluded classes were removed for a better presentation of the matrix.
However, they do not show any particular deviations in the prediction.
Testing
Graph Algorithms and Tools
Build Automation Tool Plugins
Machine Learning
Example
Security / Authentification
Utilities
Languages / Compiler / Interpretation
File Handler
Annotation Processing
Web Applications
IDE Modules
Stream Processing
UI
Benchmarks
Rule Engines
Database
Native Access Tools
Contexts and Dependency Injection
Bitcoin
Actor Frameworks
Logging / Monitoring
Cryptography
Application Layer Protocol Integration
Barcode Handler
Code analyses
Marshalling / Unmarshalling
Distributed Computing
Build
Operations management
File System
Crawler
Natural Language Processing
Classpath Tools
Chart Libraries
Reflection Libraries
Social Network Clients
DNS Libraries
Aspect Oriented
Messaging / Integration
Bytecode Libraries
Exception Handling
Managing / Monitoring
Containerization
Money Libraries
Distributed Coordination
OSGi
Configuration Libraries
Distributed Communication
Search Engines
Caching
Job Scheduling
Mailing
Distributed Tracing
Application-/ Web-Server
390 0 1 0 0 0 0 0 0 0 0 0 0 0 0 0 1 0 0 0 0 0 0 0 0 0 0 0 1 0 0 0 0 0 0 0 0 0 0 0 0 0 0 0 0 0 0 0 0 0 0 0 0 0 0
0 51 0 0 0 0 0 0 0 0 0 0 0 0 0 0 0 0 0 0 0 0 0 0 0 0 0 0 0 0 0 0 0 0 0 0 0 0 0 0 0 0 0 0 0 0 0 0 0 0 0 0 0 0 0
0 0 943 0 0 0 0 0 1 0 0 1 0 0 0 0 0 0 0 0 0 0 0 0 0 0 0 0 2 0 0 0 0 0 0 0 0 0 0 0 0 0 0 0 0 0 0 0 0 0 0 0 0 0 0
0 0 0 50 0 0 0 0 0 0 0 0 0 0 0 0 0 0 0 0 0 0 0 0 0 0 0 0 0 0 0 0 0 0 0 0 0 0 0 0 0 0 0 0 0 0 0 0 0 0 0 0 0 0 0
1 0 0 0 881 0 0 0 0 0 21 0 0 0 0 0 0 0 0 0 0 0 0 0 0 0 0 0 0 0 0 0 0 0 0 0 0 0 0 0 0 0 0 0 0 0 0 0 0 0 0 1 0 0 0
0 0 0 0 0 64 0 0 0 0 0 0 0 0 0 0 0 0 0 0 0 0 0 0 0 0 0 0 0 0 0 0 0 0 0 0 0 0 0 0 0 0 0 0 0 0 0 0 0 0 0 0 0 0 0
1 0 1 0 0 0 126 1 0 0 0 0 0 0 0 0 0 1 0 0 0 0 0 0 0 0 0 0 0 0 0 0 0 0 0 0 0 0 0 1 0 0 0 0 0 0 0 0 0 0 0 0 0 0 1
0 0 0 0 0 0 0 134 2 0 0 1 0 0 0 0 0 0 0 0 0 0 0 0 0 0 0 0 0 0 0 0 0 0 0 0 0 0 0 0 0 0 0 0 0 0 0 0 1 0 0 0 1 0 0
3 0 1 0 0 0 0 1 252 0 0 0 0 0 0 0 0 0 0 0 0 0 0 0 0 0 0 0 0 0 0 0 0 0 0 0 0 0 0 0 0 0 0 0 0 0 0 0 0 0 0 0 0 0 0
1 0 0 0 0 0 0 0 0 18 0 0 0 0 0 0 0 0 0 0 0 0 0 0 0 0 0 0 0 0 0 0 0 0 0 0 0 0 0 0 0 0 0 0 0 0 0 0 0 0 0 0 0 0 0
5 0 0 0 49 0 0 0 0 0 801 0 0 0 0 0 0 0 0 0 0 0 0 0 0 0 0 0 0 0 0 0 0 0 0 0 0 0 0 0 0 0 0 0 0 0 0 0 0 0 0 0 0 0 0
1 0 1 0 0 0 0 0 1 0 0 148 0 1 0 0 1 0 0 0 0 0 0 0 0 0 0 0 0 0 0 0 0 0 0 0 0 0 0 0 0 0 0 0 0 0 0 0 0 0 0 0 0 0 0
0 0 0 0 0 0 0 0 0 0 0 0 137 0 0 0 0 0 0 0 0 0 0 0 0 0 0 0 0 0 0 0 0 0 0 0 0 0 0 0 0 0 0 0 0 0 0 0 0 0 0 0 0 0 0
1 0 2 0 0 0 0 0 0 0 0 0 0 223 0 0 2 0 0 0 0 0 0 0 0 0 0 0 0 0 0 0 0 0 0 0 0 0 0 0 0 0 0 0 0 0 1 0 0 0 0 0 0 0 0
0 0 0 0 0 0 0 0 0 0 0 0 0 0 49 0 0 0 0 0 0 0 0 0 0 0 0 0 0 0 0 0 0 0 0 0 0 0 0 0 0 0 0 0 0 0 0 0 0 0 0 0 0 0 0
0 0 0 0 0 0 0 0 0 0 0 0 0 0 0 39 0 0 0 0 0 0 0 0 0 0 0 0 0 0 0 0 0 0 0 0 0 0 0 0 0 0 0 0 0 0 0 0 0 0 0 0 0 0 0
1 0 0 0 0 0 0 0 1 0 0 0 0 0 0 0 174 1 0 0 0 0 0 0 0 0 0 0 0 0 0 0 0 0 0 0 0 0 0 0 0 0 0 0 0 0 0 0 0 0 0 0 0 0 2
0 0 0 0 0 0 0 0 0 0 0 0 0 0 0 0 0 38 0 0 0 0 0 0 0 0 0 0 0 0 0 0 0 0 0 0 0 0 0 0 0 0 0 0 0 0 0 0 0 0 0 0 0 0 0
0 0 0 0 0 0 0 1 0 0 0 0 0 0 0 0 0 0 44 0 0 0 0 0 0 0 0 0 0 0 0 0 0 0 0 0 0 0 0 0 0 0 0 0 0 0 0 0 0 0 0 0 0 0 0
0 0 0 0 0 0 0 0 0 0 0 0 0 0 0 0 0 0 0 18 0 0 0 0 0 0 0 0 0 0 0 0 0 0 0 0 0 0 0 0 0 0 0 0 0 0 0 0 0 0 0 0 0 0 0
0 0 0 0 0 0 0 0 0 0 0 0 0 0 0 0 0 0 0 0 24 0 0 0 0 0 0 0 0 0 0 0 0 0 0 0 0 0 0 0 0 0 0 0 0 0 0 0 0 0 0 0 0 0 0
0 0 0 0 0 0 0 0 0 0 0 0 0 0 0 0 0 0 0 0 0 203 0 0 0 0 0 0 1 0 0 0 0 0 0 0 0 0 0 0 0 0 0 0 0 0 1 0 0 0 0 0 0 0 0
1 0 0 0 0 0 0 0 0 0 0 0 0 0 0 0 0 0 0 0 0 0 91 0 0 0 0 0 0 0 0 0 0 0 0 0 0 0 0 0 0 0 0 0 0 0 0 0 0 0 0 0 0 0 0
3 0 0 0 0 0 0 0 0 0 0 0 0 0 0 0 0 0 0 0 0 0 0 63 0 0 0 0 0 0 0 0 0 0 0 0 0 0 0 0 0 0 0 0 0 0 0 0 0 0 0 0 0 0 0
1 0 1 0 0 0 0 0 0 0 0 0 0 0 0 0 0 0 0 0 0 0 0 0
7
0 0 0 0 0 0 0 0 0 0 0 0 0 0 0 0 0 0 0 0 0 0 0 0 0 0 0 0 0 0
0 0 0 0 0 0 0 0 0 0 0 0 0 0 0 0 0 0 0 0 0 0 0 0 0 51 0 0 0 0 0 0 0 0 0 0 0 0 0 0 0 0 0 0 0 0 0 0 0 0 0 0 0 0 0
1 0 0 0 0 0 0 0 0 0 0 0 0 0 0 0 0 0 0 0 0 0 0 0 0 0 40 0 0 0 0 0 0 0 0 0 0 0 0 0 0 0 0 0 0 0 0 0 0 0 0 0 0 0 0
0 0 0 0 0 0 0 0 0 0 0 0 0 0 0 0 0 0 0 0 0 0 0 0 0 0 0 4 0 0 0 0 0 0 0 0 0 0 0 0 0 0 0 0 0 0 0 0 0 0 0 0 0 0 0
1 0 1 0 0 0 0 1 0 0 0 0 0 0 0 0 0 0 0 0 0 0 0 0 0 0 0 0 57 0 0 0 0 0 0 0 0 0 0 0 0 0 0 0 0 0 0 0 0 0 0 0 0 0 0
0 0 0 0 0 0 0 0 0 0 0 1 0 0 0 0 0 0 0 0 0 0 0 0 0 0 0 0 0 17 0 0 0 0 0 0 0 0 0 0 0 0 0 0 0 0 0 0 0 0 0 0 0 0 0
2 0 0 0 0 0 1 0 0 0 0 1 0 0 0 0 0 0 0 0 0 0 0 0 0 0 0 0 0 0 16 0 0 0 0 0 0 0 0 0 0 0 0 0 0 0 0 0 0 0 0 0 0 0 0
0 0 0 0 0 0 0 0 0 0 0 0 0 0 0 0 0 0 0 0 0 0 0 0 0 0 0 0 0 0 0 27 0 0 0 0 0 0 0 0 0 0 0 0 0 0 0 0 0 0 0 0 0 0 0
0 0 0 0 0 0 0 0 0 0 0 0 0 0 0 0 0 0 0 0 0 0 0 0 0 0 0 0 0 0 0 0 24 0 0 0 0 0 0 0 0 0 0 0 0 0 0 0 0 0 0 0 0 0 0
1 0 0 0 0 0 0 0 0 0 1 0 0 0 0 0 0 0 0 0 0 0 0 0 0 0 0 0 0 0 0 0 0 3 0 0 0 0 0 0 0 0 0 0 0 0 0 0 0 0 0 0 0 0 0
0 0 0 0 0 0 0 0 0 0 0 0 0 0 0 0 0 0 0 0 0 0 0 0 0 0 0 0 0 0 0 0 0 0 22 0 0 0 0 0 0 0 0 0 0 0 0 0 0 0 0 0 0 0 0
0 0 0 0 0 1 0 0 0 0 0 0 0 0 0 0 0 0 0 0 0 0 0 0 0 0 0 0 0 0 0 0 0 0 0 12 0 0 0 0 0 0 0 0 0 0 0 0 0 0 0 0 0 0 0
0 0 0 0 0 0 0 0 0 0 0 0 0 0 0 0 0 0 0 0 0 0 0 0 0 0 0 0 0 0 0 0 0 0 0 0 14 0 0 0 0 0 0 0 0 0 0 0 0 0 0 0 0 0 0
1 0 0 0 0 0 0 0 0 0 0 0 0 0 0 0 0 0 0 0 0 0 0 0 0 0 0 0 0 0 0 0 0 0 0 0 0 28 0 0 0 0 0 0 0 0 0 0 0 0 0 0 0 0 0
0 0 0 0 0 0 0 0 0 0 0 0 0 0 0 0 0 0 0 0 0 0 0 0 0 0 0 0 0 0 0 0 0 0 0 0 0 0 24 0 0 0 0 0 0 0 0 0 0 0 0 0 0 0 0
0 0 0 0 0 0 0 0 0 0 0 0 1 0 0 0 0 0 0 0 0 0 0 0 0 0 0 0 0 0 0 0 0 0 0 0 0 0 0 27 0 0 0 0 0 0 0 0 0 0 0 0 0 0 0
1 0 0 0 0 0 0 0 0 0 0 0 0 0 0 0 0 0 0 0 0 0 0 0 0 0 0 0 0 0 0 0 0 0 0 0 0 0 0 0 3 0 0 0 0 0 0 0 0 0 0 0 0 0 0
0 0 0 0 1 0 0 0 0 0 0 0 0 0 0 0 0 0 0 0 0 0 0 0 0 0 0 0 0 0 0 0 0 0 0 0 0 0 0 0 0 8 0 0 0 0 0 0 0 0 0 0 0 0 0
1 0 0 0 0 0 0 0 0 0 0 0 0 0 0 0 0 0 0 0 0 0 0 0 0 0 0 0 0 0 0 0 0 0 0 0 0 0 0 0 0 0 11 0 0 0 0 0 0 0 0 0 0 0 0
2 0 0 0 0 0 0 0 0 0 0 0 0 0 0 0 0 0 0 0 0 0 0 0 0 0 0 0 0 0 0 0 0 0 0 0 0 0 0 0 0 0 0 3 0 0 0 0 0 0 0 0 0 0 0
0 0 0 0 0 0 0 0 0 0 0 0 0 0 0 0 0 0 0 0 0 0 0 0 0 0 0 0 0 0 0 0 0 0 0 0 0 0 0 0 0 0 0 0 16 0 0 0 0 0 0 0 0 0 0
0 0 0 0 0 0 0 0 0 0 0 0 0 0 0 0 0 0 0 0 0 0 0 0 0 0 0 0 0 0 0 0 0 0 0 0 0 0 0 0 0 0 0 0 0 8 0 0 0 0 0 0 0 0 0
0 0 0 0 1 0 0 0 0 0 0 0 0 0 0 0 0 0 0 0 0 0 0 0 0 0 0 0 0 0 0 0 0 0 0 0 0 0 0 0 0 0 0 0 0 0 32 0 0 0 0 0 0 0 0
0 0 0 0 0 0 0 0 0 0 0 0 0 0 0 0 0 0 0 0 0 0 0 0 0 0 0 0 0 0 0 0 0 0 0 0 0 0 0 0 0 0 0 0 0 0 0 8 0 0 0 0 0 0 0
0 0 0 0 0 0 0 0 0 0 0 0 0 0 0 0 0 0 0 0 0 0 0 0 0 0 0 0 0 0 0 0 0 0 0 0 0 0 0 0 0 0 0 0 0 0 0 0 14 0 0 0 0 0 0
0 0 0 0 0 0 0 0 0 0 0 0 0 0 0 0 0 0 0 0 0 0 0 0 0 0 0 0 0 0 0 0 0 0 0 0 0 0 0 0 0 0 0 0 0 0 0 0 0 6 0 0 0 0 0
1 0 0 0 0 0 0 0 0 0 0 0 0 0 0 0 1 0 0 0 0 0 0 0 0 0 0 0 0 0 0 0 0 0 0 0 0 0 0 0 0 0 0 0 0 0 0 0 0 0
7
0 0 0 0
0 0 0 0 0 0 0 0 0 0 0 0 0 1 0 0 0 0 0 0 0 0 0 0 0 0 0 0 0 0 0 0 0 0 0 0 0 0 0 0 0 0 0 0 0 0 0 0 0 0 0 39 0 0 0
1 0 0 0 0 0 0 0 0 0 0 0 0 0 0 0 0 0 0 0 0 0 0 0 0 0 0 0 0 0 0 0 0 0 0 0 0 0 0 0 0 0 0 0 0 0 0 0 0 0 0 0 10 0 0
0 0 0 0 0 0 0 0 0 0 0 0 0 0 0 0 0 0 0 0 0 0 0 0 0 0 0 0 0 0 0 0 0 0 0 0 0 0 0 0 0 0 0 0 0 0 0 0 0 0 0 0 0 4 0
1 0 0 0 0 0 0 0 0 0 0 0 0 0 0 0 0 0 0 0 0 0 0 0 0 0 0 0 0 0 0 0 0 0 0 0 0 0 0 0 0 0 0 0 0 0 0 0 0 0 0 0 0 0 15
DATA 2021 - 10th International Conference on Data Science, Technology and Applications
28
