
Applications of Learning Methods to Imaging Issues in Archaeology,
Regarding Ancient Ceramic Manufacturing
K. Dia
1,3 a
, V. L. Coli
1,3 b
, L. Blanc-F
´
eraud
2 c
, J. Leblond
3 d
, L. Gomart
4 e
and D. Binder
1 f
1
University C
ˆ
ote d’Azur, CNRS, CEPAM, 06300 Nice, France
2
University C
ˆ
ote d’Azur, CNRS, INRIA, I3S Lab., Sophia Antipolis, France
3
University C
ˆ
ote d’Azur, INRIA, Team Factas, B.P. 93, 06902 Sophia Antipolis Cedex, France
4
University Paris 1 Panth
´
eon-Sorbonne, CNRS-UMR 8215 Trajectoires, 92023 Nanterre, France
Keywords:
Machine Learning Algorithms, Convolution Neural Network, Support Vector Machine, Image Classification
and Analysis, Hough Transform, Archaeology, Neolithic Pottery.
Abstract:
Archaeological studies involve more and more numerical data analyses. In this work, we are interested in the
analysis and classification of ceramic sherds tomographic images in order to help archaeologists in learning
about the fabrication processes of ancient pottery. More specifically, a particular manufacturing process (spiral
patchwork) has recently been discovered in early Neolithic Mediterranean sites, along with a more traditional
coiling technique. It has been shown that the ceramic pore distribution in available tomographic images of
both archaeological and experimental samples can reveal which manufacturing technique was used. Indeed,
with the spiral patchwork, the pores exhibit spiral-like behaviours, whereas with the traditional one, they are
distributed along parallel lines, especially in the experimental samples. However, in archaeological samples,
these distributions are very noisy, making analysis and discrimination hard to process. Here, we investigate
how Learning Methods (Deep Learning and Support Vector Machine) can be used to answer these numerically
difficult problems. In particular, we study how the results depend on the input data (either raw data at the output
of the tomographic device, or after a preliminary pore segmentation step), and the quality of the information
they could provide to archaeologists.
1 INTRODUCTION
Back in the seventh and sixth millennia BC, when
farming was introduced to Europe, pottery was a cen-
tral practice for storing and food processing. For the
archaeologists, the techniques used to manufacture
ancient pottery can act as a powerful marker of the so-
cial identity of their producers. A previously unrecog-
nised pottery manufacturing technique was recently
identified (Gomart et al., 2017) at the Pendimoun
rock shelter (early Neolithic layers dated to the early
6th millennium BCE) in southeastern France (Alpes-
Maritimes) and named spiralled patchwork technol-
a
https://orcid.org/0000-0002-4526-2851
b
https://orcid.org/0000-0002-4777-3217
c
https://orcid.org/0000-0002-9693-6924
d
https://orcid.org/0000-0001-7950-0283
e
https://orcid.org/0000-0003-0793-2292
f
https://orcid.org/0000-0001-8232-5367
ogy (SPT). The construction of pottery using SPT re-
lies on juxtaposing and fusing circular patches, see
Figure 1, right. This manufacturing technique is con-
temporary to the coiling technology (CoT), which is
often observed in European early farming contexts
(Salanova et al., 2010; Gomart, 2014; Gomart, 2010)
and is characterised by superimposition of coils, see
Figure 1, left.
Micro-computed tomographic (µ-CT) 3-D images
of pottery sherds formed using these techniques were
acquired, revealing their internal structure. In partic-
ular, in 2-D cross-sections, the distribution of pores
(i.e., voids trapped inside the clay forming the sherd
structure during the building process) revealed curvi-
linear patterns for the SPT sherds and mainly paral-
lel linear patterns for the CoT sherds, see Figure 2
(mostly visible in the first and second columns).
The goal of the present work is to analyse and
classify pottery manufacturing sequences using the
images acquired by µ-CT from available archaeolog-
Dia, K., Coli, V., Blanc-Féraud, L., Leblond, J., Gomar t, L. and Binder, D.
Applications of Learning Methods to Imaging Issues in Archaeology, Regarding Ancient Ceramic Manufacturing.
DOI: 10.5220/0010519101090116
In Proceedings of the 2nd International Conference on Deep Learning Theory and Applications (DeLTA 2021), pages 109-116
ISBN: 978-989-758-526-5
Copyright
c
2021 by SCITEPRESS – Science and Technology Publications, Lda. All rights reserved
109
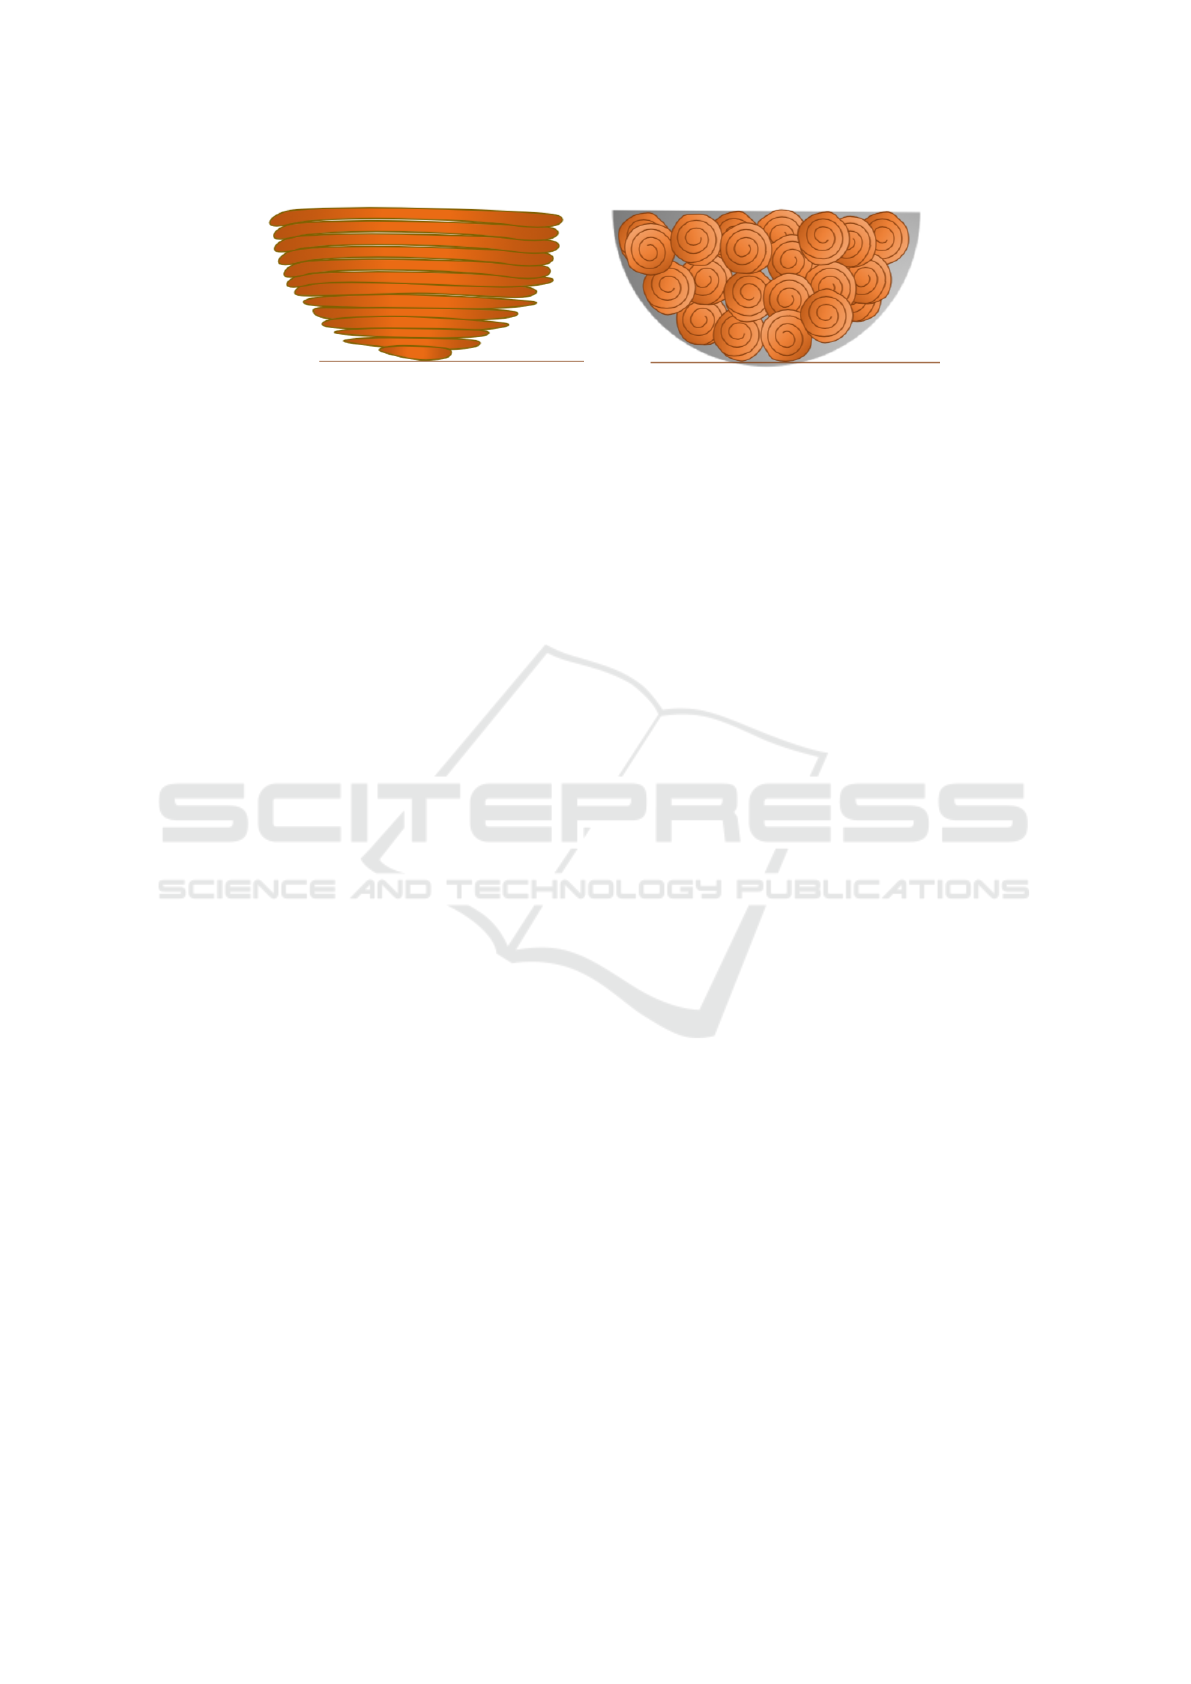
Figure 1: Coiling Technology (superimposition of coils, left), Spiral Patchwork Technology (juxtaposed spiral patches, right).
ical sherds and from experimental sherds that were
recently manufactured in controlled conditions using
both coiling and spiral patchwork techniques. These
scans allow to access the complete internal structure
of these sherds and, after a segmentation process, to
isolate the regions corresponding to pores, showing
their spatial distribution, see Figure 2, bottom line.
The purpose of this work is to provide a quan-
titative characterisation of Neolithic pottery forming
techniques using 3-D datasets. To the authors knowl-
edge, it represents a first attempt to achieve this goal.
The dataset considered in this study is composed
of sixteen sherds:
• four CoT sherds (one archaeological and three ex-
perimental sherds);
• twelve SPT sherds (five archaeological and seven
experimental sherds).
The first and second columns of Figure 2, which show
2-D cross-sections images of CoT and SPT experi-
mental sherds, reveal that pore distribution varies ac-
cording to the manufacturing technique used. The
third and fourth columns of Figure 2, which represent
archaeological CoT and SPT sherds, show that man-
ufacturing technique is much more difficult to detect
in archaeological samples as patterns are not visually
distinguishable, most probably because of fragment
alteration through time. The pore distribution of both
archaeological and experimental sherds is accessible
by analysing the segmented images (as in Figure 2,
bottom line). Detecting pore alignments, which are
visible in Figure 2 down-left image, allows to iden-
tify the CoT technique. This is obtained by using the
Hough transform as in (Coli et al., 2020), an auto-
matic way to detect aligned patterns in images. We
first select the lines that intersect the highest quan-
tity of pore regions, and we analyse their parallelism
by computing the scalar product between their direc-
tional vectors. As expected, CoT-like images reveal
parallel lines characterised by values of the scalar
products close to 1, whereas other techniques as SPT
show other / random distributions, see (Dia, 2020).
To classify ceramic sherd images, we investigate
in this work classical Machine Learning (ML) algo-
rithms. The Support Vector Machine (SVM) method
(Widodo and Yang, 2007) is applied to preliminary
features given by the scalar products between the
detected lines, while Deep Learning (DL) method
is initially run on the segmented images (extracted
pores). We use Convolutional Neural Network (CNN)
(Krizhevsky et al., 2012) with the pre-trained network
GoogLeNet (Szegedy et al., 2015) for transfer learn-
ing to classify segmented images. Finally, as CNN-
based methods result in automatic feature extraction,
the pore segmentation step appears not be necessary.
The same CNN based classification procedure, with
the learning phase, has been applied directly on the
2D slices of tomographic images and good classifica-
tion results have been obtained.
Below, we describe the data, the considered ana-
lytical protocol and classification methods, and show
how they can answer archaeological questions. In
Section 2 we precise some information on data ac-
quisition and treatments. Section 3 is devoted to a
brief overview of the exploited learning algorithms
(ML/SVM and DL/CNN). In Section 4, classification
results for the above dataset including both pottery
forming techniques are given and analysed. Finally,
a brief conclusion is provided in Section 5.
2 DATA PROCESSING
We describe here the data acquisition process, the pre-
processing step of the images, that consists in pore
segmentation, and the way we proceed to feature ex-
traction, using Hough transform.
2.1 Image Acquisition
The experimental and archaeological pottery sherds
were scanned using a SkyScan-1178 X-ray µ-CT sys-
tem (Bruker) with two 1280x1024 X-ray cameras,
beam energy of 60kV, a 0.5mm thick aluminium filter,
0.7
◦
rotation. Each reconstructed image has a resolu-
tion of 81 µm. To reduce the data size, a box volume
surrounding each sherd is cropped from the 3-D stack
and used in the analysis. In this work we considered
DeLTA 2021 - 2nd International Conference on Deep Learning Theory and Applications
110
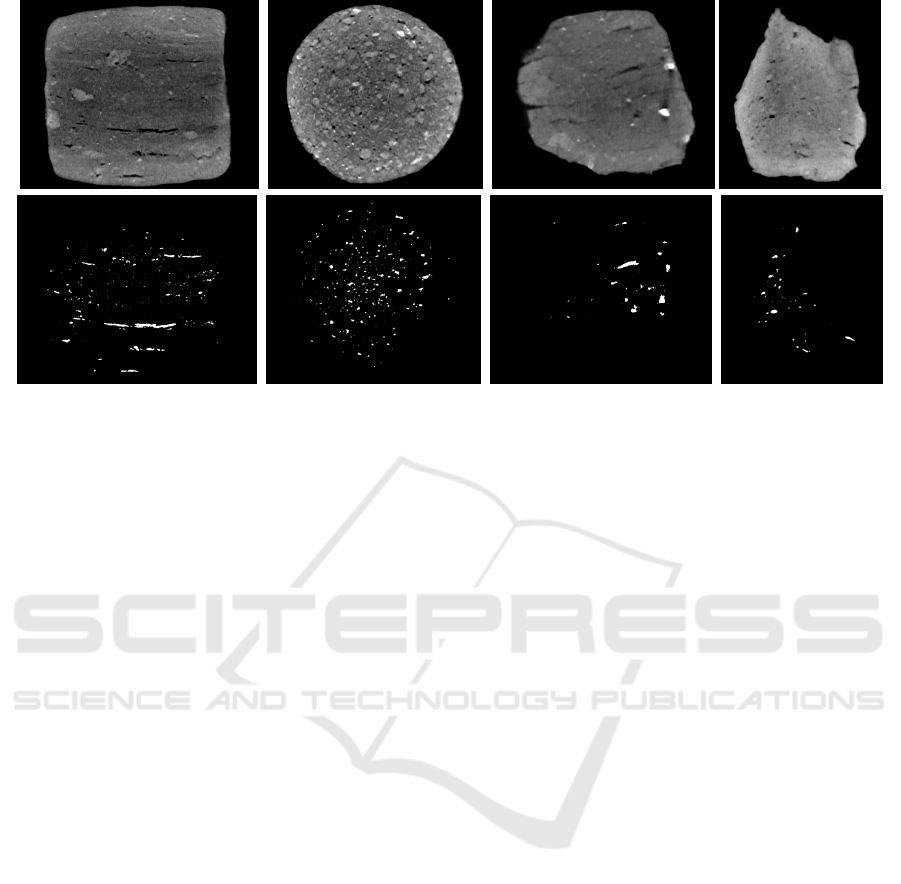
Figure 2: Pores segmentation results. The first line shows 2-D tomographic images and the second line the corresponding
segmented images. From left to right: CoT and SPT experimental sherds, CoT and SPT archaeological sherds.
central 2-D cross sections of tomographic images of
sherds (see Figure 2, first row, for an example of CoT
and SPT experimental and archaeological sherds).
2.2 Image Processing
The spatial distribution of pores inside pottery de-
pends on the manufacturing sequence used, as air
tends to be trapped between building elements during
the forming process. Thus, CoT sherds are charac-
terised by pores showing linear patterns, while SPT
sherds reveal more dispersed patterns, which in some
cases suggest circular dispositions by visual interpre-
tation. Therefore, the segmentation of pores inside to-
mographic images reveals useful information for the
characterisation of the building technique.
The procedure we use to segment pore regions
is as follows. First, the pixels with low intensity
grey-scale values are selected as corresponding to air.
Then, a volume binarisation is applied to separate air
pixels from the rest of the materials characterising the
pottery (i.e. clay and mineral inclusions). Finally, a
connected components detection is performed in or-
der to remove unwanted connected components cor-
responding to the air surrounding the sherd. This pro-
cedure is applied to 3-D stack of tomographic images
and more details can be found in (Coli et al., 2020).
The 2-D cross-section images which we chose to use
in this work are successively extracted from the 3-D
stack. In Figure 2, bottom line, we show examples
of results of this segmentation process, where only
the porosity contrast is kept visible in the images.
In the rest of this work, we refer to these images as
segmented images. After segmentation, the images
show mostly aligned patterns for the pores in the CoT
sherds, while the distribution appears to be more cir-
cular and random for the SPT ones (Figure 2, bottom
line). Then, the distribution of pores is investigated
by means of the Hough transform.
2.3 Feature Extraction
The Hough transform is a classical technique which
is often used to detect alignments or other patterns
in images (Ballard, 1981; Beltrametti et al., 2013;
Mukhopadhyay and Chaudhuri, 2015). In order to de-
tect lines in 2-D images, the Hough transform relates
points in the image to sinusoidal curves in an asso-
ciated Hough space. The intersections between sinu-
soids account for the presence of points along lines in
the original image. Keeping the points where most si-
nusoids intersect provides us with the main alignment
directions of pores. In the analysis of the segmented
images, only the five lines which have the greater
amount of aligned pore pixels are retained in each im-
age for both classes (e.g., see Figure 3). The paral-
lelism between these five lines is tested by computing
the scalar products between their directional vectors
(Dia, 2020; Coli et al., 2020). These scalar products
constitute the main feature which will be provided to
the SVM classifier.
A second feature is provided by the number of in-
tersection points between the recovered lines in the
image. Indeed, these lines are almost parallel for CoT
sherds and may intersect outside the image region,
while this is not the case for SPT sherds for which
these lines admit quite a few intersection points close
to the image centre (see Figure 3).
Applications of Learning Methods to Imaging Issues in Archaeology, Regarding Ancient Ceramic Manufacturing
111
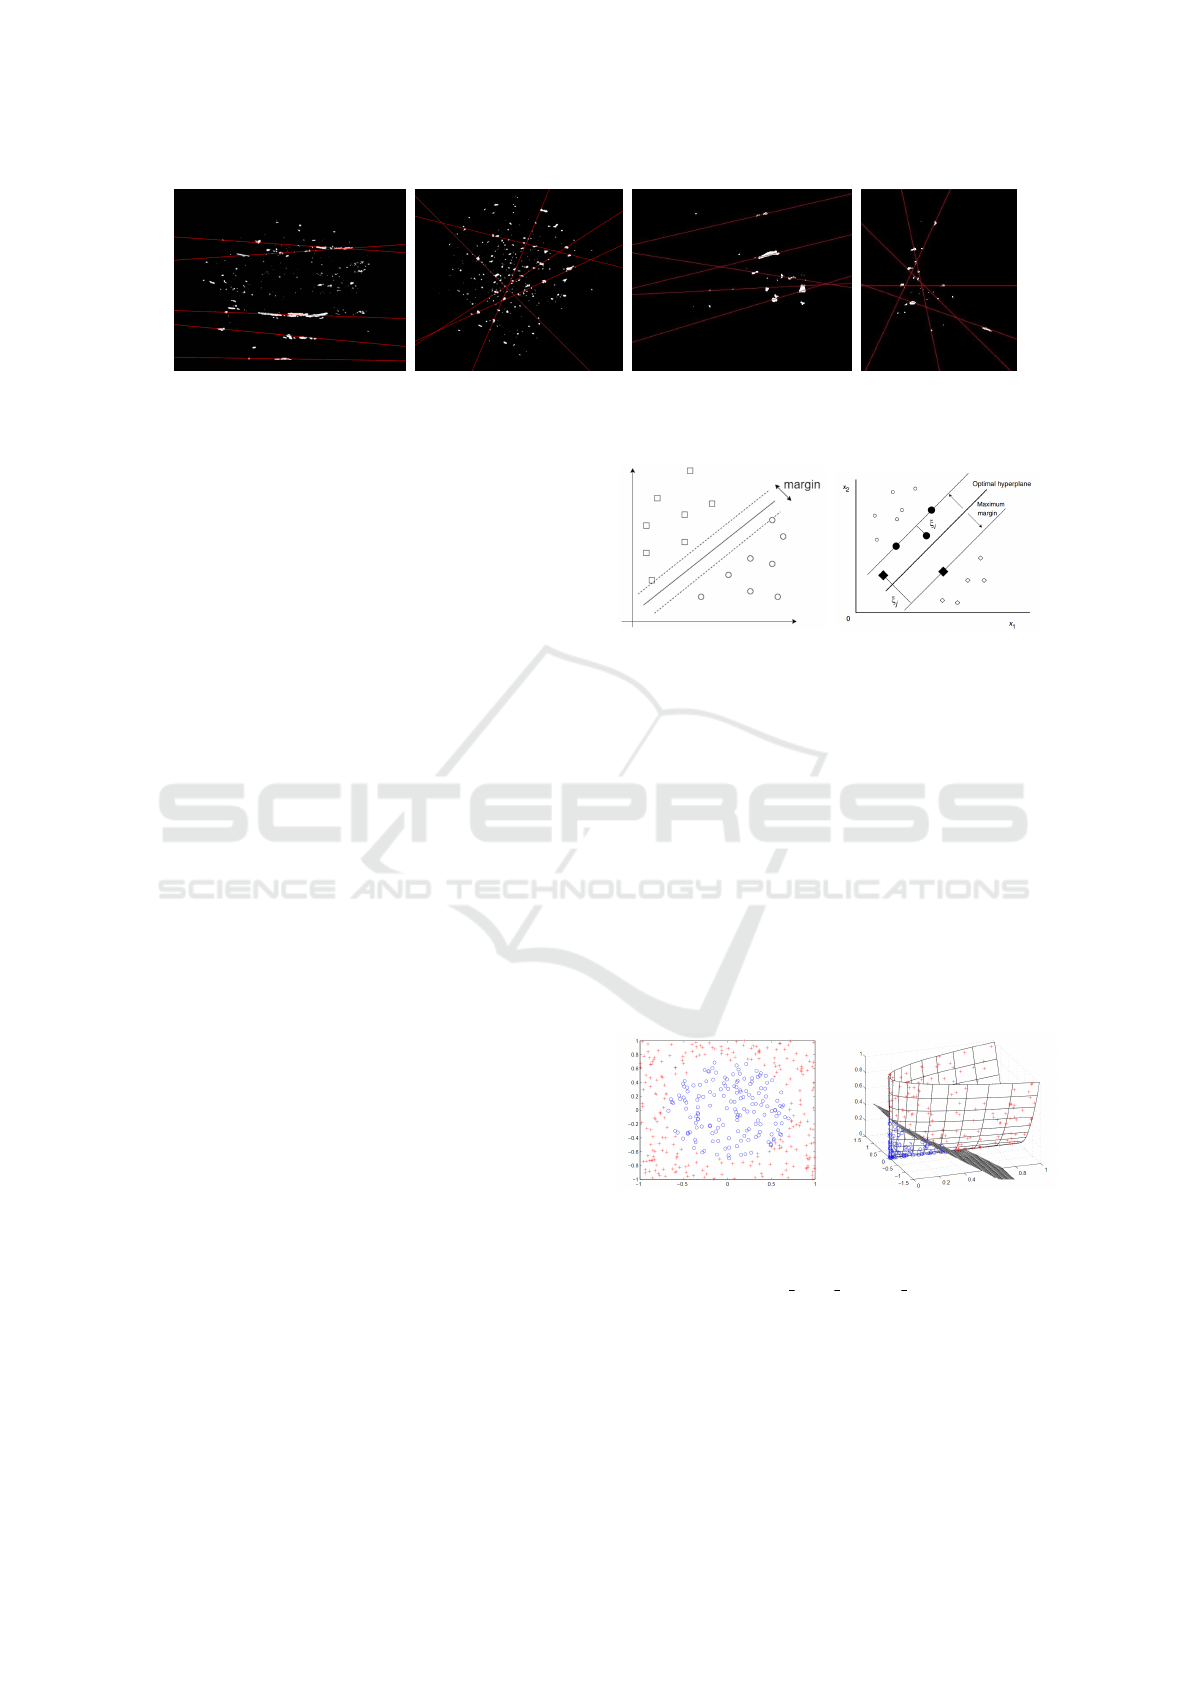
Figure 3: Hough transform results. The red lines represent the detected alignments. From left to right: CoT and SPT
experimental sherds, CoT and SPT archaeological sherds.
3 CLASSIFICATION WITH
LEARNING ALGORITHMS
In this section, we briefly introduce the two classi-
cal ML methods we used to classify the dataset. The
Support Vector Machine (SVM) (Widodo and Yang,
2007) and Convolutional Neural Network (CNN)
(Krizhevsky et al., 2012; de Rezende et al., 2018),
both are supervised learning methods, meaning that
they require a labeled dataset to be trained. In this
study, labels correspond to CoT and SPT techniques.
The big difference between these two methods is
that a feature extraction procedure is essential for the
SVM in order to classify the data. These features may
also provide important additional information in view
of archaeological interpretations. In this archaeologi-
cal sherd study, features are based on the alignments
in the pores structure. While, CNN do not require this
preliminary process, instead the algorithm detects and
extracts necessary features throughout its hidden lay-
ers. In the following two sections we provide a short
overview of these standard methods in the context of
this sherd study.
3.1 Support Vector Machine
Support Vector Machine is a ML method used to per-
form classification tasks. It was initially introduced as
a two-class classification technique, which can be ex-
tended to multiple-class classifier (Widodo and Yang,
2007; Abe, 2010). For data in a n-dimensional space
with two classes, the objective of the SVM classifier
is to find a hyperplane in the n-dimensional space that
separates the two classes. Among all possible hyper-
planes, the objective is to find the one that has the
maximum margin, i.e. the maximum distance to data
points of both classes (see Figure 4, left).
Usually, real-life problems contain noisy data and
may not be efficiently separated by such a hyperplane.
Indeed, if it exists, this hyperplane may have a very
small margin (minimal distance to the points, see Fig-
ure 4, left). To deal with this problem, an additional
Figure 4: Left: an example of how a dataset is separated
in two different classes by a hyperplane. Right: a non-
separable case, with an example of slack variables.
term weighted by a parameter C ∈ R
+
is introduced in
the SVM, in order to specify how many errors can be
accepted in the classification. The parameter C allows
to tune the trade-off between having a wide margin
and the number of admitted errors (that correspond to
the slack variables in Figure 4, right).
Moreover, data may not be separable by a hyper-
plane (see an example Figure 5). In such general
cases, they are projected onto a higher dimensional
feature space, where linear classification is possible.
This is done by the use of a kernel transformation
such as linear, polynomial and Gaussian Radial Ba-
sis Function (RBF) (Widodo and Yang, 2007).
Figure 5: The left picture shows a 2-D set of points impos-
sible to separate using linear SVM. The right picture shows
a kernel transformation of these data in a 3-D space where
they can be easily separated (https://commons.wikimedia.
org/wiki/File:Nonlinear SVM example illustration.svg).
Based on the archaeological question of identify-
ing the CoT or SPT manufacturing techniques on the
basis of sherds, it seems natural to first detect align-
ment of pores in segmented images and then classify
data from these lines. More precisely, the considered
DeLTA 2021 - 2nd International Conference on Deep Learning Theory and Applications
112

features for SVM classification are line intersections
points and dot products between the Hough-detected
lines, as described in Section 2.3. Due to non-linearity
of the data, a RBF Kernel, depending on a parameter
γ, is used to increase the accuracy rate. See Section 4
for technical details and values.
3.2 Convolutional Neural Network
Classification Convolutional Neural Network is a
Deep Learning method (Krizhevsky et al., 2012; de
Rezende et al., 2018) which generally consists of
three main parts (see Figure 6 as an example): an in-
put layer part, where the image is given to the clas-
sifier, a feature extraction (or a hidden layer) part,
and a classification part that uses fully connected lay-
ers (i.e. each neuron of a layer is connected to ev-
ery neurons of the following layer). This overall net-
work provides as an output the probability values for
an input image to belong to each of the classes. In
this work two classes are considered, CoT and SPT.
CNN have shown unequalled performances in image
classification. Such performances are mainly due to
the learning of the hidden network from a huge num-
ber of images. Indeed, a feature extraction network
is classically composed of a sequence of layers, each
one containing bias addition, convolution filters, ac-
tivation function (Rectified Linear Unit, ReLu), and
pooling operation.
We choose to use a transfer-learning procedure
with a pre-modeled and pre-trained network, specif-
ically the GoogLeNet architecture (Szegedy et al.,
2015). The architecture and huge quantity of parame-
ters of the first two parts of this CNN network which
compute image characteristics (e.g. bias, coefficients
of the convolution filters) remained unchanged. Only
the parameters of the third fully connected layer part
were estimated and tested using our dataset, which is
one of the main advantages of using such a network.
For this estimation, we used the DL Matlab toolbox
1
.
All parameters of SVM and CNN are provided in
Section 4.
4 CLASSIFICATION RESULTS
This section presents the classification results ob-
tained on lines, segmented images (see Section 2.2),
and 2-D cross-sections of raw tomographic images.
The considered datasets are as follows:
• 360 segmented binary images (130 from CoT
1
https://it.mathworks.com/help/deeplearning/ref/
trainnetwork.html
sherds and 130 from SPT sherds), used for SVM
and CNN classification.
• 460 grey-scale images (230 from CoT sherds and
230 from SPT sherds), used for CNN classifica-
tion.
Note that the dataset of segmented images is smaller
than the dataset of tomographic images, because the
pore segmentation process can produce empty images
(dark images, which correspond to a slice where no
pores were detected).
As Figure 2 (first line) shows, the CoT experimen-
tal sherds usually have a squared shape, while the SPT
ones are round-shaped. Since this shape is not rel-
evant for manufacturing characterisation, it may in-
duce bias in the classification. To avoid this phe-
nomenon, only the central part of each grey-scale im-
age is considered in the experiments (see Figure 7).
Whatever the classification methods and the input
data, the learning step is performed on 80% of the
dataset and the remaining 20% are used for testing.
4.1 Results with Support Vector
Machine
As mentioned in Section 3.1, a cost parameter C and
the Kernel parameter γ must be tuned in order to pre-
vent under- or over-fitting phenomena. A grid search
is performed to determine the optimal values of these
parameters. From these multiple tests, C was set to
100 and γ to 10. The dataset is randomly shuffled
1000 times and different learning and testing sets are
picked for each run. The prediction accuracy results
averaged over 1000 runs on 72 test images are shown
in Table 1.
4.2 Results with Convolutional Neural
Network
The second method we consider is the classification
by CNN, first on segmented images, and then on raw
images.
As presented in Section 3.2, we use a transfer-
learning procedure with GoogLeNet network which
requires three-dimensional 224 × 224 × 3 images as
inputs; the images are thus resized accordingly. As
the images of our dataset are either binary or grey-
scale, each image is replicated three times to obtain
the desired form. The training and validation set is
composed by 80% of the images of each dataset (more
precisely, 64% of the dataset is used for training and
16% for validation), while the testing set is composed
by the remaining 20% of the images.
The CNN classifier was tested multiple times with
Applications of Learning Methods to Imaging Issues in Archaeology, Regarding Ancient Ceramic Manufacturing
113
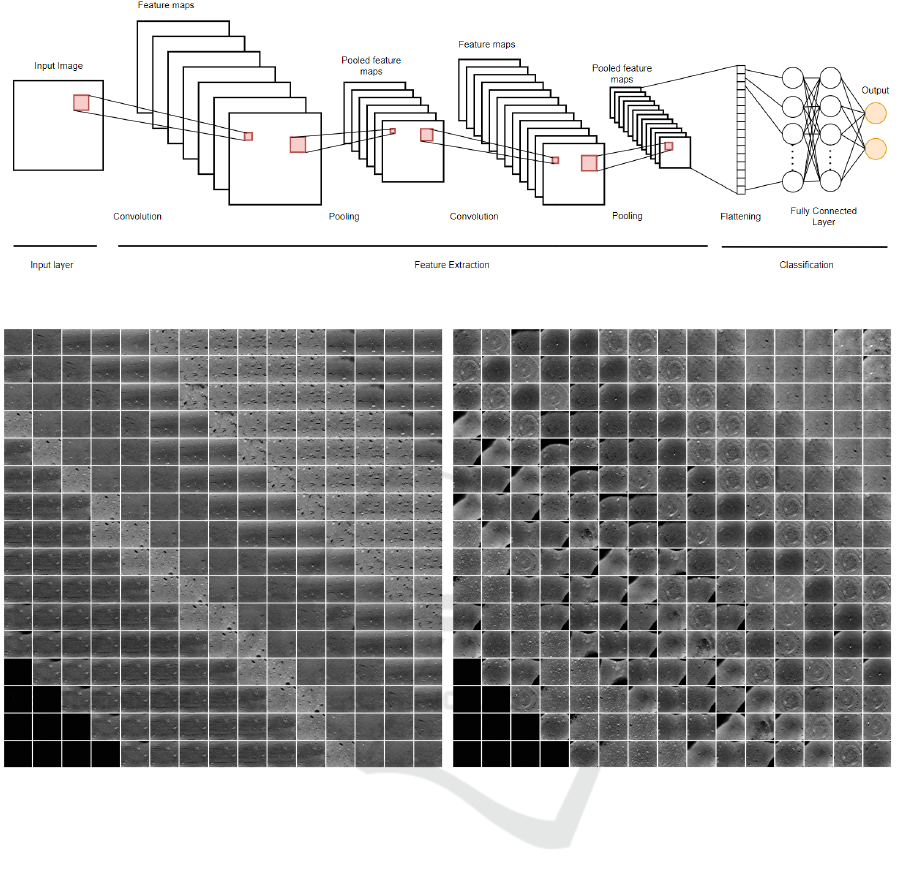
Figure 6: CNN architecture.
Figure 7: Grey-scale tomographic images, cropped central regions. Left: the 230 images composing the CoT dataset. Right:
the 230 images composing the SPT dataset. The 10 black images displayed in the bottom-left corners of each set are not
included in the datasets.
different input parameters, in order to determine their
suitable values for our data. The following parame-
ters are set for each run: number of epochs (number
of complete passes through the training dataset) = 15,
batch size (number of training samples that are fed
to the classifier at once to reduce the computational
time) = 40 images, validation frequency (number of
iterations after which the validation set is fed to clas-
sifier to test its accuracy and update the weights of
the fully connected layers) = 20 iterations, and learn-
ing rate (step size) = 0.0001. These parameter values
are the same for both experiments described below,
i.e. for segmented and grey-scale images.
4.2.1 Segmented Images
The CNN classifier was first tested on segmented im-
ages, in order to take into account the fact that we
are interested in pore alignments for CoT while ran-
dom/spiral distribution are expected in SPT. The pre-
diction accuracy results on 72 test images are shown
in Table 1.
4.2.2 Grey-scale Images
As the CNN classifier showed remarkable improve-
ment in classification with respect to the SVM perfor-
mances, the classifier is tested on the more challeng-
ing set of grey-scale images of Figure 7. The predic-
tion accuracy results on 92 test images are shown in
Table 1.
DeLTA 2021 - 2nd International Conference on Deep Learning Theory and Applications
114

Table 1: Prediction accuracy for each object category and all considered classification methods. The number of images in the
testing dataset is indicated between parentheses. The results are averaged over 1000 runs for the SVM method.
Object category SVM (segmented images + features) CNN (segmented images) CNN (grey-scale images)
SPT 77.7% (36) 88.8% (36) 100% (46)
CoT 79.5% (36) 100% (36) 93.4% (46)
Overall accuracy 78.6% (72) 94.4% (72) 96.7% (92)
4.3 Discussion
Considering the methods applied to segmented im-
ages, the CNN method appears more accurate than
the SVM one. Indeed, the accuracy rates for SVM
roughly hit less than 80%, while they are higher than
90% for CNN for most of the tested situations (see
Table 1). Despite the differences between the classifi-
cation methods, it could be that the features captured
by CNN on segmented images are richer than those
extracted from the lines obtained by the Hough trans-
form on pores.
From these results, it appears that the Deep Learn-
ing method is more competent than the SVM Ma-
chine Learning method in classifying the testing set,
where it provided significantly more accurate results.
Moreover, CNN automatically performs the feature
detection / extraction steps with transfer learning,
whence only the classification network needs to be
trained. For SVM however, each image had to be pre-
processed in order to extract the retained features. Fi-
nally, SVM is 5 times more computationally costly (in
time) than the CNN one.
Ultimately, the CNN procedure gives slightly bet-
ter classification results from grey-scale images than
from segmented images. Yet, some information might
be lost during by the segmentation / pore extraction
procedure.
5 CONCLUSION
Promising results were obtained with Machine Learn-
ing and Deep Learning algorithms for classification
of ancient pottery samples, running on 2-D cross-
sections extracted from a set of µ-CT images. This
will be useful to classify archaeological sherds which
are often damaged and difficult to distinguish from
noisy images. As CNN methods give good results,
different configurations of these techniques can be
further investigated. To improve the classification, we
also plan to acquire more samples and images, with
other modalities and at different resolutions.
However, one of the most important drawbacks of
CNNs is their lack of interpretation in terms of mod-
elling. The advantage of the more traditional image
analysis approaches (like the SVM one) is that it pro-
vides archaeologists with visual and quantitative el-
ements for image interpretation (e.g. the quantity of
parallel pore lines in CoT sherds) that are very useful
for their analysis of the manufacturing process. Many
additional features can also be considered, as for ex-
ample the positions of lines intersection points.
With the same goal, the Hough transform can be
adapted in order to catch circular or spiral-like be-
haviour of pores in SPT images, see (Coli et al.,
2020). Finally, note that higher dimensional versions
of the Hough transform are able to detect surfaces
in 3-D images, see (Beltrametti et al., 2013; Ballard,
1981). They could provide good results on sherd im-
ages.
The quantitative analysis proposed here to dis-
criminate between CoT and SPT manufacturing tech-
niques using pore distribution in µ-CT scans of sherds
can be applied to other pottery building processes.
These promising results address similar issues con-
cerning other markers of the micro-structures inher-
ited from the building process. More specifically,
the spatial organisation of mineral inclusions also re-
flects the technical gestures implemented during pot-
tery making. The present approach may provide use-
ful complementary classification results on such in-
clusions, though their segmentation from µ-CT im-
ages is more difficult than those of the pores due to
the variety of materials (hence of intensities in im-
ages). Next step will be to jointly process these dif-
ferent markers in order to refine the diagnostic and to
furnish more robust and accurate information.
ACKNOWLEDGEMENTS
This work was supported by the French National
Research Agency, with the reference number ANR-
15-IDEX-0001, IDEX UCA
JEDI
“Multiscale Tomog-
raphy: Imaging and Modelling Ancient Materials,
Technical Traditions and Transfers - TOMAT” project
and through the 3IA C
ˆ
ote d’Azur Investments, with
the reference number ANR-19-P3IA-0002.
We thank the reviewers for their comments and
Applications of Learning Methods to Imaging Issues in Archaeology, Regarding Ancient Ceramic Manufacturing
115

suggestions.
REFERENCES
Abe, S. (2010). Support Vector Machines for Pattern Clas-
sification. Springer Publishing Company, Incorpo-
rated, 2nd edition.
Ballard, D. (1981). Generalizing the Hough transform to de-
tect arbitrary shapes. Pattern Recognition, 13(2):111–
22.
Beltrametti, M., Massone, A., and Piana, M. (2013). Hough
Transform of Special Classes of Curves. SIAM Jour-
nal on Imaging Sciences, 6(1):391–412.
Coli, V. L., Gomart, L., Pisani, D., Cohen, S., Blanc-
F
´
eraud, L., Leblond, J., and Binder, D. (2020). Micro-
computed tomography for discriminating between dif-
ferent forming techniques in ancient pottery: new seg-
mentation method and pore distribution recognition.
Under revision for publication.
de Rezende, E. R., Ruppert, G. C., Th
´
eohilo, A., Tokuda,
E. K., and Carvalho, T. (2018). Exposing computer
generated images by using deep convolutional neural
networks. Signal Processing: Image Communication,
66:113 – 126.
Dia, K. (2020). Machine learning for imaging issues in ar-
chaeology. Master’s thesis, Universit
´
e Savoie Mont
Blanc.
Gomart, L. (2010). Variabilit
´
e technique des vases du
Ruban
´
e r
´
ecent du Bassin parisien (RRBP) et du
Villeneuve-Saint-Germain (VSG) : un cas d’
´
etude
dans la vall
´
ee de l’Aisne. Bulletin de la Soci
´
et
´
e
pr
´
ehistorique franc¸aise, 107(3):537–48.
Gomart, L. (2014). Traditions techniques et production
c
´
eramique au N
´
eolithique ancien.
´
Etude de huit sites
ruban
´
es du Nord-Est de la France et de Belgique. Lei-
den: Sidestone.
Gomart, L., Weiner, A., Gabriele, M., Durrenmath, G.,
Sorin, S., Angeli, L., Colombo, M., Fabbri, C., Maggi,
R., Panelli, C., Pisani, D., Radi, G., Tozzi, C., and
Binder, D. (2017). Spiralled patchwork in pottery
manufacture and the introduction of farming to South-
ern Europe. Antiquity, 91(360):1501–14.
Krizhevsky, A., Sutskever, I., and Hinton, G. E. (2012).
Imagenet classification with deep convolutional neu-
ral networks. In Proceedings of the 25th Interna-
tional Conference on Neural Information Processing
Systems - Volume 1, NIPS’12, page 1097–1105, Red
Hook, NY, USA. Curran Associates Inc.
Mukhopadhyay, P. and Chaudhuri, B. (2015). A survey of
Hough Transform. Pattern Recognition, 48(3):993–
1010.
Salanova, L., Vieugu
´
e, J., and Gomart, L. (2010). Meth-
ods of study of large ceramic complexes: series and
sets of Neolithic pottery from Kovachevo (Bulgaria).
Arheologia Sofia, (3–4):7–23.
Szegedy, C., Wei Liu, Yangqing Jia, Sermanet, P., Reed, S.,
Anguelov, D., Erhan, D., Vanhoucke, V., and Rabi-
novich, A. (2015). Going deeper with convolutions. In
2015 IEEE Conference on Computer Vision and Pat-
tern Recognition (CVPR), pages 1–9.
Widodo, A. and Yang, B.-S. (2007). Support vector ma-
chine in machine condition monitoring and fault di-
agnosis. Mechanical Systems and Signal Processing,
21(6):2560 – 2574.
DeLTA 2021 - 2nd International Conference on Deep Learning Theory and Applications
116
