
GRASP: Graph-based Mining of Scientific Papers
Navid Nobani
1,2
, Mauro Pelucchi
3
, Matteo Perico
4
, Andrea Scrivanti
3
and Alessandro Vaccarino
3
1
Dept. of Informatics, Systems & Communication, University of Milan-Bicocca, Milan, Italy
2
Digital Attitude, Milan, Italy
3
CRISP Research Center, University of Milan-Bicocca, Milan, Italy
4
Or
`
obix, Bergamo, Italy
alessandro.vaccarino@gmail.com
Keywords:
Graph Networks, Scientific Documents, Information Retrieval, Literature Review.
Abstract:
Over the past two decades, academia has witnessed numerous tools and search engines which facilitate the
retrieval procedure in the literature review process and aid researchers to review the literature with more ease
and accuracy. These tools mostly work based on a simple textual input which supposedly encapsulates the
primary keywords in the desired research areas. Such tools mainly suffer from the following shortcomings: (i)
they rely on textual search queries that are expected to reflect all the desired keywords and concepts, and (ii)
shallow results which makes following a paper through time via citations a cumbersome task. In this paper,
we introduce GRASP, a search engine that retrieves scientific papers starting from a sub-graph query provided
by the user, offering (i) a list of time papers based on the query and (ii) a graph with papers and authors as
vertices and edges being cited and published-by. GRASPhas been created using a Neo4j graph database, based
on DBLP and AMiner corpora provided by their API. Acting performance evaluation by asking ten computer
science experts, we demonstrate how GRASPcan efficiently retrieve and rank the most related papers based on
the user’s input.
1 INTRODUCTION
Nowadays, thanks to various online libraries which
index and provide scientific papers of different fields,
researchers seldom have problems with finding the
desired sources. However, paradoxically, the abun-
dance of such sources, while theoretically should play
a role in favor of the researcher, practically will give
her hundreds or thousands of new resources which in
the best case demand a considerable amount of time
to be processed manually.
A common procedure used in literature review
may consist of the following iterative steps: (i) finding
preliminary keywords related to the research field; (ii)
using these keywords to find new papers and articles;
(iii) filtering out the unrelated sources by gradually
going through contents of each source (e.g. abstract,
conclusion); (iv) finding articles which cite or have
been cited by this work.
Following this procedure requires a considerable
amount of time for the researcher, since the third and
fourth steps are not always straight-forward. More-
over, to filter the articles as related/unrelated, one of-
ten needs to read at least the sections such as abstract
or conclusion.
In this paper, we propose GRASP, a research tool
which facilitates researchers’ process of literature re-
view and exploration. Starting from user input (cus-
tomized sub-graph query and a list of partitions),
GRASPbuilds a network of related documents based on
mining and scoring a corpus of articles. The scope is
to provide a set of articles (connected via citations),
both as a ranked list and a graph, which contains
the interconnected and influential works to the user’s
query. Figure 1 depicts a graphical overview of the
GRASPtool.
Figure 1: A graphical overview of GRASP.
176
Nobani, N., Pelucchi, M., Perico, M., Scrivanti, A. and Vaccarino, A.
GRASP: Graph-based Mining of Scientific Papers.
DOI: 10.5220/0010518901760183
In Proceedings of the 10th International Conference on Data Science, Technology and Applications (DATA 2021), pages 176-183
ISBN: 978-989-758-521-0
Copyright
c
2021 by SCITEPRESS – Science and Technology Publications, Lda. All rights reserved

Contribution. The contribution of this work is
twofold:
1. Knowledge Graph: we provide a rich network of
connected papers through citation relations which
in turn can be used as the backbone of graph-
based scholarly tools providing various applica-
tions such as search engines and recommender
systems.
2. Working Demo (Video Available): we imple-
mented our tool and evaluated its performance
through a user study among university re-
searchers. A video of a working example is pro-
vided Online
1
.
The paper is organized as follows. Section 2 dis-
cusses some related work, section 3 presents an or-
ganic overview of GRASPsystem and section 4 intro-
duces concepts, definitions and problems. Section
5 gives a look at the big scholarly data, by describ-
ing the data warehouse of GRASP. Section 6 discusses
the retrieval technique, the scoring method and some
hints about GRASP. Section 7 presents the experimen-
tal evaluation of our technique, while section 8 draws
conclusions and future work.
2 RELATED WORK
GRASPworks in the context of Big Scholarly Data.
Nowadays, many online repositories for Big Schol-
arly Data are available, and many powerful analysis
tools were developed to help researchers and students
to access them and run queries to extract the required
information (Xia et al., 2017).
In the Big Data context, storing and processing a
high volume of unstructured data is a recurring chal-
lenge. In particular, in the tools dealing with this type
of data, the aspects of data analytics that provide re-
searchers with a series of solutions able to quickly ex-
tract information from these repositories become of
particular relevance.
GRASPcan be considered as an hybrid application
since on one hand it applies text analysis tools to re-
trieve the required information from the text, and on
the other hand, it uses a knowledge graph (see sec-
tion 4) to generate a ranked list of documents match-
ing the user’s criteria. For this reason, it falls into the
categories of Research Management and Recommen-
dation Systems as outlined by (Khan et al., 2017).
In the past four decades the mining of scientific
texts has been targeted by numerous number of re-
searchers, mostly in computer science and computa-
1
https://youtu.be/waKVJgTwqf4
tional linguistics fields. These works can be catego-
rized into four parts:
(i) Information Extraction, Classification, and Clus-
tering of the Documents. For instance, in their
work (Sch
¨
afer et al., 2008) use NLP techniques to
extract factual relations from scientific texts, while
(Williams et al., 2014) introduce a method for in-
formation extraction and document clustering of aca-
demic texts. (Sch
¨
afer and Kiefer, 2011) introduce
a semantic search, citation classification of scientific
papers.
(ii) Computing Similarity Ranks of Academic Papers
as computing citation-based impact measures (Hoang
et al., 2010) and creating a relatedness score done (Ef-
fendy et al., 2014).
(iii) Focusing on Authors, their Works and Networks
they belong to (Citation Graphs and Citation Net-
works). For example (Cesarini et al., 2018) models
DBLP as a graph and explores authors, their rela-
tions and similarity with other authors. In a similar
work (Mercorio et al., 2019) create a graph network
of authors and their academic publications. (Tran
et al., 2012) use an LDA based topic modelling in or-
der to facilitate author matching within two different
databases. Both (Za and Spagnoletti, 2013) and (Zhao
and Strotmann, 2015) present network citation solu-
tions that use Graph modelling to investigate citation
patterns and sub-networks.
(iv) Big Scholary Data Integation and Automatic Ex-
traction of Information. (Williams et al., 2014) and
(Ororbia et al., 2015) describe CiteSeerX and how it
integrates data from across the Web and performs au-
tomatic extraction, clustering, entity linking and name
disambiguation on that data.
A recent work incorporating a network of papers
selected according to a topic is Connected Papers
2
which creates a graph of similar papers based on mu-
tual citations and allows researchers to have a naviga-
ble overview of the existing works related to a specific
field of studies. The main difference between Con-
nected Papers and GRASPis the scope: GRASPis not a
general purpose system but rather it’s built to support
the literature review process with a scientific frame-
work. GRASPis able to run tailored queries on specific
partitions of a big scholarly data warehouse, and give
in output a network of related documents based on
mining and scoring a corpus of articles. Moreover,
there are substantial differences regarding the rank-
ing algorithm that helps and guides our users to start
the literature review process from the most influential
works related to the initial query.
While some former works address generating a
graph database or network from scientific papers aim-
2
https://www.connectedpapers.com/
GRASP: Graph-based Mining of Scientific Papers
177

ing at creating relations among authors and their
works, to the best of our knowledge, none of these
works elaborate on retrieval of the linked papers (via
citation) through time.
3 THE GRASPSYSTEM
As described in Figure 1, the user provides as input to
the system a sub-graph query and a set of partitions.
GRASPuses the sources to furnish as output a citation
graph and the paper list.
Sub-graph Query. A sub-graph query (or a group
of Family items) is a JSON which consists of one or
more components (see Figure 2). These components
aim is to narrow down the research results by provid-
ing a recipe which assists GRASPto arrive to the most
related results, through relative, alternative, reinforc-
ing and not-related terms(see Definition 3 for more
details).
Partitions. Partitions are keywords (i.e. fields of
study) which aim to reduce the number of documents
analysed and ranked by the system.
Scoring. After applying a primarily filter using the
partitions, GRASPutilizes the sub-graph query to score
the remaining documents based on the provided fam-
ilies and considering the title and the body of each
document(see section 6.1).
Upon scoring the documents in the database, the fol-
lowing outputs will be generated:
Citation Graph. A visual output as the representa-
tion of a graph which in turn depicts how authors and
their publications are connected through publish and
reference edges (see Figure 4).
Paper List. As the second output GRASPprovides a
list of publications sorted by the scoring function de-
scribed above, together with their rank and a link to
the publication source.
4 CONCEPTS, DEFINITIONS,
PROBLEM
Before introducing concepts, we go through some
definitions about the data model behind GRASP. The
data warehouse of our system is built on a graph
database, as this databases present relationships more
efficiently, specially dealing with interconnected data
and their flexibility due to their schema-free nature
(Angles and Gutierrez, 2008).
Definition 1: Directed Labeled Multi-graph. Sim-
plifying, a Directed labeled multi-graph G is defined
by the following tuple:
G = (N, E, ln, le)
defined as
N is the set of nodes;
E is the set of edges;
ln is the set of node labels, each node could have one
or more labels;
le is the set of edge labels;
Each node n from N has a set of property P
0
. An
edge e from the set E represents a relation be-
tween a node n
0
and a node n
00
. Each e has a set of
property P
00
.
Definition 2: Knowledge Base. With KB = {p
1
, p
2
,
p
3
, . . . }, we refer the Knowledge base of Documents.
Each d is described by a set of property (e.g. title,
abstract, ...) and it is represented as a node n of N in
G (see Definition 1).
As described in (Jarke et al., 1989), a KB is a rep-
resentation of heuristic and factual information, in
the form of facts, assertions and deduction rules.
GRASPneeds two features to extract information from
its KB:
• An Inference engine that playing the role of an
interpreter;
• A Man-machine interface that transfers queries
from and answers to the user.
GRASPuses a particular form of KB, a Knowledge
Graph
3
. In GRASPKnowledge Graph nodes are en-
tities with different types and attributes, meanwhile,
edges are relations of different types.
Definition 3: Sub-graph Query. With
O = { f
1
: {F, I, N, D,V, A}, f
2
: {F, I, N, D,V, A}, . . . }
we define a Sub-graph Query O. The Sub-graph
Query O defines a domain of research interests com-
posed by a list of items f
i
.
f
i
99K {p
1
, p
2
, p
3
, . . . } = P
i
Each item f
i
generates a list of phrases using alter-
natives and variations, we call each generated list of
phrases a Phrases Set P
i
. Each p
j
identifies a relevant
phrase for the domain of research interests. The con-
cept of relevant phrase is one key of the technique:
the search space is expanded, by adding information
3
In 1960, Semantic Networks were defined as representa-
tion frameworks that can capture a wide range of entities.
Knowledge Graph is a variant of semantic network with
added constraints. The particular feature of a Knowledge
graph is the ability to encode structured information of en-
tities and their rich relations.
DATA 2021 - 10th International Conference on Data Science, Technology and Applications
178

O = {
"classifi": {
"family": "MODEL",
"importance": 0.8,
"needs": ["ai"],
"drug":["expert systems", "learning system", "path"],
"alternatives": ["artificial intelligence",
"machine learning",
"artificial intelligence system"],
"variations": ["er", "cation"]
}
}
Figure 2: Example of sub-graph Query for the domain of
artificial intelligence.
related to the relevant phrases, on the basis of rela-
tions present in the knowledge graph.
To generate the list of phrases p, each f
i
is charac-
terized by the following specification planned by the
researcher during the initial phase of the literature re-
view:
(i) F is the family name related to the field of
study;
(ii) I ∈ (0, 1] (Importance) identifies with a value
the weight of f ;
(iii) N (Needs) describe the mandatory context
where f is considered valid for the research
purpose;
(iv) D (Drugs) identify the not-mandatory terms
that improve the relation between an item with
F;
(v) V (Variations) with respect to the field of
study;
(vi) A (Alternatives) to the defined field of study.
Figure 2 presents an example of a small sub-graph to
mining papers related to the domain of the artificial
intelligence. In this case our domain research if arti-
ficial intelligence, where the F family is represented
by MODEL, which in this case identifies a model in
our domain as representing the context expressed by
the needs (i.e. ai); this family has importance 0.8 for
our research domain; expert systems, learning system
and AI path are not-mandatory terms that improve
the relationship between the retrieve documents and
the MODEL family; artificial intelligence, machine
learning, artificial intelligence system are alternatives
for the MODEL family in the AI domain; with respect
to the field of study, we will use terms such as er and
caution calculate new variations for our research do-
main.
Definition 4: Family. With
F = {(P, N, D, I) s.t. P Phrases Set}
we define a Family F . A Family F is a set of research
document characterized by same field of study (i.e.
the same Family name F).
Each F is defined by the following attributes:
(i) P is a Phrases Set generated by an item f of
the Sub-graph Query with his variations V and
alternatives A;
(ii) N represents the sets of Needs N of the item f ;
(iii) D is the sets of Drugs D of the item f ;
(iv) I is the importance of of each phrase generated
by f within his Family F .
We can now specify the concept of Query, to illus-
trate our approach to sub-graph query-based mining a
Knowledge base of Scientific Papers.
Definition 5: Query. Given a Document d and the
sub-graph query O, a query q is a couple of q: <d,
O>.
Problem 1: Given a knowledge base KB of scientific
documents and a query q, return the result set RS =
{d
1
, d
2
, . . . }, that contains documents d
i
retrieved in
KB d
j
∈ KB such that d
i
satisfies query q.
5 DATA
To build the knowledge base of scientific papers
we used the citation network dataset from DBLP
4
and ArnetMiner
5
; the former gives the citation
network, the latter adds further data, such as the
field of study, by searching and performing data
mining operations against academic publications on
the Internet, using social network analysis to iden-
tify connections between researchers, conferences,
and publications (Tang et al., 2008). This allows
ArnetMiner(or AMiner) to provide services such as
expert finding, geographic search, trend analysis,
reviewer recommendation, association search, course
search, academic performance evaluation, and topic
modeling.
For our work we used the v11 version (Sinha
et al., 2015), containing 4,107,340 papers and
36,624,464 citation relationships.
As specified in section 4, we choose a graph-
based approach that enable us to generate an easy
representation of relationships, while achieving
higher performance and flexibility.
To obtain this scope, we choose to build the
knowledge base on top of Neo4j (Robinson et al.,
2015) that uses the Cypher declarative query lan-
guage (Francis et al., 2018) to query the graph.
4
https://dblp.org/
5
https://www.aminer.org/
GRASP: Graph-based Mining of Scientific Papers
179
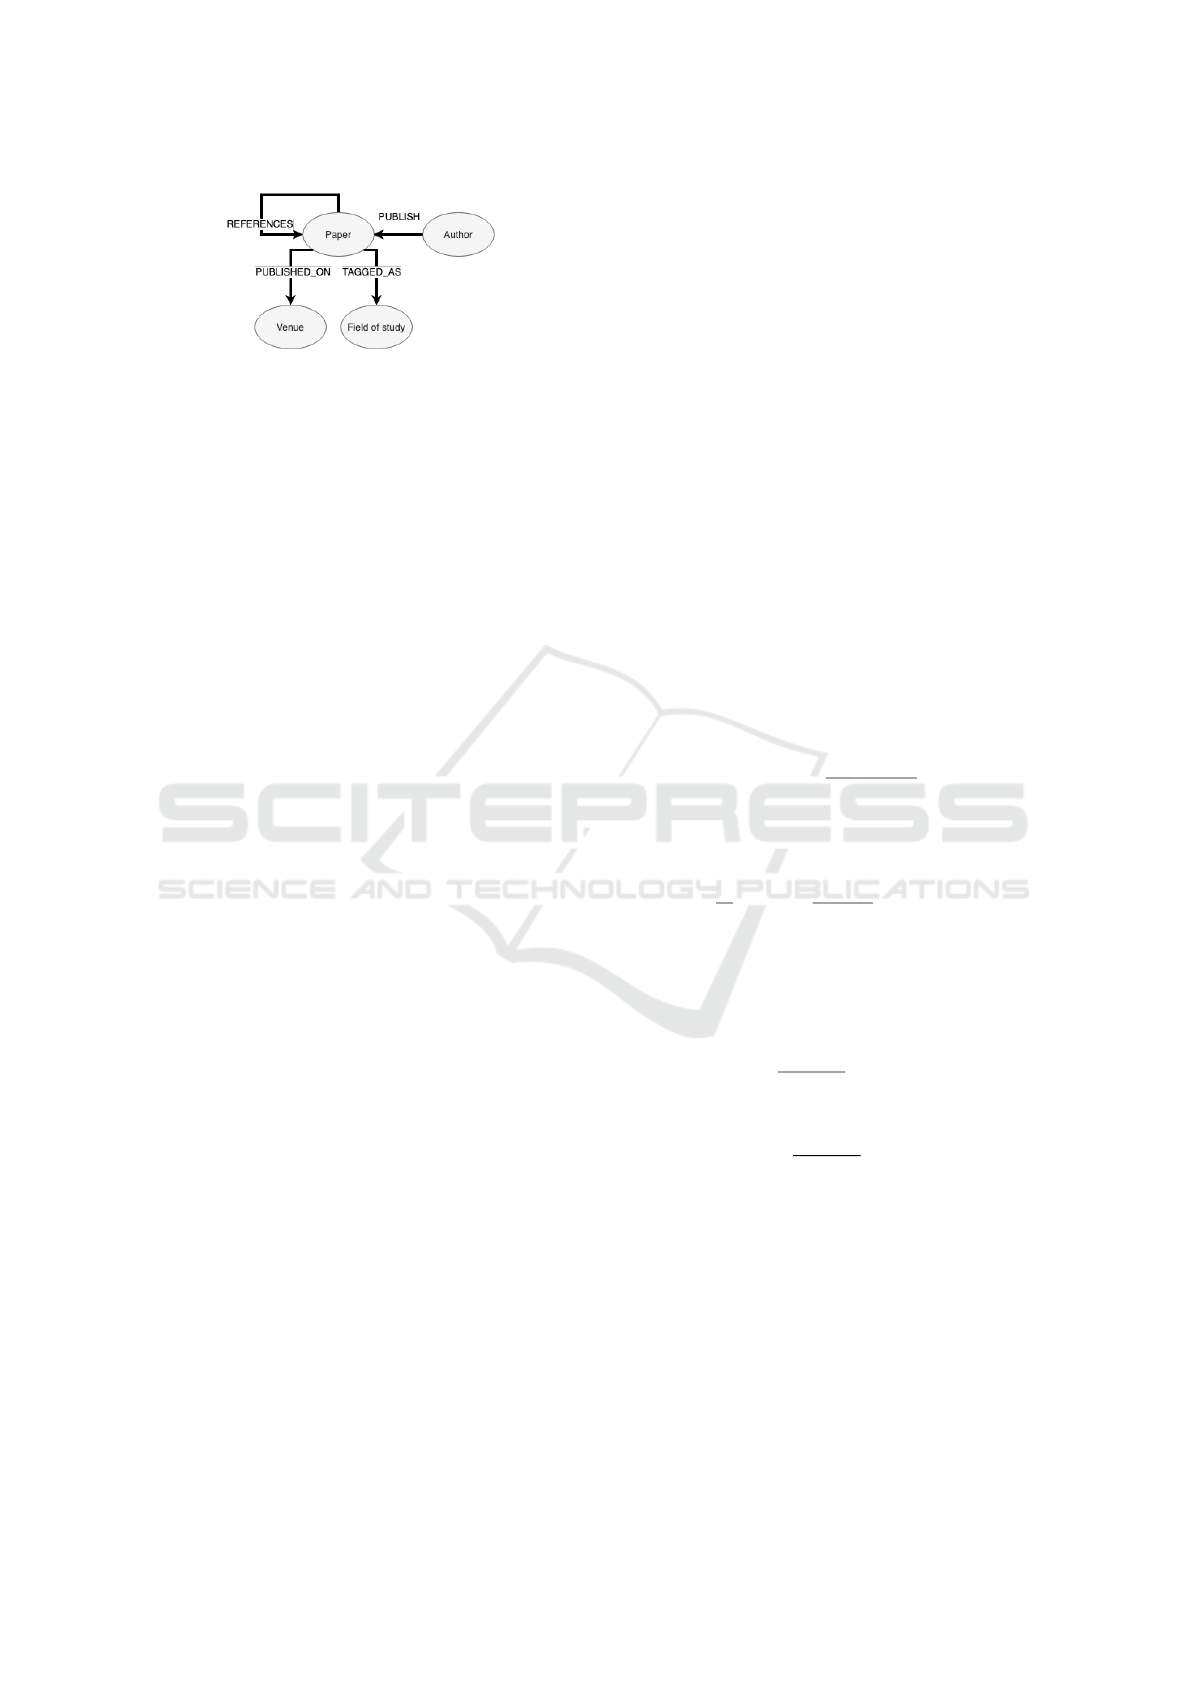
Figure 3: Data Model.
The knowledge base data model is represented in
Figure 3. Raw data are processed and transformed to
fit the data model structure, and loaded into a Neo4j
graphDB instance; in this way we are able to use
Cypher to query the knowledge base.
The relationships shown in the data model are created
as specified in (Sinha et al., 2015), directly form the
dataset; then we have the following labels for each
type of node:
• Author: is an author of one or more Papers; is
identified by id, and has a name;
• Paper: is the main label of the model; can ref-
erences to other Papers, is published on a venue,
and can have Fields of study (FOS); is identified
by an id, and its mostly relevant attributes are title,
year, abstract;
• Venue: can be a conference, journal, workshop or
book, with their specific attributes; common at-
tributes are id and name;
• Field of Study (FOS): is the fields of study, com-
ing from MAG database (Sinha et al., 2015) and
extracted using NLP techniques; a Paper can have
more than one FOS, with the associated score.
6 METHODOLOGY
The following section describes the formulas used to
calculate the scoring values of a document with re-
spect to a phrase and to a Family.
Document. A document d is a couple formed by title
and body.
Title
d
= {(p
1
, ..., p
t
) s.t.p
i
phrase}
Body
d
= {(p
1
, ..., p
c
) s.t.p
i
phrase}
Thus,
Document d = (Title
d
, Body
d
)
For scoring purposes, we applied TF-IDF (term
frequency-inverse document frequency) formula to
the corpus of the documents.
T FIDF
d
= {(p
i
, r(p
i
))
s.t. p
i
∈ Body
d
and r(p
i
) T F −IDF rank o f p
i
in Body
d
}
We recall that a Family F is a collection of Phrases
Set P with related features: Needs, Drugs and Impor-
tance.
F = {(P, N, D, I) s.t. P Phrases Set}
6.1 Scoring
The definition of the Document scoring formula con-
siders the composition of four weights functions:
• Title scoring function;
• Body scoring function;
• Needs coefficient;
• Drugs coefficient.
Title scoring function of a Phrases Set P and docu-
ment d:
T (P, d) =
|Title
d
∩ P|
|Title
d
|
Body scoring function of a Phrases Set P and docu-
ment d:
B(P, d) =
1
|P|
∑
p∈P
1 −
r(p)
|T FIDF
p
|
if Body
p
∩ P 6=
/
0
0 otherwise
Finally, as scoring functions, drugs and needs related
to a Phrases Set P and document d can be represented
as:
N(d) =
(
|N∩Body
d
|
|N|
N 6=
/
0
1 otherwise
D(d) =
(
1 +
|D∩Body
d
|
|D|
D 6=
/
0
1 otherwise
Thus the overall scoring function of the Document d
with respect to the an element of a Family F given by
(P, N, D, I) (here represented using only P) is:
s(P, d) = (T (P, d) +B(P, d)) I · D(d) · N(d)
Once the scoring function for the elements of a fam-
ily is defined, it is possible to introduce the scoring
function of the document d with respect to an entire
family F . To avoid unbalances related to different
family sizes, only elements of the family with Phrases
DATA 2021 - 10th International Conference on Data Science, Technology and Applications
180
Set that have not-empty intersection with the body of
the document are taken into account in this evaluation.
For simplicity, we represent an element (P, N, D, I) us-
ing only P. Given a family F and a document d, we
define S the scoring function of the document d with
respect to the family F as:
S(F ,d) =
∑
P∈F
s(P,d)
1
|{P s.t. Body
d
∩P 6=
/
0}|
In addition, for queries containing multiple families
we can define a Total Rank calculation for a doc-
ument d as the product of scoring functions for all
families {F }
F ∈O
:
∏
F ∈O
max(S(F , d), ε), ε > 0
7 RESULTS
7.1 User Evaluation Methodology
GRASPwas developed and tested on several use cases.
The results of those cases were passed to a pool of
experts (PhD students and researchers) for a model
evaluation. Two sets of metrics are adopted, both in-
spired by Information Retrieval performance metrics
(see (Buttcher S., 2016; Dupret, 2011)).
The first one is focused on the overall consistency
of documents extracted by GRASP, despite of the grade
of coherence. It is based on the following metrics:
• Precision at k Documents (P@k);
• Precision at R (P@R);
• Average Precision (AP).
The second one is more focused on the grade of
properness and appropriateness of documents ex-
tracted by GRASP, based on following metrics:
• Discounted Cumulative Gain (DCG);
• Normalized Discounted Cumulative Gain
(nDCG).
7.2 Evaluated Use Cases
In this section, some user evaluation cases are re-
ported with associated evaluation metrics. Each use
case adopts its own sub-graph.
The evaluation process of the system is structured
as following:
(i) Sub-graph query authoring;
(ii) Choice of partitioning keys;
(iv) Executing a selection query on the knowledge
database;
(v) Application of our scoring technique;
(vi) Evaluation of results with ten university re-
searchers.
The research question we addressed can be summa-
rized as follows: can the result be effectively used for
the literature overview process? Is the document re-
turned by the system actually relevant to the search
domain and query? Is the position of the document
within the list returned by GRASPcorrect? In other
words, is the ranking of documents with respect to
their relevance to the research domain?
As far as evaluation is concerned, the results of the
scoring phase are subject to validation by ten univer-
sity researchers who have calculated the indicators as
indicated in section 7.1. The evaluation phase is fo-
cused on the 10 most relevant papers, extracted by
GRASP.
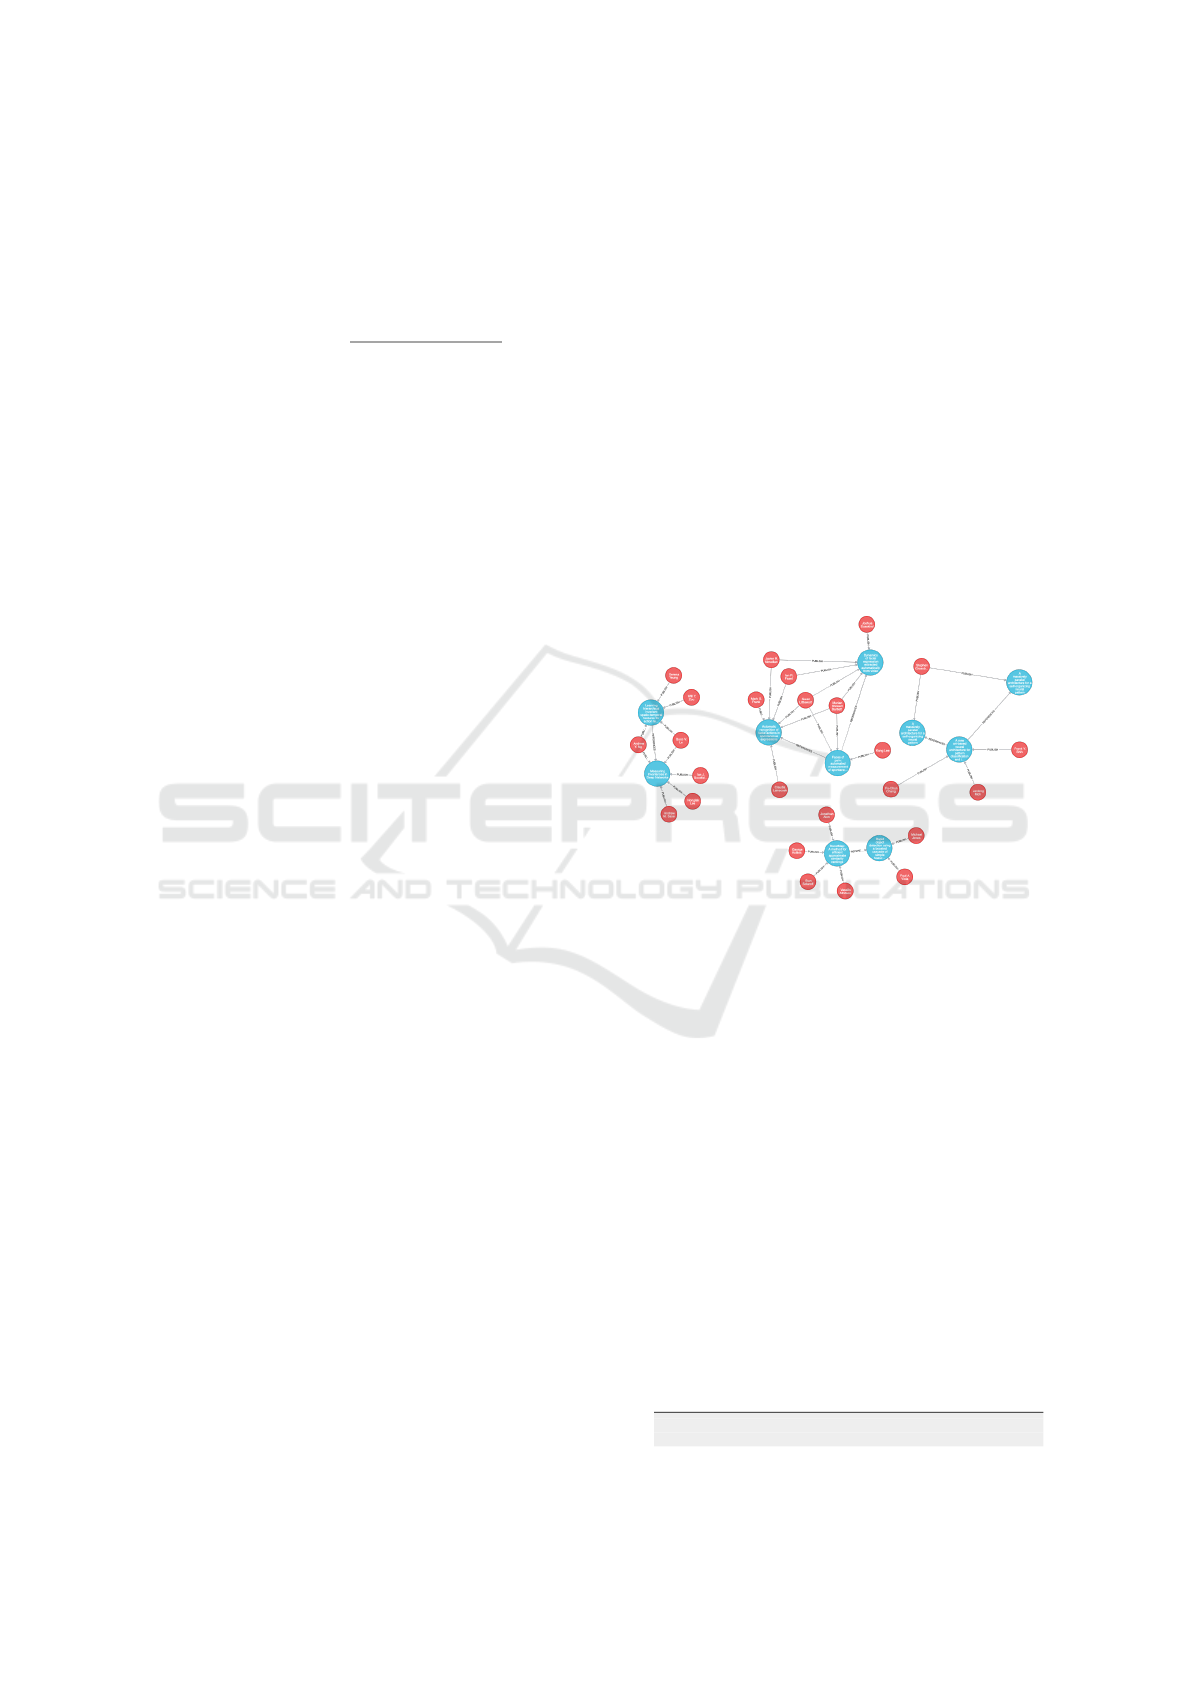
Figure 4: Working example - Computer Vision and
Deep Learning (the original figure is available here
http://tiny.cc/93gwtz).
GRASPwas then evaluated on eight different scenarios:
(i) AI & Natural language processing;
(ii) Computer Vision and Deep Learning (Figure
4);
(iii) Data Quality and KDD Processes;
(iv) Robotics and Autonomous systems;
(v) Function as a Services and cloud computing;
(vi) Big Data and New Data warehouse;
(vii) Map-Reduce for econometric;
(viii) Programming language and type-safe chal-
lenge.
For each scenario, each expert provided evaluations
on coherence and properness. For example, for Com-
puter Vision and Deep Learning, the following Fami-
lies, partitions and ontology has been provided:
1 F a m i l i e s = [ ”COMPUTERVISION” , ”DEEPLEARNING” ]
2 P a r t i t i o n = [ ” c o m p u t e r v i s i o n ” , ” image r e c o g n i t i o n ” ,
GRASP: Graph-based Mining of Scientific Papers
181

3 ” d ee p l e a r n i n g ” ]
4
5 Ont = {
6 ” i m a g e ” : {
7 ” fa m i l y ” : ”COMPUTERVISION” , ” i m p o r t a n c e ” : 1 ,
8 ” n e e d s ” : [ ’ a n a l y s i s ’ , ’ r e c o n s t r u c t i o n ’ , ’
p r o c e s s i n g ’ , ’ s e g m e n t a t i o n ’ , ’
enh a n ce m e nt ’ , ’ r e c o g n i t i o n ’ ] , ” d r u g ” : [ ”
t e x t ” ] ,
9 ” a l t e r n a t i v e s ” : [ ” fr a m e ” , ” s i g n a l ” ] ,
10 ” v a r i a t i o n s ” : [ ] } ,
11 ” p a t t e r n ” : {
12 ” fa m i l y ” : ”COMPUTERVISION” , ” i m p o r t a n c e ” : 1 ,
13 ” n e e d s ” : [ ” r e c o g n i t i o n ” ] , ” d r u g ” : [ ] ,
14 ” a l t e r n a t i v e s ” : [ ’ a n a l y s i s ’ ] ,
15 ” v a r i a t i o n s ” : [ ] } ,
16 ” dee p l e a r n i n g ” : {
17 ” fa m i l y ” : ”DEEPLEARNING” , ” i m p o r t a n c e ” : 1 ,
18 ” n e e d s ” : [ ] , ” dru g ” : [ ” t e x t ” ] ,
19 ” a l t e r n a t i v e s ” : [ ” m ac h i ne l e a r n i n g ” , ” n e u r a l
n e t w o r k ” ] ,
20 ” v a r i a t i o n s ” : [ ] } ,
21 ” i n f o r m a t i o n ” : {
22 ” fa m i l y ” : ”COMPUTERVISION” , ” i m p o r t a n c e ” : 0 . 5 ,
23 ” n e e d s ” : [ ” r e t r i e v a l ” ] ,
24 ” d r u g ” : [ ” s y s t e m ” ] , ” a l t e r n a t i v e s ” : [ ] ,
25 ” v a r i a t i o n s ” : [ ] } ,
26 ” g r a p h i c s ” : {
27 ” fa m i l y ” : ”COMPUTERVISION” , ” i m p o r t a n c e ” : 0 . 6 ,
28 ” n e e d s ” : [ ” c o m p u t e r ” ] ,
29 ” d r u g ” : [ ] , ” a l t e r n a t i v e s ” : [ ] ,
30 ” v a r i a t i o n s ” : [ ] }
31 }
The table 1 reports the output.
Table 1: Top 5 output papers applied to the example de-
scribed above.
TITLE
TOTAL
RANK
COMPUTER
VISION
DEEP
LEARNING
A massively
parallel architecture
for a self-organizing
neural pattern
recognition machine
9295 98.2472 94.6083
Learning
hierarchical invariant
spatio-temporal
features for action
recognition with
independent
subspace analysis
8091.76 98.298 82.3186
Measuring
Invariances in
Deep Networks
7202.72 90.2564 79.803
Recognizing
lower face action
units for facial
expression analysis
6422.5 73.8933 86.9158
Tracking faces
6112.99 73.4586 83.2168
7.3 Evaluation Results
Results have been summarized evaluating Mean and
Standard Deviation for:
• Precision@R (P@R);
• Discounted Cumulative Gain (DCG);
• Ideal Discounted Cumulative Gain (iDCG);
• Normalized Discounted Cumulative Gain
(nDCG).
Summarized results are presented in Table2
6
.
Table 2: Summarized results for GRASPEvaluation.
P@R DCG@k iDCG@k nDCG
Case 1 0.83±0.14 4.51±1.09 5.37±1.00 0.84±0.11
Case 2 0.92±0.15 7.43±1.43 8.34±0.61 0.88±0.11
Case 3 0.84±0.07 7.02±0.70 7.54±0.57 0.93±0.02
Case 4 0.93±0.05 7.72±0.98 7.91±0.87 0.98±0.02
Case 5 0.95±0.04 6.95±1.05 7.25±0.91 0.96±0.03
Case 6 0.80±0.18 6.27±1.98 7.31±1.26 0.84±0.12
Case 7 0.83±0.07 4.50±1.00 5.34±1.24 0.85±0.07
Case 8 0.89±0.05 6.42±1.10 6.78±0.97 0.95±0.04
P@R: We can observe that the system performs well
with all the evidences. We have a positive peak at
Case 2, Case 4 and Case 5 and the lowest values for
Case 6.
• It tends to be high (greater than 0.90) when the
domain, and sub-graph delivery, is narrower.
• In the case where the search domain is wider and
the sub-graph’s contours are less defined, it tends
to lower around 0.83. For example, the Big Data
and New Data warehouse is wider and it includes
several sub-domains (eg. machine learning, data
models, NoSql database that are not in scope of
the case) that decrease precision.
DCG: emphasizes the position of the single document
in the array of returned documents. As you can see
from the results, we have very good DGC values (> 7)
on 37.5% of results. The negative cases are Case 1,
Case 7 and Case 8. Normalized Discounted Cumula-
tive Gain measures our effectiveness among results of
various scenario. nDCG metric doesn’t penalize bad
documents so our scoring algorithm is able to achieve
high performance with a degree major of 0.9 in 50%
of cases. Generally, GRASPevaluation highlights two
main patterns of our scoring method:
• the algorithm can achieve the best results when we
evaluate the overall list of documents returned by
the system; because GRASPis always able to cor-
rectly detect and sorts relevant document;
• GRASPassigns a wrong rank to documents that are
relevant for a part of the domain (i.e. only for a
single family that has an high value of relevance);
it doesn’t perform well distinguishing between
uniform and skewed performance across the do-
main of interest.
6
The full evaluation is available here http://tiny.cc/93gwtz
DATA 2021 - 10th International Conference on Data Science, Technology and Applications
182

8 CONCLUSION AND FUTURE
WORK
In this paper, we addressed the problem of perform-
ing an efficient literature review considering the nu-
merous quantity of articles, papers and documents to
be retrieved and mined in, to filter them based on the
usefulness and retrieval of the other sources that refer
to or cited by the target document. The proposed so-
lution is able to identify the path of the linked sources
which can contribute to the research topic provided by
the researcher as an input in the form of a simplistic
sub-graph.
As the future works, we are currently working to
improve GRASPby:
• increasing the number of user study participants
to increase the robustness of the evaluations;
• a more in-depth analysis of the competitor solu-
tions;
• enhancing the way the sub-graph query is mapped
on the graph;
• considering more robust information retrieval
methods utilizing zone indexes and n-gram tok-
enizing;
• generating time-anchored graphs which show the
path through the years.
REFERENCES
Angles, R. and Gutierrez, C. (2008). Survey of graph
database models. CSUR.
Buttcher S., Clarke C. L. A., C. G. V. (2016). Information
Retrieval: Implementing and Evaluating Search En-
gines. MIT Press, Ltd.
Cesarini, M., Mercorio, F., Mezzanzanica, M., Moscato,
V., and Picariello, A. (2018). GraphDBLP Re-
leased: Querying the Computer Scientists Network as
a Graph. CEUR.
Dupret, G. (2011). Discounted cumulative gain and user
decision models. In Grossi, R., Sebastiani, F., and Sil-
vestri, F., editors, String Processing and Information
Retrieval, pages 2–13, Berlin, Heidelberg. Springer
Berlin Heidelberg.
Effendy, S., Jahja, I., and Yap, R. H. (2014). Relatedness
measures between conferences in computer science: a
preliminary study based on dblp. In WWW.
Francis, N., Green, A., Guagliardo, P., Libkin, L., Lin-
daaker, T., Marsault, V., Plantikow, S., Rydberg, M.,
Selmer, P., and Taylor, A. (2018). Cypher: An evolv-
ing query language for property graphs. In SIGMOD.
Hoang, D. T., Kaur, J., and Menczer, F. (2010). Crowd-
sourcing scholarly data. Proc. Web Science Con-
ference: Extending the Frontiers of Society On-Line
(WebSci).
Jarke, M., Neumann, B., Vassiliou, Y., and Wahlster, W.
(1989). Kbms requirements of knowledge-based sys-
tems. In Foundations of knowledge base management,
pages 381–394. Springer.
Khan, S., Liu, X., Shakil, K. A., and Alam, M. (2017). A
survey on scholarly data: From big data perspective.
IP&M.
Mercorio, F., Mezzanzanica, M., Moscato, V., and Sperl
`
ı,
G. (2019). A Tool for Researchers : Querying Big
Scholarly Data through Graph Databases. ECML
PKDD.
Ororbia, A. G., Wu, J., Khabsa, M., Williams, K., and Giles,
C. L. (2015). Big scholarly data in citeseerx: Informa-
tion extraction from the web. In WWW.
Robinson, I., Webber, J., and Eifrem, E. (2015). Graph
databases: new opportunities for connected data. ”
O’Reilly Media, Inc.”.
Sch
¨
afer, U. and Kiefer, B. (2011). Advances in deep parsing
of scholarly paper content. Lecture Notes in Computer
Science (including subseries Lecture Notes in Artifi-
cial Intelligence and Lecture Notes in Bioinformatics),
6699 LNCS:135–153.
Sch
¨
afer, U., Uszkoreit, H., Federmann, C., Marek, T., and
Zhang, Y. (2008). Extracting and querying relations
in scientific papers on language technology. LREC.
Sinha, A., Shen, Z., Song, Y., Ma, H., Eide, D., Hsu, B.-
J. P., and Wang, K. (2015). An overview of microsoft
academic service (mas) and applications. In WWW.
Tang, J., Zhang, J., Yao, L., Li, J., Zhang, L., and Su, Z.
(2008). Arnetminer: Extraction and mining of aca-
demic social networks. In SIGKDD.
Tran, D. H., Takeda, H., Kurakawa, K., and Tran, M. T.
(2012). Combining topic model and co-author net-
work for KAKEN and DBLP linking. Lecture Notes in
Computer Science (including subseries Lecture Notes
in Artificial Intelligence and Lecture Notes in Bioin-
formatics), 7198 LNAI.
Williams, K., Wu, J., Choudhury, S. R., Khabsa, M., and
Giles, C. L. (2014). Scholarly big data information
extraction and integration in the CiteSeerχ digital li-
brary. Proceedings - International Conference on
Data Engineering.
Xia, F., Wang, W., Bekele, T. M., and Liu, H. (2017). Big
scholarly data: A survey. IEEE Transactions on Big
Data.
Za, S. and Spagnoletti, P. (2013). Knowledge creation
processes in information systems and management:
Lessons from simulation studies. In Organizational
Change and Information Systems, pages 191–204.
Springer.
Zhao, D. and Strotmann, A. (2015). Analysis and visualiza-
tion of citation networks. Synthesis lectures on infor-
mation concepts, retrieval, and services, 7(1):1–207.
GRASP: Graph-based Mining of Scientific Papers
183
