
Three-year Trends in YouTube Video Content and Encoding
Feng Li
1
, Jae Won Chung
2
and Mark Claypool
3
1
Verizon Labs, 60 Sylvan Rd., Waltham, MA, U.S.A.
2
Viasat Inc., 300 Nickerson Rd., Marlborough, MA, U.S.A.
3
Worcester Polytechnic Institute, 100 Institute Rd., Worcester, MA, U.S.A.
Keywords:
YouTube, Internet Video, Internet Video Analysis, Video Crawler.
Abstract:
Despite the dominance of YouTube streaming traffic, there have been few studies focusing on characterizing
YouTube videos over time. Given the sheer volume of YouTube videos, we created a custom crawler which
took snapshots of popular YouTube channels and ran the crawler daily for the past 3 years. This provides
YouTube video trends from 2018–2020 for over 160k videos, considering media type, duration, bit rate, res-
olution, codec, encoding format, and popularity. Analysis of the data shows YouTube videos have increased
frame rates, resolutions and durations over this time, with the biggest clips consuming over 200 Mb/s and be-
ing over 3 hours long, accompanied by corresponding changes in encoding rates and codecs. Our analysis and
the resulting dataset we make public should be beneficial for traffic shaping or CDN deployment strategies.
1 INTRODUCTION
Video use on the Internet has grown tremendously
over the past decade, with video (business and con-
sumer) projected to consumed 79% of all Internet
traffic in 2020 (Cisco Inc, 2016), up from 63%
in 2015. Among the myriad video applications,
YouTube is perhaps the most successful with 2 billion
monthly users and 500 hours of video uploaded ev-
ery minute (MerchDope, 2020). On mobile networks,
YouTube makes up more than 22% of the traffic (Li
et al., 2018b). Understanding the video characteristics
of YouTube can help network traffic management, en-
gineering and optimization.
The increased deployment of end-to-end encryp-
tion, such as HTTP3/QUIC (Langley et al., 2017), has
made it harder for Internet Service Providers (ISPs) to
detect and manage traffic over their networks (Kakhki
et al., 2016). While various detection mechanisms
for encrypted traffic have been proposed (Dimopou-
los et al., 2016; Li et al., 2018a; Tsilimantos et al.,
2018), most require video flow data, such as duration
and data rate, for training. If designers of such al-
gorithms had longitudinal data – video characteristics
over time – they could develop algorithms that are re-
silient to the evolution video characteristics.
With this in mind, we established a “video
crawler” project that monitors video characteris-
tics mined from popular YouTube channel lists and
launched it several years ago. We expect to observe
and record the evolution of YouTube video technolo-
gies, provide “ground truth” data to improve video
detection algorithms, and capture some social char-
acteristics of popular videos based on their views.
To provide a better understanding of Internet
video over time, this paper presents an in-depth mea-
surement study on video statistics from the world’s
leading provider – YouTube – for three years (2018-
2020), with statistics for over 160,000 distinct videos,
accounting for 3.2 million media clips. Analysis
shows YouTube videos have changed significantly
from earlier studies (Cheng et al., 2008; Li et al.,
2005) in their durations, bitrates, and codecs used, af-
firming the need for more recent data. Analysis of
social use shows viral view patterns where a small set
of videos are viewed a lot more than others, indicating
opportunities for new caching strategies to enhance
YouTube service quality over edge networks.
The rest of the paper is organized as follows: Sec-
tion 2 presents related research; Section 3 depicts
our measurement architecture; Section 4 analyzes the
statistics collected; and Section 5 summarizes our
conclusion and presents possible future work.
2 RELATED WORK
While YouTube dominates Internet traffic in terms of
volume, most YouTube measurement work has fo-
cused on social aspects (Bärtl, 2018; Brodersen et al.,
Li, F., Chung, J. and Claypool, M.
Three-year Trends in YouTube Video Content and Encoding.
DOI: 10.5220/0010515800150022
In Proceedings of the 18th International Conference on Signal Processing and Multimedia Applications (SIGMAP 2021), pages 15-22
ISBN: 978-989-758-525-8
Copyright
c
2021 by SCITEPRESS – Science and Technology Publications, Lda. All rights reserved
15
2012; Wattenhofer et al., 2012), such as popularity
and number of views.
Cheng et al. (Cheng et al., 2008) crawled 3 mil-
lions distinct videos, but since their 2007 work, video
codecs have evolved from H.263 to H.264, YouTube
started using HTML5 and Dynamic Adaptive Stream-
ing over HTTP (DASH), and Internet network capac-
ities have greatly increased.
Krishnappa et al. (Krishnappa et al., 2013) an-
alyze the trade-offs of using DASH by examining
streaming traces from YouTube. Although they notice
that YouTube needs to generate multiple clips with
different encoding rates to support DASH, they only
collect data on a small portion of YouTube videos.
Our work provides recent video statistics – e.g.,
median video durations and encoding rates – while
also providing a logitudinal view of video content and
encoding, showing evolution of the same over the past
3 years.
3 METHODOLOGY
Given the sheer volume of YouTube traffic (500 hours
of video uploaded every minute (MerchDope, 2020)),
it is not feasible to monitor the statistics of all videos
from the edge. Instead, we built a YouTube crawler
that samples Internet videos by selecting and crawling
through several video channels each day.
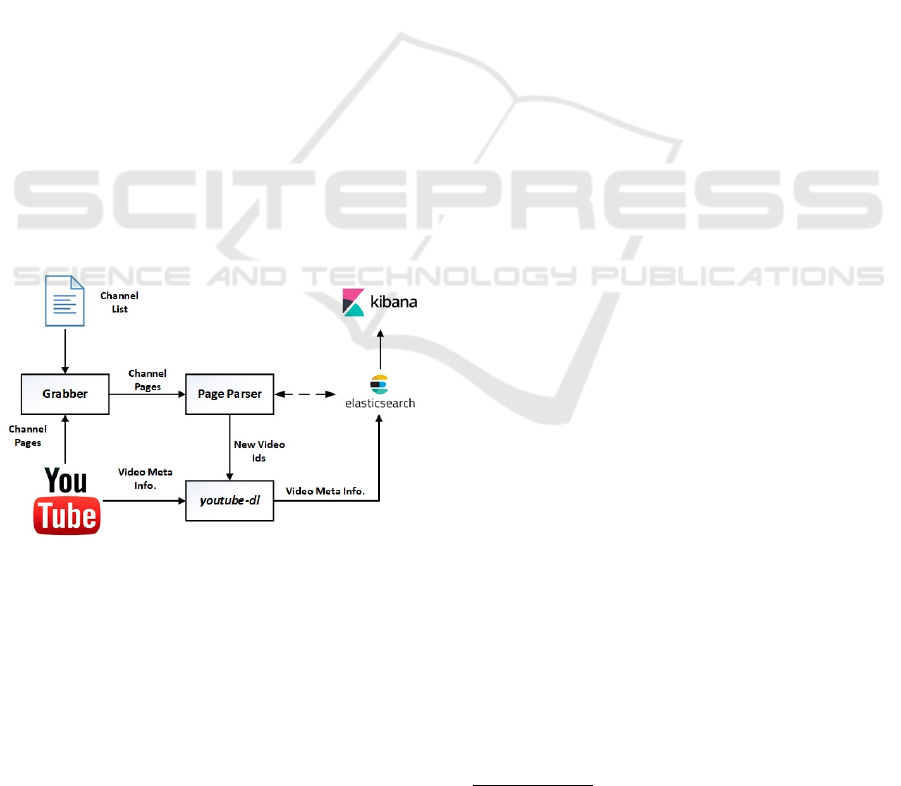
Figure 1: YouTube Crawler General Architecture.
Our crawler architecture is depicted in Figure 1.
The Grabber imports the Channel List and uses that to
select the YouTube Pages. The Channel Pages are fed
into the Page Parser which gathers the video id, which
is used by youtube-dl to download meta-data on
each video. This, in turn, is used by elasticsearch
and kibana to gather and analyze the video statistics.
For the channel list, as of 2020 there are around 37
million YouTube channels worldwide, making it im-
practical to monitor all of them. However, most popu-
lar videos (see Table 1) are listed on the YouTube web
page.
1
We use these videos as a sample of YouTube
videos at that point in time.
Before taking each daily sample, we clear all
cookies and do not login to a Google account to avoid
YouTube’s “recommended” videos so as to keep the
crawler content neutral.
Since YouTube deploys rate limiters to dissuade
robotic crawling (see Section 3.1), we only gather
new meta-data each day, about 100–300 new videos
daily.
A key element of our video crawler uses
youtube-dl
2
with the “-j” option to retrieve video
formats in json, without actually streaming the video
clips.
3.1 Thwarting Anti-crawling
When developing in late 2017, we noticed YouTube
imposed rate limiting to deter crawling. Upon detect-
ing frequent requests from one host (e.g., more than
one day of crawling), YouTube would blacklist the
host’s IP address. To avoid this, we tried adding a ran-
dom delay after every request, but our host was still
blacklisted within a few days. Thus, we reboot our
host daily to get a new dynamic IP address and avoid
a blacklist.
3.2 Re-crawling Popular Videos
Since our primary research goal is to ascertain encod-
ing and content information, we only collect data once
upon discovery. However, as of January 6th, 2020, we
also gather trends in popularity by selecting the top
100 videos based on view count and retrieving their
statistics daily. As a validation of our crawling ap-
proach, we find our top 10 list exactly matches the
top 10 list on Wikipedia (Wikipedia, 2004).
We have observed that the time span between
video upload time and first discovery time is relatively
short (7 days, on average). So, since August 1st, 2020,
we also re-crawl the top 100 videos discovered both 1
month and 1 year earlier to provide a more complete
picture on social characteristics of the videos.
Finally, with respect to YouTube user privacy, our
crawler does not collect videos marked “private” or
“paid”, or those removed by uploaders or moderators
(e.g., for copyright violation). Moreover, our crawler
does not retrieve any personal user information – all
information collected is solely based on each video’s
public metadata.
1
https://www.youtube.com/
2
https://youtube-dl.org/
SIGMAP 2021 - 18th International Conference on Signal Processing and Multimedia Applications
16
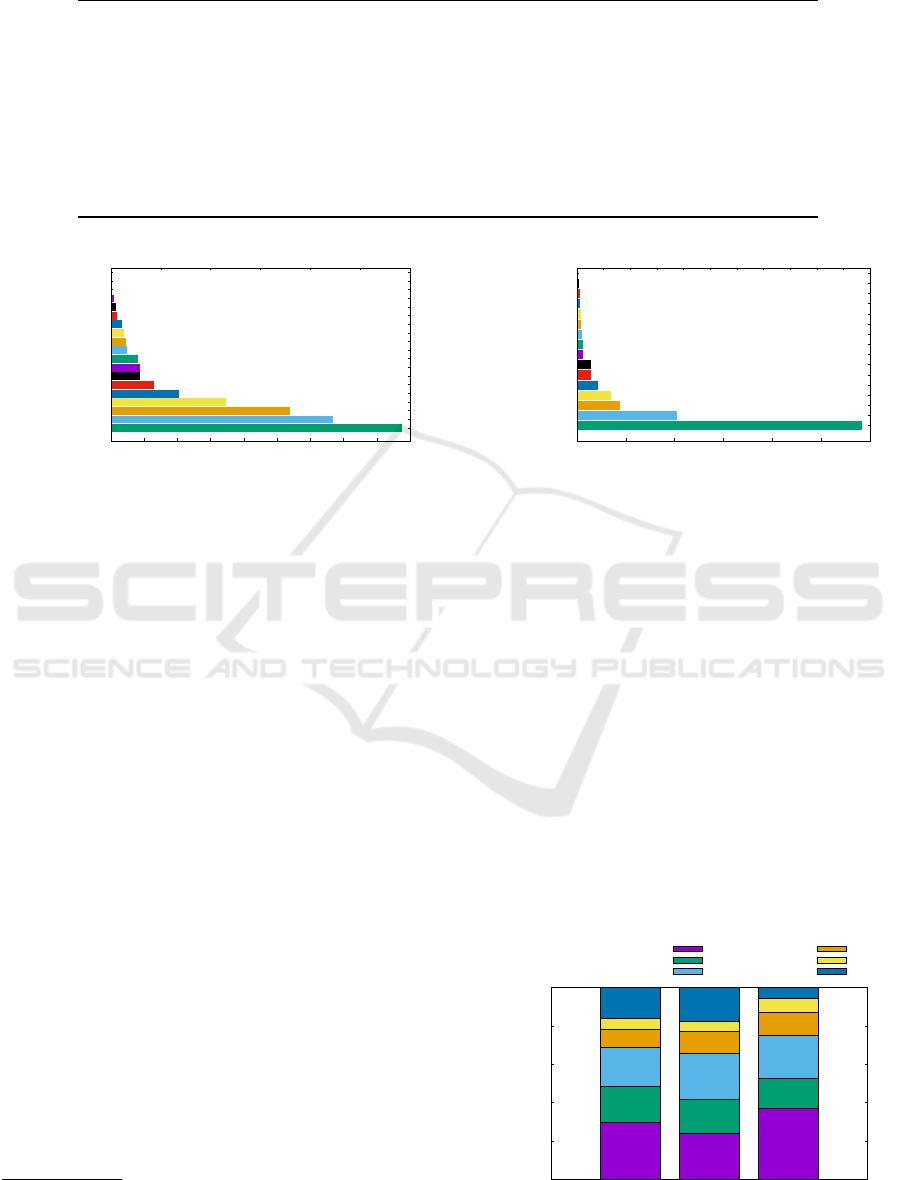
Table 1: Monitored YouTube Channels.
Main Page https://www.youtube.com
Music https://www.youtube.com/channel/UC-9-kyTW8ZkZNDHQJ6FgpwQ
Sports https://www.youtube.com/channel/UCEgdi0XIXXZ-qJOFPf4JSKw
Game https://www.youtube.com/channel/UCOpNcN46UbXVtpKMrmU4Abg
News https://www.youtube.com/channel/UCYfdidRxbB8Qhf0Nx7ioOYw
Spotlight https://www.youtube.com/channel/UCBR8-60-B28hp2BmDPdntcQ
VR 360 https://www.youtube.com/channel/UCzuqhhs6NWbgTzMuM09WKDQ
Trends https://www.youtube.com/feed/trending
Movie Trailers https://www.youtube.com/user/movieclipsTRAILERS/videos
News & Politics
Sports
Gaming
Entertainment
Music
People Blogs
Film & Animation
Howto & Style
Comedy
Science Technology
Autos Vehicles
Education
Unspecified
Travel & Events
Pets & Animals
Nonprofits & Activism
Shows
News
Trailers
0 5000 10000 15000 20000 25000 30000 35000 40000 45000
0 5 10 15 20 25 30
Number of Videos
% of Total
(a) Pre-recorded Videos
Gaming
Sports
News & Politics
Entertainment
People & Blogs
Film & Animation
Music
Autos & Vehicles
Education
Unspecified
Travel & Events
Nonprofits & Activism
Science & Technology
Comedy
Pets & Animals
Howto & Style
0 500 1000 1500 2000 2500 3000
0 5 10 15 20 25 30 35 40 45 50 55
Number of Videos
% of Total
(b) Live Videos
Figure 2: Distribution of Video Categories.
4 RESULTS
Starting from an Amazon Web Service (AWS) Elas-
tic Cloud (EC2) instance from US-East on Decem-
ber 11, 2017, we obtained a daily snapshot using
our YouTube crawler, except for a handful of times
our dynamic IP address was blacklisted and a few
YouTube outrages (e.g., October 17, 2018). The in-
formation the crawler gathered is a snapshot of the
web page of channels listed in Table 1 and the con-
tent and encoding data on videos listed in these chan-
nels. By October 31st 2020, this comprises 160,156
unique videos, including 5472 live videos.
3
While our
dataset is not large compared to the entire YouTube
repository, since it is obtained from the most popular
videos from YouTube home page channels, it likely
represents accessed videos.
Some of the video statistics gathered are static,
fixed when the video is uploaded (e.g., display id, date
uploaded, and duration), while other statistics are dy-
namic and may change each time crawled (e.g., num-
ber of views, supported format). In this paper, we
consider the dynamic information to be static since
the last crawl, except for the number of views over
time.
3
Publicly available at http://perform.wpi.edu/
downloads/#youtube-crawler.
4.1 Video Category
When uploading videos, the user can choose one of
15 pre-set categories to describe the content of their
videos, or enter a custom content type. Figure 2(a)
shows the distribution of all categories discovered by
our crawler on the y-axis, with the x-axis showing the
number of videos (bottom) and percentage of the to-
tal (top). Comparing our results with the 12 categories
used in 2007 (Cheng et al., 2008), YouTube has added
three new categories: “Education”, “Science & Tech-
nologies”, and “Nonprofit & Activism”. YouTube
also renamed “Gadgets & Games” to be “Gaming”,
perhaps because games have become more popular
over the past five years. Videos that do not have a
category provided are listed as “Unspecified”. Three
0
20
40
60
80
100
2018 2019 2020 (Jan - Oct)
% of Total
News & Politics
Gaming
Sports
Entertainment
Music
Misc.
Figure 3: Normalized Histogram of Video Categories.
Three-year Trends in YouTube Video Content and Encoding
17
0
0.25
0.5
0.75
1
10 60 600 1800 3600
Culmulative Distribution
Duration (sec)
2018
2019
2020
(a) Video Duration by Year
0
0.25
0.5
0.75
1
10 sec 1 min 5 mins 20 mins 1 hr 12 hrs
Culmulative Distribution
Duration
News Politics
Sports
Gaming
Entrainment
Music
(b) Video Duration by Category
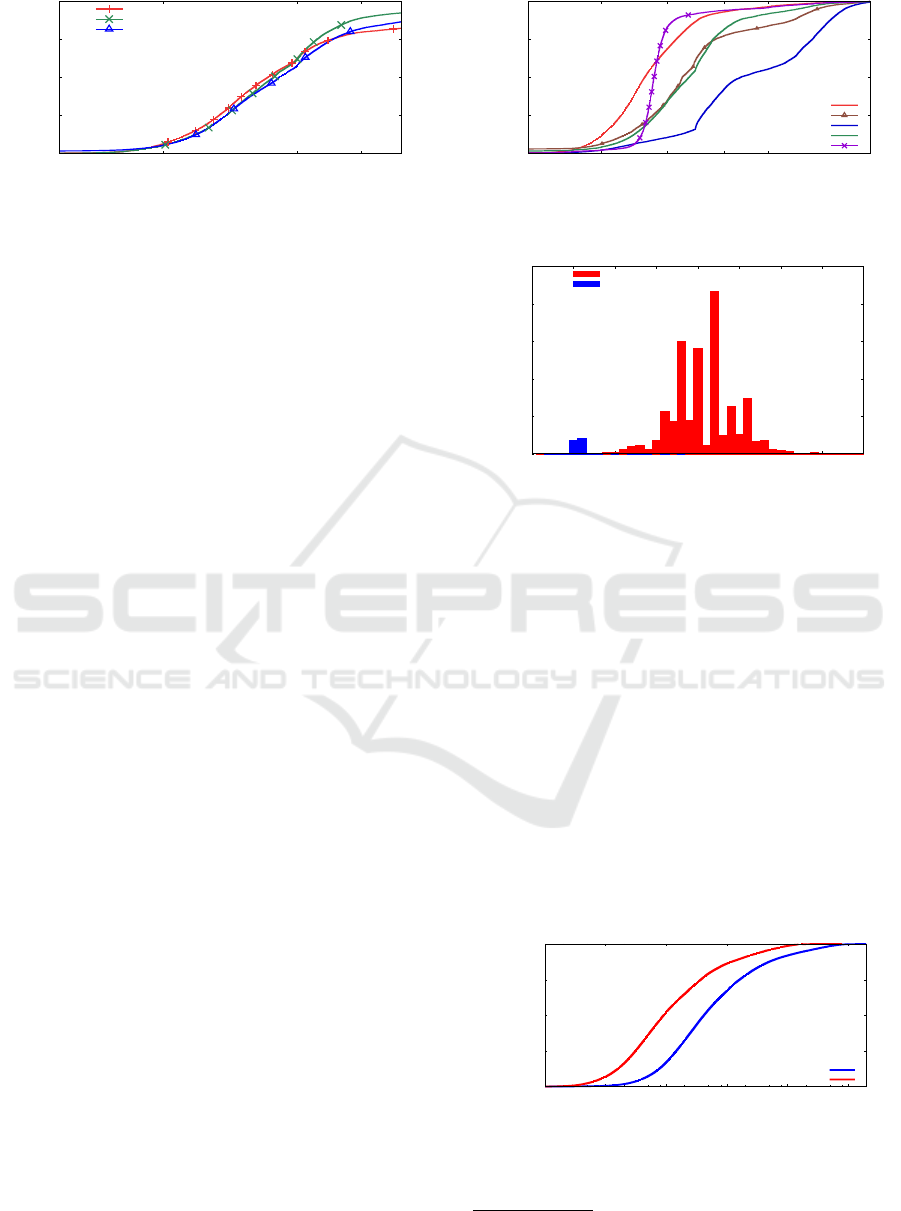
Figure 4: Video Durations.
categories, “Trailer”, “Show” and “News”, are not
shown in the current set of upload pages and have less
than 100 videos each.
From the figure, the distribution of video cate-
gories is highly skewed: the most populous category,
“News & Politics”, has about 27% of all videos, the
second largest category, “Sports”, has about 21%, and
the third, “Gaming”, about 17%.
The “Gaming” category (“Gadgets & Games” in
2007) has moved from the 7th largest category (7.4%)
in 2007 (Cheng et al., 2008) to the 3rd largest cate-
gory (17%) in our data set. Moreover, about 54% of
the live streaming sessions are gamers broadcasting
through YouTube Live – a higher fraction even than
YouTube live sports broadcasting.
Figure 3 shows a histogram of the normalized,
non-live video categories by upload year. The COVID
pandemic and U.S. presidential election likely ele-
vated the popularity of “News & Politics” videos to-
wards the end of 2020.
4.2 Video Length
Figure 4 shows distributions of the video durations,
broken down by year. Compared to 2005 (Li et al.,
2005) and 2008 (Cheng et al., 2008), videos have
gotten longer. In 2008, 97.9% of YouTube videos
were under 600 seconds, and 99.1% were under 700
seconds, while in 2020, 25% of videos were longer
than 931 seconds and 5% of videos were longer than
11,600 seconds (3 hours, 12 minutes). The median
duration of uploaded videos in 2018 is 296 seconds,
and increased to 440 seconds in 2020. While there is a
default limit of 900 seconds for regular user uploads,
YouTube allows authorized users to upload videos up
to 12 hours in length.
Figure 4(b) compares the video lengths for the
most popular categories. 90% of “News & Poli-
tics” and “Music” videos are less than 900 seconds
long, compared to only 74% for “Entertainment” and
“Sports”. “Gaming” videos are the longest, with
nearly 60% over 900 seconds.
0
5
10
15
20
25
0 5 10 15 20 25 30 35 40
% of Total Videos
# of stream clips per video
all
live
Figure 5: Distribution of Number of Clips per Video.
4.3 Multiple Clips per Video
YouTube video streaming supports two different ap-
proaches (Krishnappa et al., 2013; Dimopoulos et al.,
2016): progressive downloading for low quality
videos (144p, 240p, 360p, and 480p) and HTTP adap-
tive streaming (HAS) for high definition (HD) videos
(720p and 1080p). Both methods require YouTube
to post-process the uploaded video to generate mul-
tiple clips.
4
As Figure 5 shows, YouTube generates
20 or more clips on average, each of different qual-
ity (resolution and encoding rate) for the same video
content. Having clips with different qualities allow
video players to adapt the streaming data rate to the
available bandwidth. YouTube Live even generates
5-6 streams (144p to 1080p) using the HTTP Live
Streaming (HLS) protocol.
0
0.25
0.5
0.75
1
1 10 100 1000 10000 100000
Culmulative Distribution
File Size (MB) per Video
all togther
best quality
Figure 6: Total Stream File Size per Video.
Figure 6 shows the cumulative distribution of the
total file sizes of non-live streaming videos. The dis-
4
We call one encoding of a video a “clip”.
SIGMAP 2021 - 18th International Conference on Signal Processing and Multimedia Applications
18

0
0.25
0.5
0.75
1
0.1 1 10 100 1000 10000 100000
Culmulative Distribution
Date Rate (kbps)
DASH Audio
Small 144p
Small 240p
Medium 360p
Medium 480p
High 720p
High 1080p
HD 1440p
HD 2160p
(a) 2D Videos
0
0.25
0.5
0.75
1
0.1 1 10 100 1000 10000 100000
Culmulative Distribution
Date Rate (kbps)
Small 144s
Small 240s
Medium 360s
Medium 480s
High 720s
High 1080s
High 1440s
HD 2160s
HD 4320s
(b) VR (3D) Videos
Figure 7: Video Data Rate.
tribution of sizes is heavy tailed, similar to that of
video length. In our crawled data, the median total
file size is 420 Mbytes, the average is 3.6 Gbytes and
5% of videos are more than 19 Gbytes. With an aver-
age duration of 2047 seconds, YouTube needs at least
12 Mbytes of storage for every minute of video. So,
for the 500 hours of videos uploaded every minute,
YouTube needs a minimum 350 Gbytes/minute for
storage on each edge server on which they are placed.
Figure 6 depicts the size of the clip with the best
quality for each video in our dataset. This distribu-
tion is similar to the total file size and distributions.
The median of the size of the best quality clip is 90
Mbytes, and the average is 759 Mbytes. Although
Google imposes a maximum limit of 120 Gbytes, the
largest is only 81 Gbytes, and only 1.4% of videos
have a clip larger than 10 Gbytes.
4.4 Resolution
In addition to live streaming, YouTube videos can be
classified into regular (2D) videos and virtual real-
ity (VR, 3D or 360°) videos. At present, the maxi-
mum resolution supported on YouTube is 4320p for
2D videos and 4320s for 3D videos. The ‘p’ desig-
nation stands for ‘progressive scan’, and the ‘s’ for
‘spherical’. The number preceding it is the number
of vertical pixels. Intuitively, 3D videos have higher
data rates than 2D videos with the same resolution.
The highest data rate observed is 226 Mb/s for an
8K 360°(4320s)
5
clip of the video “Expedition Ever-
est: The Science - 360 | National Geographic”.
6
Note,
this data rate is a challenge for residential broadband
networks and 4G/LTE networks in the U.S.
Figure 7(a) compares data rates for different res-
olutions for regular (2D) video clips. Not surpris-
ingly, video clips with higher resolution usually have
higher data rates. However, the distribution of data
rates for DASH audio overlaps with the 144p videos.
5
4320p and 4320s videos are considered as 8K resolu-
tions.
6
https://www.youtube.com/watch?v=twVdBzQM-gc
Thus, rate-based video detection algorithms (Li et al.,
2018a) may fail to differentiate audio from low bitrate
video streams based only on measured data rates.
Figure 7(b) compares data rates for different res-
olution 3D (360°) clips. Similar to 2D video clips,
3D videos with larger resolutions have higher data
rates than videos with lower resolutions. Table 2 pro-
vides statistics for data rates for different resolution
clips. This information could be used for passive
video detection algorithms (Dimopoulos et al., 2016;
Li et al., 2018a; Orsolic et al., 2017) to better differ-
entiate video flows.
4.5 Frame Rate
Video frame rates also impact video data rates. Fig-
ure 8 shows a distribution of the best quality clips for
each video in our dataset. YouTube supports multi-
ple format videos with different resolutions and frame
rates. However, as observed, the maximum frame rate
for most videos is in one of two categories: 30 f/s
(standard) and 60 f/s (high motion). High frame rates
(60 f/s) are usually used for videos that might benefit
from the extra frames, (e.g., game streams), whereas
low frame rates (30 f/s or lower) are usually for more
stationary scenes (e.g., talking news broadcasts).
0
0.25
0.5
0.75
1
0 10 20 30 40 50 60
Culmulative Distribution
Frame Rate (fps)
News & Politics
Sports
Gaming
Entrainment
Music
all
Figure 8: Max Frame Rate.
From Figure 8, about a quarter of videos have a
maximum frame rate of less than 25 f/s. On the other
end, only 24% of videos support up to 60 f/s. Most
60 f/s videos are from “Gaming” and “Sports”, and
nearly 74% of “Gaming” videos support 60 f/s format
compared to 38% for “Sports”.
Three-year Trends in YouTube Video Content and Encoding
19
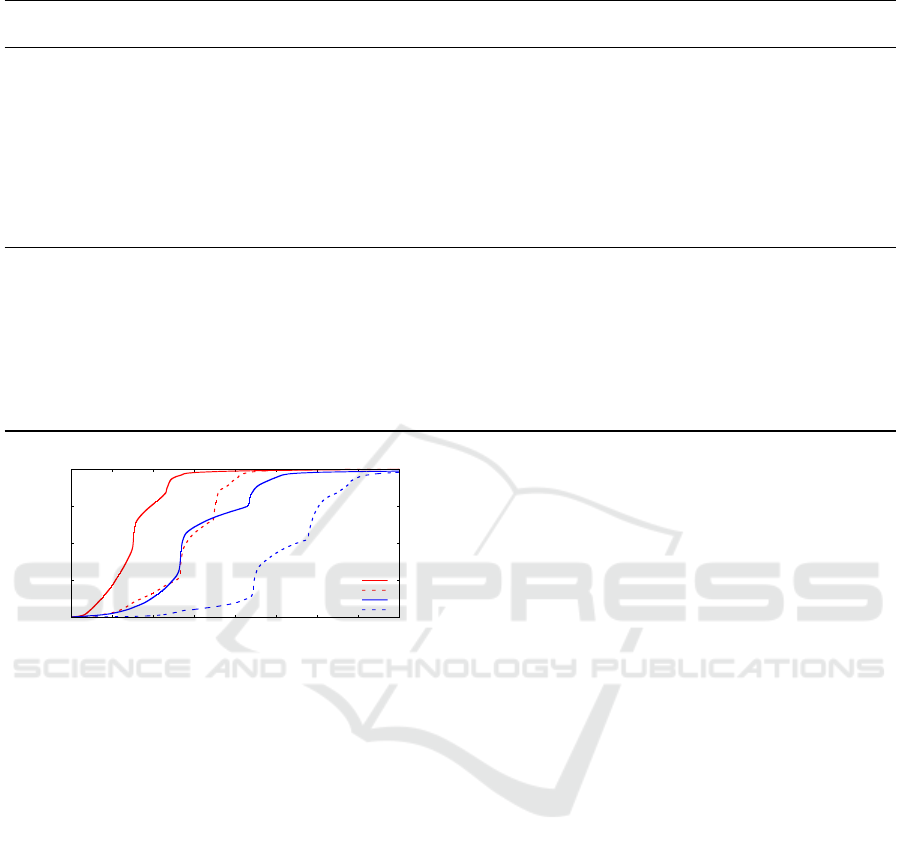
Table 2: Popular YouTube Video Stream Encoding Rates.
median mean ± stdev min max CI (95%) of mean (kb/s)
Quality # (kbps) (kbps) (kbps) (kbps) left right
Dash Audio 435522 108.82 102.50 ± 38.84 3.84 5005.42 102.40 102.60
Small 144p 322424 108.25 108.77 ± 31.46 5.55 993.32 108.68 108.86
Small 240p 318460 225.10 225.89 ± 65.84 6.51 1431.89 225.70 226.08
Medium 360p 379571 423.92 467.50 ± 152.57 8.43 4974.63 467.09 467.90
Medium 480p 314544 761.89 805.75 ± 289.38 9.33 10255.67 804.91 806.60
High 720p 350445 1507.20 1554.80 ± 828.74 4.01 26112.00 1551.83 1556.44
High 1080p 212538 2801.81 3180.81 ± 1512.22 20.36 56738.24 3175.41 3186.20
HD 1440p 8555 8790.81 8490.40 ± 2581.42 64.20 29496.66 8444.49 8536.32
HD 2160p 7254 17695.02 17261.33 ± 4023.76 1045.18 72333.43 17183.60 17339.05
HD 4320p 58 21727.62 24066.20 ± 12927.65 10252.97 74515.99 21273.48 26858.92
VR Small 144s 5538 110.75 108.77 ± 20.17 12.35 565.06 108.32 109.21
VR Small 240s 5536 243.62 233.82 ± 51.74 15.23 974.30 232.68 234.97
VR Medium 360s 5875 459.32 492.51 ± 137.89 28.28 1889.39 489.55 495.47
VR Medium 480s 5535 844.72 911.30 ± 246.81 52.92 2901.47 905.84 916.76
VR High 720s 6833 1857.584 1956.88 ± 637.87 103.23 9155.10 1944.19 1969.58
VR High 1080s 6535 3501.62 3625.00 ± 1117.28 206.09 15433.90 3602.26 3647.74
VR High 1440s 6479 9094.60 9361.51 ± 2456.44 522.83 29529.80 9311.30 9411.72
VR HD 2160s 6386 17577.32 17941.50 ± 5080.15 1291.31 62149.85 17836.91 18046.09
VR HD 4320s 808 27443.38 36293.75 ± 24554.87 4762.67 226340.49 34872.55 37714.95
0
0.25
0.5
0.75
1
0 1000 2000 3000 4000 5000 6000 7000 8000
Culmulative Distribution
Date Rate (kbps)
720p , 30fps
720p , 60fps
1080p , 30fps
1080p , 60fps
Figure 9: Encoding Rates for Video with Different Frame
Rates.
Figure 9 compares the cumulative distributions
of video encoding rates with the same resolutions
but different frame rates. 720p with 60 f/s videos
have similar data rates as 1080p with 30 f/s videos,
although distributions are distinguishable by frame
rate. This indicates that Machine Learning based ap-
proaches (Dimopoulos et al., 2016; Li et al., 2018a;
Orsolic et al., 2017) may be inaccurate if they rely on
only measured data rates to infer video quality.
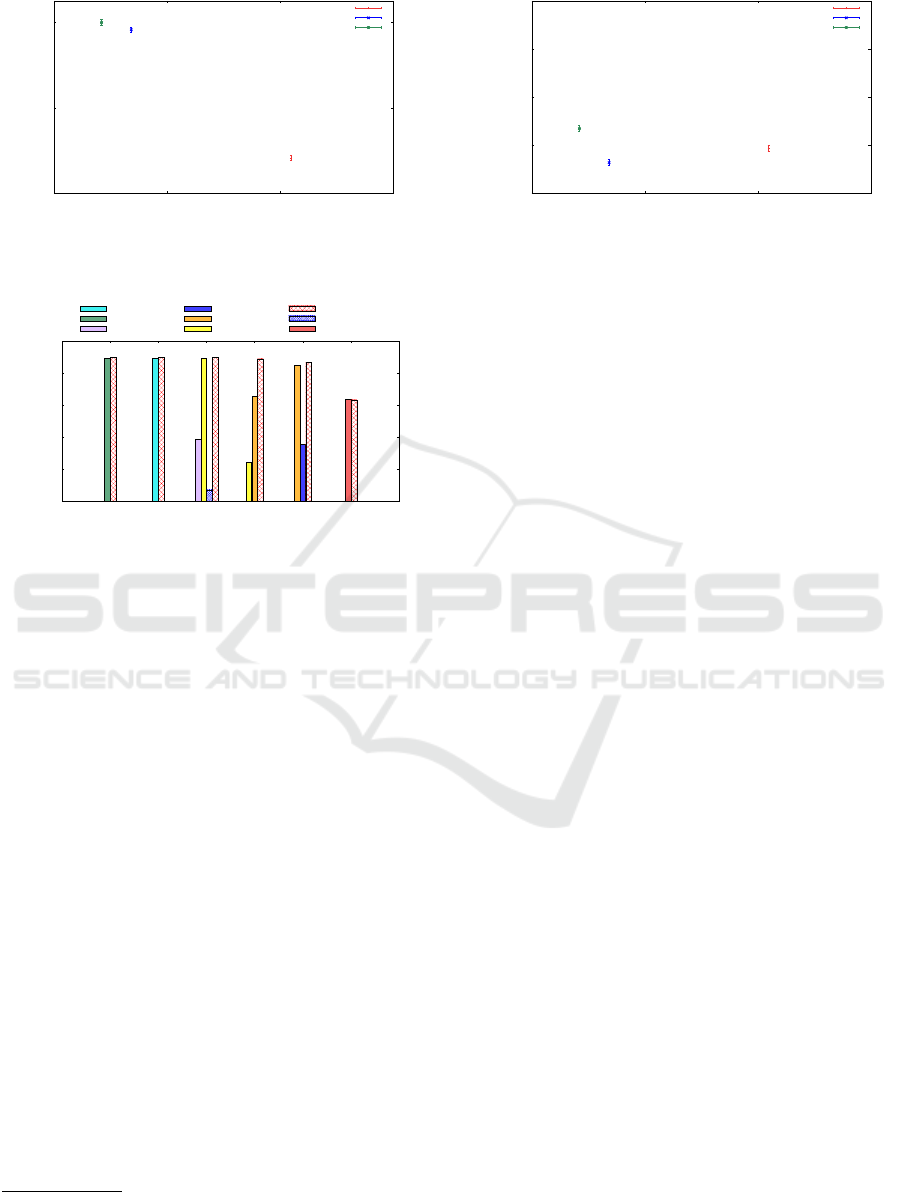
Figure 10 compares the trend in the average en-
coding bitrates and average frame rates for the past
three years. Both x-axes show the average number of
distinct clips per video. The left graph compares the
trend in average encoding rate, and the right the trend
in average frame rate. The error bars in both graphs
are 95% confidence intervals round the means. Over
the past 3 years, the average number of clips per video
has dropped from 22.2 clips per video to 18.7 clips
per video. However, the average encoding rate has in-
creased from 841 kb/s in 2018 to 991 kb/s in 2020,
while the average frame rate has remained relatively
constant, 30.2 f/s in 2018 and 30.3 f/s in 2020.
4.6 Video Codecs
To support different client capabilities, YouTube gen-
erates video clips with the same resolution but using
different codecs. Figure 11 shows the distribution of
video codecs. YouTube primarily supports two codec
types: MPEG-4/H.264 (avc1) and WebM (vp9 and
vp8). 90% of videos have two 144p video clips –
one is using the H.264 codec (avc1.4d400c), and the
other the WebM codec (vp9). Similarly, other popu-
lar quality clips, 240p, 360p, 480p, 720p, and 1080p,
also have one clip encoded with H.264 and another
with WebM. For WebM, vp9 is the dominate codec,
widely used by videos of all quality.
Note, the H.264 codecs used by YouTube
can be grouped into three categories: i) base-
line: avc1.42E0xx used by 360p videos, ii) main:
avc1.4DE0xx used by 144p, 240p, 360p, 480p and
720p videos, and iii) high: avc1.6400xx used by 720p
and 1080p videos, where xx is the Advance Video
Coding (AVC) level. The main category of H.264 has
been used by clips from 144p to 720p.
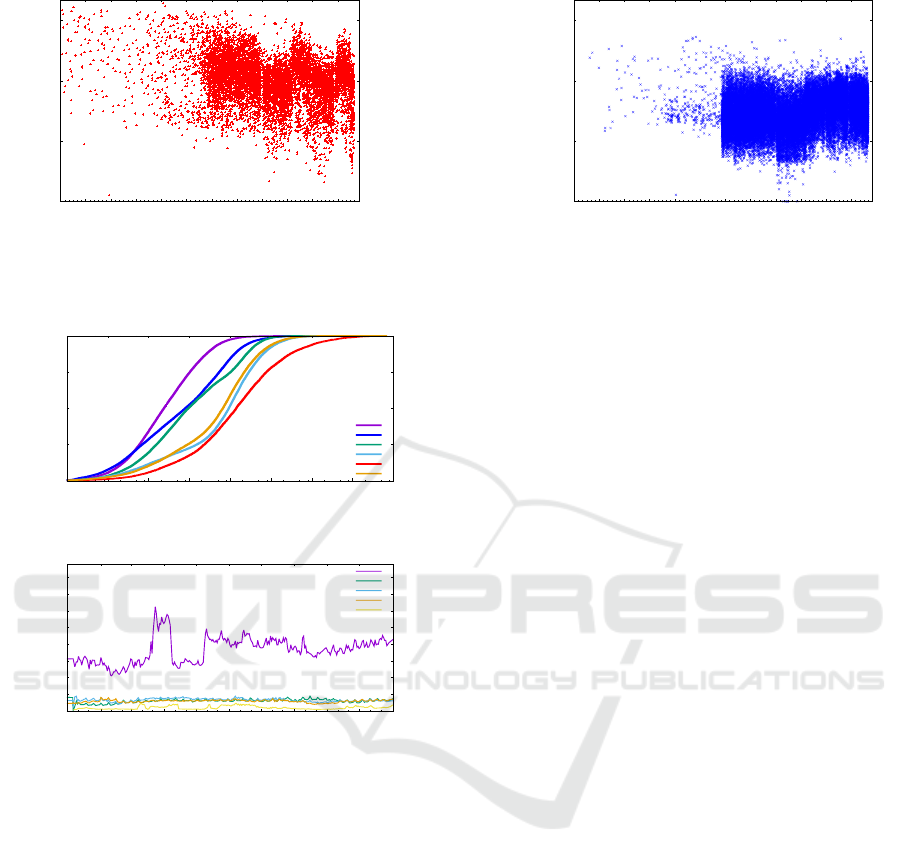
4.7 Social Statistics
In addition to YouTube video statistics, we also mea-
sure social statistics for some videos based on number
of views. Figure 12 shows our crawler detects many
popular music videos (more than 1 billion views)
which were uploaded far earlier than our first crawl.
Given the temporal relevance of “News & Politics”,
only a small portion are detected before our crawler
runs (i.e., recent news has not been viewed).
SIGMAP 2021 - 18th International Conference on Signal Processing and Multimedia Applications
20
800
900
1000
18 20 22 24
Avg Bitrate (kbps)
Avg # of Clips per Video
2018
2019
2020
(a) Encoding Rate
30
30.25
30.5
30.75
31
18 20 22 24
Avg Frame Rate (fps)
Avg # of Clips per Video
2018
2019
2020
(b) Frame Rate
Figure 10: Encoding Rate and Frame Rate.
0
20
40
60
80
100
144p 240p 360p 480p 720p 1080p
% of Distinct Videos
Resolution
avc1.42001E
avc1.4d400c
avc1.4d4015
avc1.4d401e
avc1.4d401f
avc1.64001F
avc1.640028
vp8.0
vp9
Figure 11: Video Codecs Used in 2D Videos.
Figure 13 compares cumulative views for differ-
ent video categories. Although all the distributions
are heavy tailed, only 0.2% of “News & Politics”
videos (75 out of 43,733) have more than 10 mil-
lion views, compared to 23.8% “Music” videos (2264
out of 26,915) that have more than 10 millions views.
Among the 109 videos with more than 1 billion views,
105 are “Music”, 2 are “Education”, 1 is “Autos &
Vehicles” and 1 is “Entertainment”. “Gaming” and
“Sports” videos are similar to “News & Politics” in
that they only have 1.3% and 1.4%, respectively, of
videos with more than 10 million views. However, the
median views for “Gaming” and “Sports” are 95.2K
and 80.1K, respectively – much higher than “News &
Politics” which has a median of only 23.9K.
From January 6, 2020, we crawl the 100 most
viewed videos in our dataset to get the daily view
changes. Figure 14 compares the five most viewed
videos’ daily view count. Our five most viewed
videos follow the same as the top five videos in
Wikipedia
7
at the same time.
In January 2020, “Despacito” was the most
viewed video with more than 6.6 billion views, and
‘Baby Shark Dance” the 4th most with 4.3 billion
views. However, as Figure 14 shows, “Baby Shark
Dance” has around 6 million daily views, much
7
https://en.wikipedia.org/wiki/List_of_most-viewed_
YouTube_videos
higher than the 2 million daily views for other popular
videos. “Baby Shark Dance” surpassed “Despacito”
after reaching 7.0 billion views on Oct 31st, 2020.
The peak in “Baby Shark Dance” between March
15 and April 15 corresponds to the start of the COVID
lockdown in the U.S. Similar trends can be observed
for “Masha and the Bear”, the 5th most popular video
in 2020. Note, “Baby Shark Dance” and “Masha and
the Bear” are classified as “Education” videos.
5 CONCLUSIONS
This paper presents a detailed investigation of the
characteristics of YouTube videos, the most popular
video sharing site to date. As a highlight, based on
analysis of over 160 thousand videos (over 3 million
clips) collected over the past three years, YouTube
videos are longer (median duration of 440 seconds)
than they were a decade ago (Cheng et al., 2008), with
an average of 20 different media clips for each video,
requiring considerable storage space. “News & Poli-
tics” and “Sports” are the most popular pre-recorded
video categories, while “Gaming” is the most popular
live category. Future work includes crawling through-
out 2021, CDN server deployment strategy design,
and developing new traffic classification methods.
REFERENCES
Bärtl, M. (2018). YouTube Channels, Uploads and Views:
A Statistical Analysis of the Past 10 Years. Conver-
gence, 24(1):16–32.
Brodersen, A., Scellato, S., and Wattenhofer, M. (2012).
Youtube around the world: geographic popularity of
videos. In Proceedings of the WWW Conference,
pages 241–250.
Cheng, X., Dale, C., and Liu, J. (2008). Statistics and social
network of youtube videos. In Proceedings of IWQoS,
pages 229–238. IEEE.
Three-year Trends in YouTube Video Content and Encoding
21
1
1K
1M
1B
15/01 15/07 16/01 16/07 17/01 17/07 18/01 18/07 19/01 19/07 20/01 20/07
Culmulative View Count
Upload Date (Year/Month)
Music
(a) Music
1
1K
1M
1B
15/01 15/07 16/01 16/07 17/01 17/07 18/01 18/07 19/01 19/07 20/01 20/07
Culmulative View Count
Upload Date (Year/Month)
News & Politics
(b) News & Politics
Figure 12: # of Views of “Music” and “News & Politics” Video.
Video Data Rate
0
0.25
0.5
0.75
1
0.0001 0.001 0.01 0.1 1 10 100 1000 10000
Culmulative Distribution
Cumulative # of Views (Millions)
News Politics
Sports
Gaming
Entrainment
Music
Misc.
Figure 13: Distribution of Cumulative Number of Views.
0
2.5
5
7.5
10
12.5
15
17.5
20
Jan Feb Mar Apr May Jun Jul Aug Sep Oct Nov
Daily Views (Million)
Date (2020/01/07 - 2020/11/01)
Baby Shark Dance
Despacito
Shape of You
See you again
Masha and The Bear
Figure 14: Daily View Trend of Top 5 Videos (2020).
Cisco Inc (2016). Global - 2020 Forecast Highlights. Tech-
nical report, Cisco Inc.
Dimopoulos, G., Leontiadis, I., Barlet-Ros, P., and Papa-
giannaki, K. (2016). Measuring Video QoE from En-
crypted Traffic. In Proceedings of ACM SIGCOMM
IMC, Santa Monica, CA, USA.
Kakhki, A. M., Li, F., Choffnes, D., Mislove, A., and Katz-
Bassett, E. (2016). BingeOn Under the Microscope:
Understanding T-Mobile’s Zero-Rating Implementa-
tion. In Proceedings of Internet-QoE Workshop, Flo-
rianopolis, Brazil.
Krishnappa, D. K., Bhat, D., and Zink, M. (2013). DASH-
ing YouTube: An Analysis of Using DASH in
YouTube Video Service. In Proceedings of IEEE
LCN, pages 407–415, Sydney, Australia.
Langley, A., Riddoch, A., Wilk, A., Vicente, A., Krasic, C.,
Zhang, D., Yang, F., Kouranov, F., Swett, I., Iyengar,
J., et al. (2017). The QUIC Transport Protocol: De-
sign and Internet-Scale Deployment. In Proceedings
of ACM SIGCOMM, pages 183–196.
Li, F., Chung, J. W., and Claypool, M. (2018a). Sil-
houette: Identifying YouTube Video Flows from En-
crypted Traffic. In Proceedings of ACM NOSSDAV,
Amsterdam, The Netherlands.
Li, F., Chung, J. W., Jiang, X., and Claypool, M. (2018b).
Who is the King of the Hill ? Traffic Analysis over
a 4G Network. In Proceedings of IEEE ICC, Kansas
City, MO, USA.
Li, M., Claypool, M., Kinicki, R., and Nichols, J. (2005).
Characteristics of Streaming Media Stored on the
Web. ACM Transaction on Internet Technology,
5(4):601–626.
MerchDope (2020). 37 Mind Blowing YouTube Facts, Fig-
ures and Statistics - 2020. Technical report, Merch-
Dope.
Orsolic, I., Pevec, D., Suznjevic, M., and Skorin-Kapov, L.
(2017). A Machine Learning Approach to Classifying
YouTube QoE Based on Encrypted Network Traffic.
Multimedia Tools and Applications, 76(21).
Tsilimantos, D., Karagkioules, T., and Valentin, S. (2018).
Classifying Flows and Buffer State for YouTube’s
HTTP Adaptive Streaming Service in Mobile Net-
works. In Proceedings of ACM MMSys, Amsterdam,
Netherlands.
Wattenhofer, M., Wattenhofer, R., and Zhu, Z. (2012). The
youtube social network. In Proceedings of the AAAI
Conference on Weblogs and Social Media.
Wikipedia (2004). List of Most-viewed YouTube
Videos. [Online: https://en.wikipedia.org/wiki/
List_of_most-viewed_YouTube_videos, accessed 22-
April-2021].
SIGMAP 2021 - 18th International Conference on Signal Processing and Multimedia Applications
22
