
Modeling MCPTT and User Behavior in ns-3
Wesley Garey
1 a
, Thomas R. Henderson
2 b
, Yishen Sun
1 c
, Richard Rouil
1 d
and Samantha Gamboa
3,4 e
1
Wireless Networks Division, National Institute of Standards and Technology, Gaithersburg, Maryland, U.S.A.
2
Department of Electrical & Computer Engineering, University of Washington, Seattle, Washington, U.S.A.
3
National Institute of Standards and Technology, Gaithersburg, Maryland, U.S.A.
4
Prometheus Computing LLC, Sylva, North Carolina, U.S.A.
Keywords:
D2D, LTE, MCPTT, Modeling, ns-3, ProSe, Public Safety, Simulation.
Abstract:
To support the advancement of public safety communications technology, the Third Generation Partnership
Project (3GPP) has created several standards to define Mission Critical Push-To-Talk (MCPTT) over Long
Term Evolution (LTE) networks. As this is a new service that can be used in dire situations, it is imperative
that the behavior and performance meet the expectations of first responders. This paper introduces an extension
to the network simulator, ns-3, that models MCPTT and user Push-To-Talk (PTT) activity, so that researchers
can gain insights and evaluate the performance of this service. In this paper we will describe MCPTT based
on 3GPP definitions, the implementation of the MCPTT model in ns-3, and some results, including Key
Performance Indicators (KPIs), that can be extracted from this model.
Disclaimer: Certain commercial products are identi-
fied in this paper in order to specify the experimental
procedure adequately. Such identification is not in-
tended to imply recommendation or endorsement by
the National Institute of Standards and Technology
(NIST), nor is it intended to imply that the commer-
cial products identified are necessarily the best avail-
able for the purpose.
1 INTRODUCTION
Land Mobile Radio (LMR) systems for two-way
voice communications have been extensively used by
public safety, first responder systems for decades.
Many LMR systems (analog and digital) are presently
deployed worldwide. However, in an effort to im-
prove first responder communications, public safety
agencies worldwide are adopting broadband cellular
systems, i.e. 4G Long Term Evolution (LTE) and
eventually 5G Systems (5GS). Besides offering new
a
https://orcid.org/0000-0003-1572-8208
b
https://orcid.org/0000-0001-8091-2787
c
https://orcid.org/0000-0002-6334-253X
d
https://orcid.org/0000-0003-0387-0880
e
https://orcid.org/0000-0002-6476-7003
broadband data services and prioritized service to first
responders, a key new service called Mission Critical
Push-To-Talk (MCPTT) is being deployed, with the
long term objective of replacing traditional LMR sys-
tems. MCPTT is based on a series of specifications
by the Third Generation Partnership Project (3GPP)
(3GPP, 2019), (3GPP, 2017a), (3GPP, 2017b).
From the user’s perspective, LMR and MCPTT
should offer a similar service experience, but the un-
derlying technology supporting both (dedicated ana-
log or digital radio channels, versus a shared, general-
purpose, fixed-infrastructure cellular network) is sig-
nificantly different. Successful voice communica-
tion despite possibly challenging network conditions
is paramount for safety and mission effectiveness
among first responders (Sun et al., 2019). Because
of this, it is imperative that thorough studies are con-
ducted to evaluate the operation and performance of
MCPTT. Field trials, lab testing, and interoperability
exercises will be essential to fully vet MCPTT and
instill confidence that it can be used to complement
and possibly even replace LMR systems. High fi-
delity network simulations offer another framework
to evaluate future MCPTT performance in ways that
small-scale lab and field testing cannot easily accom-
plish. In particular, network simulators offer the abil-
ity to scale to large network sizes and public safety
30
Garey, W., Henderson, T., Sun, Y., Rouil, R. and Gamboa, S.
Modeling MCPTT and User Behavior in ns-3.
DOI: 10.5220/0010513200300041
In Proceedings of the 11th Inter national Conference on Simulation and Modeling Methodologies, Technologies and Applications (SIMULTECH 2021), pages 30-41
ISBN: 978-989-758-528-9
Copyright
c
2021 by SCITEPRESS – Science and Technology Publications, Lda. All rights reserved

incident scenarios involving hundreds or even thou-
sands of notional MCPTT users, and they allow for
completely repeatable experiments.
This paper reports on what we believe to be the
first publicly available simulation model for MCPTT,
based on the network simulator, ns-3
1
, whose 4G LTE
models have been extended by several of our previ-
ous efforts (Rouil et al., 2017), (Gamboa et al., 2019),
(Garey et al., 2020) to support models for 3GPP
Proximity Services (ProSe), Device-to-Device (D2D)
communications, and the User Equipment (UE) re-
lay service, UE-to-Network Relay. Our MCPTT
model provides standards-aligned implementations of
the call control and floor control protocols defined by
3GPP, for both on-network and off-network opera-
tions, as well as traces to capture standardized Key
Performance Indicator (KPI) measurements such as
mouth-to-ear latency and network access time.
Section 2 gives some general information about
MCPTT and its core components. Section 3 presents
works related to this paper. Section 4 describes the
ns-3 model, including its features, outputs, verifica-
tion and limitations. Section 5 presents the reader
with a case study to show how one can simulate
MCPTT using our model. Finally, Section 6 provides
concluding remarks.
2 BACKGROUND
A Push-To-Talk (PTT) service is used to provide an
arbitrated method for two or more users to commu-
nicate. In terms of a simple voice communication
service, at least from the user’s perspective, this ser-
vice could provide a means of communication that
is very similar to that of what can be achieved with
walkie-talkies. In the ideal case, when a user wants to
talk, the user will request permission to do so, tradi-
tionally, by pushing the PTT button on their commu-
nication device (3GPP, 2019), and then the service
is expected to handle this request by allocating re-
sources and granting permissions accordingly to en-
able communication between the users. MCPTT is
an advanced PTT service based on LTE that can be
used by first responders during mission critical situa-
tions (3GPP, 2019). Thus, it is expected that MCPTT
services will be available regardless of the user’s con-
nectivity with an LTE network (3GPP, 2019). This is
why MCPTT supports two modes of operation: on-
network and off-network.
On-network mode follows the traditional client-
server architecture, where the PTT service is provided
1
https://www.nsnam.org/
by a centralized MCPTT server via the internet that is
accessible through the LTE core network. The off-
network case follows the peer-to-peer architecture,
with the PTT service being provided by the client de-
vices in a distributed manner. This is made possible
with the use of ProSe, which enables D2D communi-
cation for devices in close proximity. In this case the
MCPTT client is responsible for allocating resources
and performing arbitration. In either mode, it is ex-
pected that this service will be available, allow users
to request permission to talk, and provide a determin-
istic mechanism to arbitrate between those requests
(3GPP, 2019).
Figure 1: Main MCPTT components.
There are two main components that comprise
MCPTT, call control and floor control. These com-
ponents are defined respectively in 3GPP (2017a) and
3GPP (2017b). Several of the primary elements as-
sociated with each are also shown in Figure 1. Call
control is responsible for managing call state coordi-
nation, including aspects such as resource allocation,
management of logical channels, user information,
group affiliation, and call type. Call control supports
various types of calls, including basic group calls, pri-
vate calls, and broadcast group calls. Group calls
may be established for communication between two
or more users in a particular MCPTT group, while
private calls can exist between two users regardless of
their group affiliation. Call control also supports ba-
sic, imminent peril, and emergency call types. These
call types indicate the status of a call and are used
to determine which network resources will be used
by that particular call. Calls can be established, up-
graded, downgraded, joined, left, rejoined, and re-
leased, and these actions are all accomplished through
call control.
Floor control is responsible for providing the ar-
bitration logic to determine who can talk at any given
time during an ongoing call (3GPP, 2017b). MCPTT
floor control currently supports queuing of requests,
priority, and preemption. On-network floor control
also supports dual speakers (i.e., two users talking
at the same time). Queuing is a feature that can be
used to coordinate passing the floor around from one
requesting user to another during a busy call. Ad-
Modeling MCPTT and User Behavior in ns-3
31
ditionally, priority and preemption make it possible
for users with a higher priority to interrupt the cur-
rent speaker and take the floor immediately. While the
assignment of user priority is not defined in the stan-
dard, it would be possible for users with a higher level
of operational authority to always have higher prior-
ity than users with less authority, and to temporarily
assign higher priorities to any user depending on their
status (e.g., a user that ends up in an emergency situ-
ation).
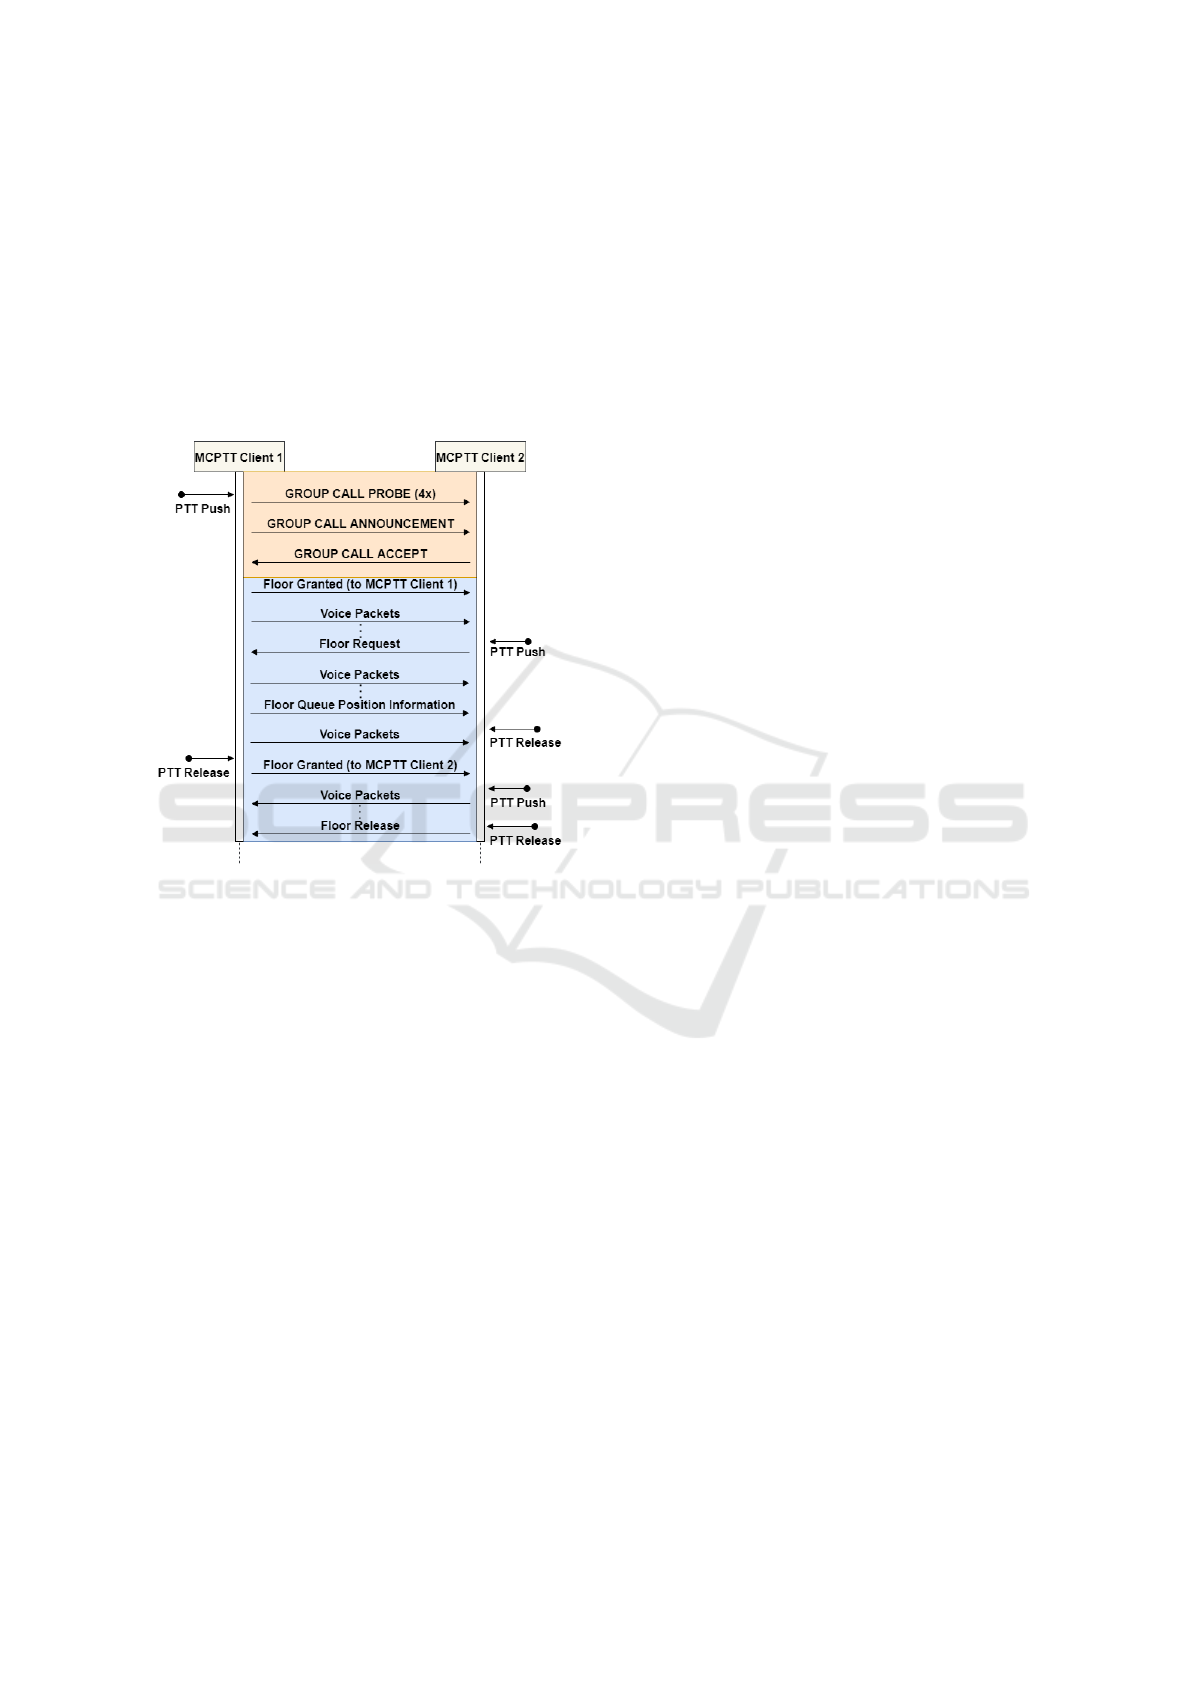
Figure 2: Off-network basic group call setup and use exam-
ple.
Figure 2 illustrates some of the signaling that
could take place during a basic, off-network, group
call between two MCPTT users. The call control sig-
naling is highlighted in orange while the floor control
portion is highlighted in blue. In this example the call
is initiated by a PTT push on Client 1 that triggers
a probe to be sent four times, and if there is no re-
sponse, the client concludes that there is no existing
call for the group. After determining a call does not
exist, Client 1 allocates floor control resources and
sends out a call announcement to the other members
in the group. Client 2 receives the announcement,
accepts the call, and also allocates floor control re-
sources. At this point, Client 1 grants itself the floor
and notifies the user that they may begin speaking,
at which point the client begins to send media pack-
ets that capture the user’s voice to Client 2. During
Client 1’s transmission the user of Client 2 pushes the
PTT button, which results in sending a floor request
to Client 1. Since queuing is enabled in this exam-
ple, Client 1 places the received request in the queue
and responds with a queue information message to
Client 2. Upon receiving the queue information mes-
sage, Client 2 makes the user aware that the user must
wait to speak. After the user of Client 1 is done speak-
ing, the user releases the PTT button which results in
Client 1 sending a granted message to Client 2, indi-
cating that the user of Client 2 may begin speaking.
Client 2 then makes the user aware, who then pushes
the PTT button to accept the grant and begin speak-
ing. Once the user of Client 2 is finished speaking,
the user releases the PTT button and a floor release
message is sent to Client 1 to indicate that the user
of Client 2 is done speaking. At this point, the floor
would be idle but could continue to be passed around
between Client 1 and Client 2 until the call ends or
is released by the users on the call. In addition, any
of the features that were previously discussed, such as
upgrading the call or additional users joining the call
could also take place.
3 RELATED WORKS
In this section we will discuss some literature related
to this model. First, this work extends our previously
published work, including Sun et al. (2019) and Garey
et al. (2020) that use earlier versions of the MCPTT
model presented in this paper. Specifically, Sun et al.
(2019) uses the ns-3 extension to create an analyti-
cal model that characterizes KPI 1 (access time) for
off-network mode taking into account various factors
that impact access time, including the scenario un-
der which access is being requested, key ProSe and
MCPTT configurations, and channel conditions. The
work in Garey et al. (2020) is an extension of Sun
et al. (2019) that also makes use of this model. In
Garey et al. (2020), KPI 1, packet loss, delay, and
data rate are used as performance indicators of the
MCPTT application to study the impact of traffic,
user density, range, and the underlying technology
by considering both ProSe and Wi-Fi in the analy-
sis. Our present work is distinguished by the inclu-
sion of on-network MCPTT models, a novel orches-
trated pusher model leveraging the translation of pub-
lic safety call logs into empirical distributions driving
the simulation, and a new example highlighting var-
ious modes of operation in a notional public safety
scenario. Where our previous work in Gamboa et al.
(2019) analyzed UE-to-Network Relay performance
with an abstracted MCPTT model, we are able herein
to run a highly complete simulation implementation
of MCPTT
Outside of our own work, several others have pub-
lished work related to MCPTT operations and perfor-
mance. In Feng and Li (2019), a conflict-adaptive
SIMULTECH 2021 - 11th International Conference on Simulation and Modeling Methodologies, Technologies and Applications
32

back-off solution is proposed and analyzed using a
Markov chain to investigate the performance of an en-
hanced version of the floor control protocol that could
increase the likelihood of a successful floor request
when multiple requests are initiated simultaneously.
Brady and Roy (2020) perform an analysis with data
collected from LMR and LTE systems in addition to
numerical computations to compare how a transition
from LMR to LTE would reduce wait times for first
responders that wish to speak. Choi et al. (2019) uses
a testbed to verify that with LTE MCPTT KPI mea-
surements meet their respective requirements. Kim
et al. (2019) uses an MCPTT test bed to investigate
how a state-based uplink-scheduler can be used to
reduce the latency of MCPTT signaling, in order to
improve the overall performance of an MCPTT ser-
vice. Kim et al. (2018) shows how the use of dy-
namic schedulers can be used to prioritize physical
resources in real time for MCPTT users to increase
download and upload speeds when the LTE network
is congested. Sanchoyerto et al. (2019) predicts that
MCPTT services will perform much better with the
use of 5G instead of 4G because of the estimated re-
duction in latency across the network. H
¨
oyhty
¨
a et al.
(2018) discusses how prioritization of physical re-
sources and rapidly deployable networks can be uti-
lized by mission critical services in 5G applications.
Solozabal et al. (2018) proposes a Mobile Edge Com-
puting (MEC) architecture specifically for the use of
MCPTT over 5G that could reduce call setup times
and observed KPI values. Atanasov et al. (2020) also
discusses the use of MEC to support mission critical
services but without the use of Internet Protocol Mul-
timedia Subsystem (IMS) that can provide improve-
ments in performance.
All of the related works mentioned above address
key issues facing MCPTT and other mission critical
service operations and performance. However, many
of the analyses focus solely on a single aspect of ei-
ther on-network or off-network mode operation. The
model that we will present gives researchers an op-
portunity to perform more comprehensive studies of
MCPTT using the ns-3 simulator to analyze KPIs, be-
havior, and other performance metrics with a high de-
gree of control and repeatability. This model could
also be used to verify, study, and combine the re-
lated literature mentioned in this paper, as well as
to perform large scale simulations that would other-
wise require a large degree of coordination and many
resources to execute using a real system or testbed
equipment, if it is even possible. Furthermore, since
our model is published as an open source extension of
ns-3, we present the user with an opportunity to ex-
pand on current and future contributions made by the
ns-3 and public safety communication research com-
munities.
4 MODEL
In this section we discuss the MCPTT model that is
implemented in ns-3. To start, we describe the ap-
plication model in Section 4.1, which is an abstrac-
tion of the MCPTT service defined by 3GPP in 3GPP
(2017a) and 3GPP (2017b). Next, we describe the
pusher model that simulates user PTT activity using
call log data in Section 4.2. Then, in Section 4.3 we
discuss what outputs can be collected from our model,
and how we verified our model’s behavior in Section
4.4. Finally, in Section 4.5 we discuss the model’s
limitations.
4.1 Application Model
As mentioned in Section 2, MCPTT is a mission crit-
ical voice communication service originally designed
to operate over LTE, specifically, for public safety.
Moreover, MCPTT is a relatively small part of a much
larger system. This means that for the most realis-
tic and comprehensive model of MCPTT, one must
also model LTE and support ProSe. This made ns-3
a prime candidate for our MCPTT model, as it is
an open source network simulator that contains mod-
els for a number of communication technologies in-
cluding LTE and ProSe (Rouil et al., 2017). It also
supports the development of application layer mod-
els, primarily for generating traffic, which is where
MCPTT fits into the network stack.
We also looked into using several other tools such
as Vienna
2
and SimuLTE
3
. However, we found that
Vienna is primarily a system and link layer simula-
tor based on Monte Carlo simulations that does not
model applications at the packet level. While Si-
muLTE is capable of modeling applications at the
packet level through the use of “modules”, we deter-
mined from experimentation that ns-3 offered greater
control of application behavior and traffic for our pur-
poses. SimuLTE also focuses on network-controlled
D2D which requires UEs to be in-coverage (Nardini
et al., 2018), whereas the D2D model in ns-3 sup-
ports in-coverage, out-of-coverage, and partial cov-
erage situations.
To extend ns-3 with an MCPTT model, we
created two new ns-3 applications that follow the
2
https://www.nt.tuwien.ac.at/research/mobile-
communications/vccs/
3
https://simulte.com
Modeling MCPTT and User Behavior in ns-3
33

MCPTT service defined in 3GPP (2017a) and 3GPP
(2017b) very faithfully. They are the McpttPttApp,
which represents the client application, and the
McpttServerApp, which represents the server appli-
cation. These two ns-3 applications coordinate sev-
eral components that are necessary to provide many
of the features described in Section 2. The client-side
application, whose architecture is depicted in Fig-
ure 3, is the entity that offers a user Application Pro-
gramming Interface (API) for MCPTT. This includes
functions for pushing/releasing the PTT button, ini-
tiating/releasing calls, upgrading/downgrading calls,
and switching between multiple calls. It also contains
some information, such as the MCPTT user ID that
would normally be stored in the Mission Critical Ser-
vices (MCS) Management Object (MO) from 3GPP
(2018a). The server-side application is intended to
be installed on a server node and primarily communi-
cates with the client application using a combination
of MCPTT and Session Initiation Protocol (SIP) de-
fined messages.
Both applications maintain a set of McpttCall
objects that represent MCPTT calls. Only one call
can be “selected” at a time by the client applica-
tion, and this is the call that is affected by func-
tions from the application’s API. Each call contains an
McpttCallMachine object, an McpttFloorMachine
object, and channels for floor control and me-
dia messages. The channels used for call con-
trol messages reside in and are maintained by the
MCPTT applications. The McpttCallMachine and
McpttFloorMachine classes serve as interfaces that
are specialized by concrete classes to allow the user
to configure a call taking into account the variety
of call types and modes of operation. For exam-
ple, the two state machines needed to perform an
off-network, basic group call would be the state ma-
chines from Section 10.2.1 in 3GPP (2017a) and
Section 7.2.3 in 3GPP (2017b), which are imple-
mented by the McpttCallMachineGrpBasic and
McpttOffNetworkFloorParticipant classes in our
model. Other parameters and configurations, such as
group affiliation and resource allocation, is handled
by the McpttCallMachine, while priority and pre-
emption is handled by the McpttFloorMachine.
In addition to the main MCPTT components
described above, we also created several supplemen-
tary components to facilitate MCPTT operations.
This includes the McpttCounter, McpttTimer,
McpttChannel, and McpttFloorQueue classes.
McpttCounter and McpttTimer objects are
used to model counters and timers, while the
McpttFloorQueue class is used as needed to
store floor requests when queuing is enabled. The
Figure 3: Client-side application architecture.
McpttChannel class models the logical channels
necessary for communication between the applica-
tions.
Along with those components we also model the
call control and floor control messages necessary
for signaling between various state machines, which
also include a simplified SIP module to handle the
SIP related procedures and messages when operat-
ing in on-network mode. For example, the class
McpttFloorMsgRequest represents the “Floor Re-
quest” message from the floor control protocol, and
the McpttMediaMsg represents the Real-time Trans-
port Protocol (RTP) media messages used to transmit
voice when a user is speaking.
The application also includes a configurable me-
dia source to model the transmission of RTP packets
when a user has the floor. This is accomplished by the
McpttMediaSrc that can be configured to generate a
payload of size S at a data rate of D. With this com-
ponent the user of this model can mimic the traffic
generated by a Constant Bit Rate (CBR) encoder. For
example, the media source could be configured with
S = 60 B and D = 24 kbit/s to send packets at a size
and interval that resembles the traffic generated by the
Adaptive Multi-Rate Wideband (AMR-WB) codec at
23.85 kbit/s (ITU-T, 2003).
4.2 Pusher Model
In addition to the protocol elements described in Sec-
tion 4.1, we also model user activity to automate the
use of the MCPTT service. This is accomplished by
the McpttPusher class that is attached to each in-
stance of an McpttPttApp object. We refer to this
class as a “pusher” since it generates “push” and
“release” events over the course of a simulation to
mimic a user pushing and then later releasing the
PTT button on their device. The default and simplest
form of our pusher model is when an instance of the
McpttPusher class acts independently, using random
variables. In this mode of operation, which we re-
fer to as “automatic mode,” the pusher uses two ran-
dom variables: one for generating a time span before
a push indication will occur, and another for generat-
SIMULTECH 2021 - 11th International Conference on Simulation and Modeling Methodologies, Technologies and Applications
34

ing a time span before a subsequent release indication
will occur.
Even though automatic mode allows the user to
configure PTT activity for an individual pusher, it can
be cumbersome to quantify, configure, and character-
ize the overall channel activity for a group of MCPTT
users. This is due to the fact that PTT events are
generated independently of one another in automatic
mode. This also means that unlike the users of most
public safety organizations, independent pushers do
not take into account politeness or situational behav-
ior based on what the other pushers’ actions are or
the current state of the call. As a result, we defined
another approach, called “orchestrated mode,” that
provides a more coordinated pusher model across the
users in a call. The benefits of orchestrated mode in-
clude the automated selection of pushers to produce
PTT events and the ability to configure parameters at
the system level according to the desired rate of ac-
tivity. In contrast, automatic mode would require the
ns-3 user to configure pushers by scaling the values
used for each random variable based on the number
of pushers that will be participating in each call to
achieve an overall activity rate.
0
0.1
0.2
0.3
0.4
0.5
0.6
0.7
0.8
0.9
1
0 10 20 30 40 50 60 70 80
Probability that duration <= t
t (s)
Talk Spurt
Talk Session
Figure 4: Talk spurt and talk session duration CDFs.
Orchestrated mode is achieved by using an
instance of the McpttPusherOrchestrator class.
This class is a centralized entity that controls a set of
pushers by scheduling its own push and release events
just like an individual pusher, but then randomly
selects a pusher from the set it is orchestrating to
carry out the actions. We also analyzed public safety
call logs that were taken from an existing LMR
system to further enhance the pusher model. During
our analysis we determined that our model needed to
capture two key elements to simulate the PTT behav-
ior of such users: “talk spurts” and “talk sessions.”
We define the length of a talk spurt to be the time
from when a PTT event begins until it ends, while
the length of a talk session is simply the total length
of consecutive talk spurts from one or more UEs in
the same group. This resulted in the data sets plotted
in Figure 4, for which a Cumulative Distribution
Function (CDF) is used to capture the distribution of
8381 talk spurt lengths and 4606 talk session lengths.
These data sets enable us to use orchestrated mode
in combination with empirical random variables to
resemble the overall PTT activity of a real public
safety group call. The first enhancement comes
from the McpttPusherOrchestratorSpurtCdf
class, which creates and configures an underlying
McpttPusherOrchestrator instance specifically to
schedule talk spurt lengths based the talk spurt length
CDF from Figure 4. The second enhancement comes
from the McpttPusherOrchestratorSessionCdf
class that can be attached to an
McpttPusherOrchestratorSpurtCdf instance
to enforce talk sessions based on the talk session
length CDF in Figure 4.
While we were able to gather similar information
about the interarrival times of talk spurts and talk ses-
sions, we do not know if these statistics are highly
dependent on the number of devices in a group call
because while the call logs provide valuable informa-
tion about active users, we do not know the system
configuration, the total number of groups, or the size
of those groups. Thus, we could not generalize in-
terarrival times with respect to different group sizes.
Therefore, we leave it up to the user to control inter-
arrival times using an “activity factor.” With this ap-
proach, we assume that the interarrival times of talk
sessions and talk spurts follow an exponential distri-
bution, which is scaled by the activity factor set by
the user. This means that the user can specify indi-
vidual values between (0, 1] for both parameters to
determine the overall PTT activity during a simula-
tion, with 0 representing no activity and 1 represent-
ing non-stop activity. The equation used to determine
the mean interarrival time of talk spurts (x
IAT
) is:
x
IAT
= x
T
∗ (
1
VAF
− 1) (1)
where x
T
is the average duration of a talk spurt, which
we determined to be 4.69 s in our logs, and VAF is the
activity factor set by the user. The equation used to
determine the mean interarrival time of talk sessions
(y
IAT
) is:
y
IAT
= y
T
∗ (
1
SAF
− 1) (2)
where y
T
is the average duration of a talk session,
which we determined to be 8.58 s in our logs, and
SAF is the activity factor set by the user.
For example, Figure 5 shows the resulting time-
line of events if VAF = 1, SAF = 0.25, we have two
Modeling MCPTT and User Behavior in ns-3
35

inactive
active
released
pushed
released
pushed
0 10 20 30 40 50 60 70 80
State
t (s)
Session
Pusher 1
Pusher 2
Figure 5: Orchestrated pusher model example.
pushers, and the total simulation time is 80 s. In this
graph, the simulation time is on the x-axis while the
states of sessions and pushers are on the y-axis. This
indicates that there is an active talk session for 25 %
of the total simulation time, and that within each ac-
tive talk session a PTT button is pushed 100 % of the
time. Note that, even though both VAF and S AF are
configurable, setting VAF = 1 best matches the activ-
ity from the call logs that we analyzed. This is due
to the fact that PTT events recorded in these logs and,
consequently, captured in all of the statistics that we
collected, include “hang time”. Hang time is an LMR
system parameter that, as captured in the call logs,
is additional time added to the end of a user’s trans-
mission so that if a consecutive transmission occurs
for that same user before a given amount of time has
passed, it is recorded as one event. This means that it
is likely the case that there were more occurrences of
PTT events than what is recorded in the logs, and the
actual lengths of those PTT events were shorter. For
example, if the system hang time is 3 s, a user pushes
the PTT button for 2 s, releases the PTT button, and
then 1 s later pushes the PTT button again for another
2 s before releasing it, this is recorded as one PTT
event with a duration of 2 + 1 + 2 + 3 = 8 s.
Our third enhancement to or-
chestrator mode comes from the
McpttPusherOrchestratorContention class
that accounts for overlapping PTT events, which
are necessary for queuing and preemption to occur.
An instance of this class can be attached to the
McpttPusherOrchestrator to simulate colliding
PTT events. This is accomplished by generating a
value between [0, 1) with a uniform random variable
and comparing it to a threshold set by the user
whenever a PTT event scheduled by the underlying
orchestrator occurs. We refer to this threshold as
the Contention Probability (CP), and if the random
value generated is less than CP then an additional
PTT event will occur at anytime during the original
event. For example, if there were originally 100 PTT
events in the previous example, we then included an
McpttPusherOrchestratorContention instance,
and set CP = 0.1 (10 %), then approximately 10
out of the 100 PTT events generated by the original
orchestrator would trigger an additional overlapping
PTT event for a total of 110 PTT events. This
means that, in total, approximately 9 % of all PTT
events would be generated by the newly included
orchestrator. In addition to the overall probability, to
calculate the probability that any individual pusher’s
PTT event will overlap with another pusher’s PTT
event (PC
I
), Equation 3 can be used.
PC
I
=
2 ∗CP
1 +CP
(3)
4.3 Outputs
The current implementation of our model contains
several traces that can be used to derive information
about various aspects of the MCPTT application. The
message and state machine traces can be parsed post-
simulation to study behavior and performance.
Table 1: Message trace snippet.
time (s) nodeid rx/tx bytes message
30.54 1 TX 58 McpttFloorMsgGranted
30.59 2 RX 58 McpttFloorMsgGranted
The message trace captures all MCPTT applica-
tion message exchanges between state machines dur-
ing a simulation. This includes all call control, floor
control, and media messages, each of which can be
filtered at the user’s discretion. Table 1 shows the col-
umn names and two sample rows of data that can be
included in this trace. Both traces include general in-
formation such as the ID of the node that created the
entry in the trace and the time at which that record
was created. Columns that are included specific to the
message trace are those that indicate whether or not a
message was sent or received, the size of the message,
and the name of the message. For example, the first
row of data in Table 1 indicates that 30.54 s into the
simulation, node 1 sent a “Floor Granted” message
that was 58 B in size. With this trace, information
such as packet loss, delay, jitter, and data rate can be
determined with varying granularity (e.g., per call, per
application, etc.).
The data included in the state machine trace cap-
tures internal state information for various MCPTT
state machines. Therefore, on top of the general
fields, it also includes fields such as the name of the
state machine that the record is for, the previous state
of the state machine, and the new state of the state ma-
SIMULTECH 2021 - 11th International Conference on Simulation and Modeling Methodologies, Technologies and Applications
36

chine. With this trace, information such as the status
of a call and the state of an application can be ex-
tracted. The user could also use this trace to detect
operations and behavior that does not result in or is
not the result of any message exchanges, such as in-
activity or termination events.
In addition to the basic traces mentioned above,
we also have traces to capture KPIs that measure the
performance of MCPTT as defined by 3GPP (2019).
The KPIs that our model is currently capable of re-
porting include access time (KPI 1) and mouth-to-ear
latency (KPI 3).
To capture KPI 1, which measures the delay be-
tween a request to speak and the corresponding grant,
our model uses the state transitions of the floor con-
trol state machine. The initial request to speak is indi-
cated by a change to the ‘O: Pending Request’ state,
and the grant is indicated by a subsequent transition
to the ‘O: Has Permission’ state. The trace includes a
result field to capture the outcome of a PTT request as
there are several that need to be considered. The de-
lay and outcomes of KPI 1 can be traced to an output
file as depicted in Table 2.
Table 2: KPI 1 trace snippet.
time (s) userid callid result latency (s)
7.246 1 0 I 0.024
25.907 3 1 Q 2.653
28.952 4 1 I 0.024
34.017 3 1 D 0.651
The five possible outcomes that may result from a
PTT request can be filtered based on the fourth col-
umn in Table 2, with “I” denoting “immediate”, “Q”
denoting “queued”, “D” denoting “denied”, “F” de-
noting “failed”, and “A” denoting “abandoned”. The
meaning of each outcome value can be found in Ta-
ble 3. Table 2 illustrates that 7.246 s into the simu-
lation, the user with MCPTT User ID 1, was granted
the floor immediately upon request and it took 24 ms.
When measuring access time using this trace only “I”
and “Q” outcomes align with the definition of KPI 1,
and it is important to note that “Q” outcomes will be
heavily dependent on pusher behavior. It is also worth
mentioning that 3GPP (2019) specifies that KPI 1
should be less than 300 ms for 99 % of all on-network
MCPTT requests when there is negligible backhaul
delay and less than 70 % load per node. There is no
similar requirement defined for off-network mode as
of this writing.
To capture KPI 3 in our model, the RTP pack-
ets of a talk spurt include a timestamp to mark when
they were generated. When those RTP packets are
received by a receiving MCPTT application it will
Table 3: KPI 1 trace outcome definitions.
Result Definition
I Granted immediately.
Q Queued and subsequently granted.
D Denied immediately.
F Timeout or unexpected sequence.
A PTT button was released.
check whether the packet contains a newer ‘start-of-
talkspurt’ timestamp, which indicates that a new talk
spurt exists. The latency of each new talk spurt is
then traced by each receiving application as depicted
in Table 4. From the row in Table 4 we can see that
3.727 s into the simulation, node 8 detected a new talk
spurt from Synchronization Source (SSRC) 3 that had
a latency (i.e., KPI 3) of 24 ms.
Table 4: KPI 3 trace snippet.
time (s) ssrc nodeid callid latency (s)
3.727 3 8 1 0.024
4.4 Verification
MCPTT off-network models were subject to an exten-
sive verification, previously published in Varin et al.
(2018), against 3GPP (2017a) and 3GPP (2017b) to
verify the model’s behavior. We have verified and
validated our on-network models in several ways.
First, 3GPP defined conformance tests for selected
on-network mode configurations in 3GPP (2020), and
we defined ns-3 unit tests to align with the testing
steps in that document. Second, Nemergent Solu-
tions, a vendor based in Spain that develops Mission
Critical solutions, has published detailed packet traces
for MCPTT version 13.3 on-demand, on-network,
pre-arranged group call with automatic commence-
ment
4
, and we aligned our basic tests with this trace.
Finally, the Public Safety Communication Research
(PSCR) division at the National Institute of Standards
& Technology (NIST) conducted small-scale mea-
surements of MCPTT on-network operations using a
testbed and shared packet traces with us, with which
we confirmed close alignment.
4.5 Limitations
While we intend for our model to capture the behavior
of an actual MCPTT system, it is not an actual sys-
tem with real users. This comes with limitations that
have the potential to affect studies performed with
our model and may lead to unrealistic observations.
4
https://nemergent.com/traces.html
Modeling MCPTT and User Behavior in ns-3
37

The limitations that we will discuss in the remainder
of this section include any components, features, and
functionalities that we know to be lacking or absent
in our current ns-3 implementation.
We mentioned in Section 4.1 that MCPTT is a
part of a much larger system, and we must therefore
also consider the limitations of the models that sur-
round our MCPTT model. This includes limitations
in ns-3’s LTE model since it is the network technology
that MCPTT was initially designed to operate over.
The ProSe model does not support ProSe Per Packet
Priority (PPPP), affecting the priority of physical re-
sources used by an off-network MCPTT application
when the call is in an elevated status. A similar limi-
tation exists for on-network operation, since the LTE
schedulers in ns-3 are not designed to prioritize on
a bearer basis or within a bearer based on call status
as specified by 3GPP (2017a). This means that any
studies pertaining to call priority and resource allo-
cation based on call status would require further de-
velopment of the underlying ns-3 LTE model. Also,
the UE-to-Network Relay model lacks coordination
between the uplink (UL) and sidelink (SL) resource
scheduling, which impacts the performance of any ap-
plication running over relay (Gamboa et al., 2019).
The ns-3 Evolved Packet Core (EPC) model in LTE
is also simplistic, with idealized representations of
the MME and no modeling of delays that may come
from authorization, access control, roaming, server
processing, etc. These gaps in modeling are not fun-
damental limitations but arise from the current state of
the models. MCPTT-based simulation studies would
benefit from future improvements to the ns-3 cellular
modeling fidelity because prioritization and non-ideal
control channels have the potential to affect measured
KPIs and general statistics such as packet delay.
In Section 4.2 we already mentioned several fac-
tors from the call logs that impact our pusher model,
but we did not mention additional studies that could
be performed to enhance this model. For example, our
model does not take into account user impatience and
the effect of network congestion that leads to aban-
doned transactions and more user impatience, such as
is done in Baynat et al. (2015). Such user behavior
could also be directly studied with regard to public
safety users in cases where PTT requests do not go
through, and possibly influenced by different opera-
tional contexts, such as a natural disaster or a routine
traffic stop. With that said, our model could be ex-
panded to take into account environmental and/or sit-
uational details to realize more realistic PTT activities
that could ultimately lead to more realistic traffic pat-
terns.
5 CASE STUDY
At the annual Public Safety Broadband Stakeholder
meeting, we demonstrated the use of this model in a
large-scale, public safety, scenario with a notional du-
ration of four hours and involving over one hundred
nodes in various operational roles
5
. However, we fo-
cus herein on a smaller scale scenario because it more
clearly highlights the key modes of operation (on-
network via basic LTE or UE-to-Network Relay, and
off-network via ProSe) that are currently supported.
This scenario will be included in the next release of
our public safety extensions for ns-3, with the basic
goal of comparing performance metrics for three pub-
lic safety network configurations.
This scenario consists of three teams of MCPTT
users, with each team participating in its own
MCPTT group call. All team members of team one
are located within coverage of an eNodeB so they
are all connected to the network (on-network). The
second team is only connected with each other via
ProSe since they are inside a building whose walls
prevent connection to an eNodeB on the outside that
would allow this team to connect to the network
(off-network). A third team operates in a hybrid
mode; all team members are within the building,
but one team member is situated at the door with
connectivity to both the team inside and the eNodeB
(relay). This team member runs a UE-to-Network
Relay service (defined in 3GPP (2018b)), connecting
oneself and team members on the inside with the
network. Figure 6 illustrates the scenario topology.
The simulation can be scaled to different team sizes
(with a default of 4 users per team) and run with a
configurable simulation duration.
Figure 6: Example MCPTT scenario.
5
https://www.nist.gov/ctl/pscr/simulation-and-
visualization-public-safety-incidents
SIMULTECH 2021 - 11th International Conference on Simulation and Modeling Methodologies, Technologies and Applications
38

The ns-3 simulator has abstractions for the physi-
cal layer models, allowing insertion of path loss mod-
els that affect the packet error rates that are experi-
enced in a simulation. This includes models that take
building wall penetrations into account, one of which,
the HybridBuildingsPropagationLossModel, we
use in this example. The network technology is
LTE, with a notional EPC network and a public
safety server that houses the MCPTT server. In this
example, the EPC round-trip delay for on-network
and relay operation (from eNodeB to the MCPTT
server, and back) is configured as a fixed 60 ms. The
off-network SL period is configured to its lowest
possible value of 40 ms.
We highlight performance here by post-
processing the raw KPIs described in Section
4.3 to generate empirical CDFs on a per-team
basis. This includes the access time performance
(KPI 1) and the mouth-to-ear latency performance
(KPI 3) that are observable once an MCPTT user
has successfully obtained access to the floor. Each
team is configured with automatic pushers governed
by normal random variables with a mean IAT of
10 s, and a mean duration of 1 s (negative values are
truncated to zero). Therefore, the overall pusher busy
time is roughly
4
11
or 36 %.
Figure 7: MCPTT Access Time for immediately granted
requests with queuing disabled.
The first set of results presented is from a con-
figuration that disables queuing of floor requests, so
any request for the floor will be either granted imme-
diately, denied, or fail or be abandoned if the floor
request is not served in time. Figure 7 plots the em-
pirical CDF of the access times observed for floor re-
quests, for a simulation that runs until at least 1000
successful network accesses are observed for each
team. Only values for immediately served or success-
fully queued requests contribute to the CDF of access
times. Also tabulated, for each team, are the percent-
ages observed for each type of outcome.
On-network access time is expected to provide the
lowest minimum latency, because the server is cen-
tralized and can determine access immediately. In
this first case without queuing enabled, on-network
access time represents the sum of the core network
delay (60 ms, as stated above), and the Radio Access
Network (RAN) delay, which ranges from 15 ms to
19 ms in this configuration, leading to a nearly ver-
tical line in the plot at around 75 ms. For the off-
network team, access time should be around 120 ms
most of the time, when the floor is idle, because by
default the distributed protocol uses 3 SL periods to
be confident that the floor is available before taking
it. However, it could take longer because the floor
control protocol also takes into account when multi-
ple users are requesting the floor at the same time,
at which point, additional SL periods may be re-
quired. In the illustrated case, it takes more time in
off-network mode for floor control coordination than
the round-trip time it takes for the request/response
exchange with the on-network server. The UE-to-
Network Relay team’s performance in this case ex-
ceeds that of the on-network case, due to the extra re-
lay hop introducing additional delay and loss in about
75 % of the requests. The lowest 25 % of values in
the relay case correspond to floor requests initiated
by the relay team member itself, which do not require
any SL transmissions. As explained in more detail in
Gamboa et al. (2019), message loss can happen due
to scheduling decisions at the relay (prioritizing UL
over SL transmissions, serving the attached nodes us-
ing round robin, and SL period transmission cutoff)
and due to the half-duplex operation of SL transmis-
sion, so message loss may be significantly higher as
compared to the on-network case. The CDF points
that appear as extreme outliers of latency (greater than
1 s) are due to floor request retransmissions, the timer
for which has a timeout value of 1 second.
Figure 8 shows the access time CDF from a sim-
ilarly configured simulation, with the only difference
being that queuing of floor requests is enabled for
both on-network and off-network. In general, queuing
increases the probability that a request will be served,
at the expense of additional access time delay. If the
floor request is queued, then the time to wait for the
current talker, or those earlier in the queue, will be
added to the latency. The plot shows that roughly
80 % of the values are immediately served, and the
remaining 20 % of the values are queued (abandoned,
denied, and failed requests are not counted in the
CDF). The CDF slope above 80 % is gradual and
reaches maximum values of between 2 s and 4 s for
the three teams; these latencies are dependent on wait-
ing for one or more talk spurts to end.
Modeling MCPTT and User Behavior in ns-3
39
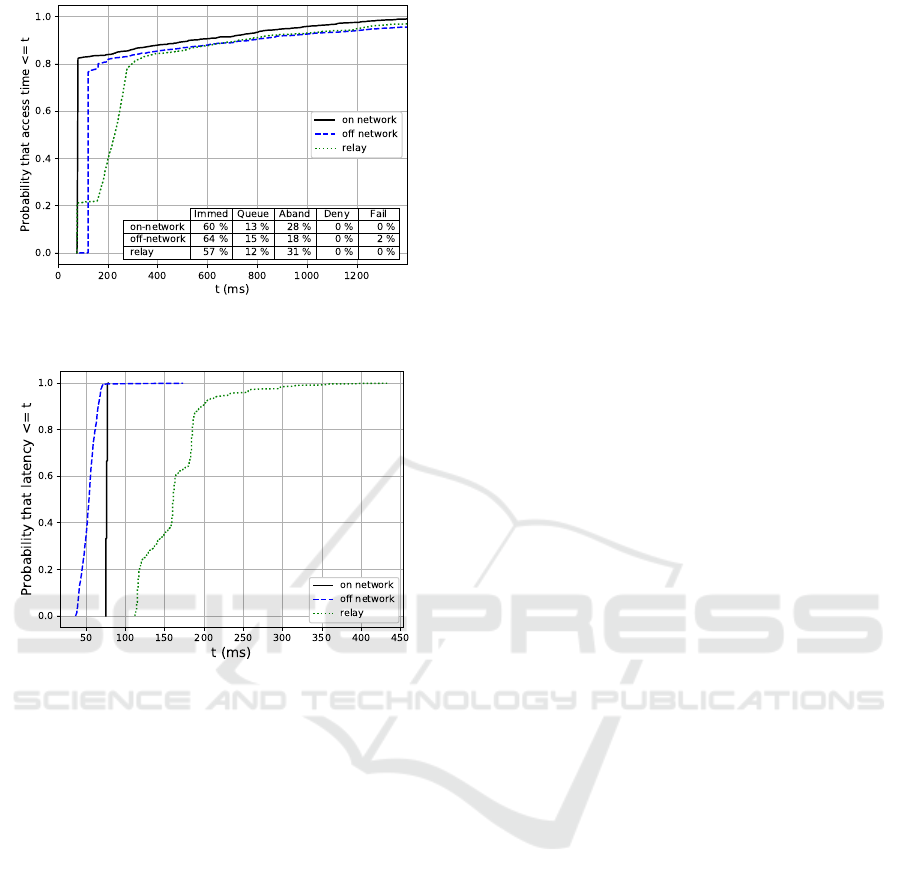
Figure 8: MCPTT Access Time for queued or immediately
granted requests with queuing enabled.
Figure 9: MCPTT Mouth-to-Ear Latency.
For this scenario, the plot shown in Figure 9 illus-
trates an empirical CDF of the mouth-to-ear latency
of the beginning of each talk spurt in the same simu-
lation scenario with queuing disabled. Unlike the ac-
cess time statistics, the mouth-to-ear latency statistics
are unaffected by the queuing configuration because
the latency samples are taken after the floor has been
granted. This CDF illustrates that with off-network
operation, the RTP packets can flow directly between
devices and do not have to go to the eNodeB, core net-
work, server, and then back. On-network takes longer,
as expected, because of the round trip that RTP pack-
ets incur (to the MCPTT server and back), while the
relay experiences even more latency, as expected, due
to the additional SL hop that introduces higher delays
and loss. When queuing is disabled, the on-network
mouth-to-ear latency and the access time latency are
roughly the same (one RTT), as shown. One differ-
ence between Figures 7 and 9 for relay communica-
tions is that we no longer observe latency greater than
1 s for the data traffic because there are no lost floor
request messages that need to be re-transmitted.
6 CONCLUSION
In this paper we presented an MCPTT simulation
model that extends the network simulator, ns-3.
Based on our earlier work to develop standards-
aligned call control and floor control simulation mod-
els for MCPTT off-network operation, we describe
herein the extension to on-network operation, the en-
hancement of our PTT traffic generation model (based
on distilling PTT call traces to parameterize stochas-
tic talk events in ns-3), and a public safety exam-
ple scenario. We also summarize the basic opera-
tion of MCPTT in practice, the architecture of the
ns-3 MCPTT model and limitations thereof, the out-
put data available for analysis, and how we verified
the model using test cases and published traces from
an on-network MCPTT testbed. Future work will in-
clude the development of new and existing compo-
nents, features, and functionalities discussed in Sec-
tion 4.5 that will enhance the accuracy and behavior
of our current MCPTT model and the models that sur-
round MCPTT for a more realistic representation of
the service. Future work will also include the use
of this model to further analyze and develop public
safety scenarios to study the impact of system config-
urations, traffic loads, etc. on MCPTT performance.
REFERENCES
3GPP (2017a). Mission Critical Push To Talk (MCPTT)
call control; Protocol specification. Technical Spec-
ification 24.379, 3rd Generation Partnership Project
(3GPP). Version 14.4.0.
3GPP (2017b). Mission Critical Push To Talk (MCPTT)
media plane control; Protocol specification. Techni-
cal Specification 24.380, 3rd Generation Partnership
Project (3GPP). Version 14.4.0.
3GPP (2018a). Mission Critical Services (MCS) Manage-
ment Object (MO). Technical Specification 24.483,
3rd Generation Partnership Project (3GPP). Version
14.4.0.
3GPP (2018b). Proximity-based services (ProSe); Stage 2.
Technical Specification 23.303, 3rd Generation Part-
nership Project (3GPP). Version 15.1.0.
3GPP (2019). Mission Critical Push To Talk (MCPTT);
Stage 1. Technical Specification 22.179, 3rd Genera-
tion Partnership Project (3GPP). Version 16.5.0.
3GPP (2020). Mission Critical (MC) services over LTE;
Part 2: Mission Critical Push To Talk (MCPTT)
User Equipment (UE) Protocol conformance specifi-
cation. Technical Specification 36.579-2, 3rd Genera-
tion Partnership Project (3GPP). Version 14.6.0.
Atanasov, I., Pencheva, E., and Nametkov, A. (2020). Han-
dling Mission Critical Calls at the Network Edge. In
2020 International Conference on Mathematics and
SIMULTECH 2021 - 11th International Conference on Simulation and Modeling Methodologies, Technologies and Applications
40

Computers in Science and Engineering (MACISE),
pages 6–9.
Baynat, B., Vasseur, M., and Abreu, T. (2015). Revisiting
the Characterization and the Modeling of User Impa-
tience in Ubiquitous Networks. PE-WASUN ’15: Pro-
ceedings of the 12th ACM Symposium on Performance
Evaluation of Wireless Ad Hoc, Sensor, pages 85–91.
Brady, C. and Roy, S. (2020). Analysis of Mission Critical
Push-to-Talk (MCPTT) Services Over Public Safety
Networks. IEEE Wireless Communications Letters,
9(9):1462–1466.
Choi, S. W., Song, Y., Shin, W., and Kim, J. (2019). A Fea-
sibility Study on Mission-Critical Push-to-Talk: Stan-
dards and Implementation Perspectives. IEEE Com-
munications Magazine, 57(2):81–87.
Feng, S. and Li, H. (2019). Floor Control Conflict Resolu-
tion in Off-network Mode of MCPTT. In 2019 IEEE
9th International Conference on Electronics Informa-
tion and Emergency Communication (ICEIEC), pages
509–513.
Gamboa, S., Thanigaivel, R., and Rouil, R. (2019). System
Level Evaluation of UE-to-Network Relays in D2D-
Enabled LTE Networks. In 2019 IEEE 24th Inter-
national Workshop on Computer Aided Modeling and
Design of Communication Links and Networks (CA-
MAD), pages 1–7.
Garey, W., Sun, Y., and Rouil, R. (2020). Perfor-
mance Evaluation of Proximity Services and Wi-Fi
for Public Safety Mission Critical Voice Applica-
tion. Wireless Communications and Mobile Comput-
ing, 2020(8198767).
H
¨
oyhty
¨
a, M., L
¨
ahetkangas, K., Suomalainen, J., Hop-
pari, M., Kujanp
¨
a
¨
a, K., Trung Ngo, K., Kippola, T.,
Heikkil
¨
a, M., Posti, H., M
¨
aki, J., Savunen, T., Hulkko-
nen, A., and Kokkinen, H. (2018). Critical Com-
munications Over Mobile Operators’ Networks: 5G
Use Cases Enabled by Licensed Spectrum Sharing,
Network Slicing and QoS Control. IEEE Access,
6:73572–73582.
ITU-T (2003). Wideband coding of speech at around 16
kbit/s using Adaptive Multi-Rate Wideband (AMR-
WB). Technical Specification G.722.2, TELECOM-
MUNICATION STANDARDIZATION SECTOR OF
ITU (ITU-T). Version 16.5.0.
Kim, H., Jo, J., Park, C., Ahn, S., Chin, H., Park, P., and
Kim, Y. (2018). Dynamic Resource Scheduling Al-
gorithm for Public Safety Network. In 2018 UKSim-
AMSS 20th International Conference on Computer
Modelling and Simulation (UKSim), pages 127–132.
Kim, J., Jo, O., and Choi, S. W. (2019). State-Based Uplink-
Scheduling Scheme for Reducing Control Plane La-
tency of MCPTT Services. IEEE Systems Journal,
13(3):2547–2550.
Nardini, G., Virdis, A., and Stea, G. (2018). Model-
ing Network-Controlled Device-to-Device Communi-
cations in SimuLTE. Sensors (Basel, Switzerland),
18(10):3551.
Rouil, R., Cintr
´
on, F., Ben Mosbah, A., and Gamboa, S.
(2017). Implementation and Validation of an LTE
D2D Model for Ns-3. In Proceedings of the Work-
shop on Ns-3, WNS3 ’17, page 55–62, New York, NY,
USA. Association for Computing Machinery.
Sanchoyerto, A., Solozabal, R., Blanco, B., and Liberal, F.
(2019). Analysis of the Impact of the Evolution To-
ward 5G Architectures on Mission Critical Push-to-
Talk Services. IEEE Access, 7:115052–115061.
Solozabal, R., Sanchoyerto, A., Atxutegi, E., Blanco, B.,
Fajardo, J. O., and Liberal, F. (2018). Exploitation of
Mobile Edge Computing in 5G Distributed Mission-
Critical Push-to-Talk Service Deployment. IEEE Ac-
cess, 6:37665–37675.
Sun, Y., Garey, W., Rouil, R., and Varin, P. (2019). Access
Time Analysis of MCPTT Off-Network Mode over
LTE. Wireless Communications and Mobile Comput-
ing, 2019(2729370).
Varin, P., Sun, Y., and Garey, W. (2018). Test Scenar-
ios for Mission Critical Push-To-Talk (MCPTT) Off-
Network Mode Protocols Implementation. Technical
Report 8236, NIST.
Modeling MCPTT and User Behavior in ns-3
41
