
Building an Integrated Relational Database from Swiss Nutrition’s
(menuCH) and Multiple Swiss Health Datasets Acquired from 1992
to 2012 for Data Mining Purposes
Timo Lustenberger
1
, Helena Jenzer
2
and Farshideh Einsele
1
1
Section of Business Information, Bern University of Applied Sciences, Switzerland
2
Hospital of Psychiatry, University of Zurich, Switzerland
Keywords: Health Informatics, Data Mining, Nutritional and Health Databases, Nutritional and Chronical Databases,
Modelling and Managing Large Data Systems, Data Management for Analytics, Large Scale Databases,
Database Architecture and Performance.
Abstract: Objective: The objective of the study was to integrate a large database from Swiss nutrition national survey
(menu-CH) with 5 extensive databases derived from 5 consecutive Swiss health national surveys from 1992
to 2012 for data mining purposes. Each database has additionally a demographic base data. An integrated
Swiss database is built to later discover critical food consumption patterns linked with lifestyle diseases
known to be strongly tied with food consumption and compare the derived rules with the rules resulted with
a previous study which used a significantly smaller database. Design: Swiss nutrition national survey (menu-
CH) with approx. 2000 respondents from two different surveys, one by Phone and the other by questionnaire
along with Swiss health national surveys from 1992 to 2012 with over than 100000 respondents were pre-
processed, cleaned, transformed and finally integrated to a unique relational database. Results: The result of
this study is an integrated relational database from the Swiss nutritional and 20 years of Swiss health data.
1 INTRODUCTION
Lifestyle diseases aka chronical diseases are a key
determinant of global public health. These diseases
are diseases of long-term duration and include
obesity, hypertension, type 2 diabetes, high
cholesterol, cancer, mental disorders, cardiovascular
diseases (including hypertension and stroke), and
osteoporosis. They are different from communicable
diseases (CD) like Ebola or Corona since they are
non-contagious and are often related to nutritional
habits (WHO, 2003). Nevertheless, chronical
diseases are no longer a disease of developed
countries, the prevalence of chronical diseases is
steadily increasing everywhere, most markedly in the
world’s middle-income countries (WHO, 2019).
Moreover already 79% of deaths attributable to
chronic diseases are occurring in developing
countries (WHO, 2019). According to WHO report in
2017, 11 million (95% uncertainty interval) deaths
and 255 million DALYs were attributable to dietary
risk factors (WHO, 2018). Another report of WHO
states that an estimated 422 million adults were living
with diabetes in 2014, compared to 108 million in
1980 (WHO, 2018). Furthermore, part of the 2030
Agenda of WHO is to reduce premature mortality
from non-communicable diseases (NCD) – including
diabetes – by one third [(WHO, 2018). The role of
nutritional habits like the role of low-glycaemic index
(GI) and low-carbohydrate diets in Chinese patients
with type 2 diabetics has shown that a low-
carbohydrate diet can improve blood glucose more
than a low-fat diet (Wang, 2018). Denova-Gutierrez
et al. report in (Denova-Gutiérrez, 2018) of assessing
the relationship between the dietary inflammatory
index and the prevalence of type 2 diabetes among the
adult population in Mexico City. A total of 1174
participants were involved in this study, and the data
from a semi-quantitative food questionnaire were
used to calculate the dietary inflammatory index
scores for each of the subjects of dietary
Inflammatory Index and Type 2 Diabetes Mellitus in
adults of Mexico City. Sanchez-Rodriguez et al has
demonstrated in (Sanchez-Rodriguez, 2018) that a
Mediterranean diet supplemented with virgin olive oil
may exert beneficial effects in people with
150
Lustenberger, T., Jenzer, H. and Einsele, F.
Building an Integrated Relational Database from Swiss Nutrition’s (menuCH) and Multiple Swiss Health Datasets Acquired from 1992 to 2012 for Data Mining Purposes.
DOI: 10.5220/0010512701500156
In Proceedings of the 10th International Conference on Data Science, Technology and Applications (DATA 2021), pages 150-156
ISBN: 978-989-758-521-0
Copyright
c
2021 by SCITEPRESS – Science and Technology Publications, Lda. All rights reserved

cardiovascular disease in populations who are at high
risk of developing the condition. Klimova and Valis
report in (Klimova, 2018) of different types of
nutritional interventions and their impact in
preventing and delaying cognitive decline in healthy
older adults. Leyvraz et al noted in (Leyvraz, 2018)
that a high intake of salt was a major risk factor in the
development of hypertension and cardiovascular
diseases, and observed that improving the knowledge,
attitudes, and practices in relation to salt intake was a
useful strategy in mitigating the impact of these
chronic diseases. Thus, Leyvraz et al. conducted a
survey involving 588 participants aged 25 to 65 years
in five sub-Saharan African countries, namely Benin,
Guinea, Kenya, Mozambique, and Seychelles.
Sugizaki and Naves evaluated in (Sugizaki, 2018) the
potential prebiotic properties of nuts and edible seeds,
and their relationship to obesity.
Applying data mining techniques and pattern
recognition algorithms to extract nutritional patterns
have been reported by several researchers. A´ine P
Hearty et al. propose in (Hearty, 2008) a coding
system at the meal level that might be analyzed by
using data mining techniques. These researchers used
data from an existing conducted survey. M. Sulaiman
Khan et al. in (Sulaiman, 2008) introduced a
framework for mining market basket data to generate
nutritional patterns (NPs) and a method for analyzing
generated nutritional patterns using Fuzzy
Association Rule Mining. The database used by
Sulaiman Khan et al. was a synthetic grocery basket
database from IBM Almaden (Agarwal,1993). Lydia
Manikonda et al. in (Manikonda, 2011) focused on an
application of mining questionnaires of such kind to
determine the current knowledge of participants and
how this knowledge improved after the training
session. Nikolaos Katsaras et al carried out a study
described in (Kinsey, 2002) using a nationwide
survey of consumer preferences. J. Michael Harris
et al. reported in (Harris, 2002) a study that aimed at
quantifying food expenditures by age groups and
contrast elderly expenditure patterns with other age
groups, test for significant differences between
elderly food-expenditures and younger age groups,
and test for differences in food expenditures between
two elderly age groups (age 65-74 versus age 75 and
over).
To gain understanding about the impact of using
data mining techniques for the analysis of lifestyle
diseases that can be influenced by nutrition, we have
conducted a preliminary study (Einsele, 2015) to
show the proof of our concept. For this purpose, a
publicly on-line available grocery store dataset
(Google, 2009) served as our data source along with
the publicly available health data from the same
region. Recently, we have conducted a consecutive
research study (Mewes, 2021) in which we firstly
have built a real-world integrated database from a
nationwide Swiss survey about nutritional habits
linked with a Swiss nationwide health database from
2012 (Mewes, 2021) and secondly conducted a study
of applying data mining on this database to gain
interesting association rules along with their
interpretation that show the link between nutrition
and chronical diseases. In this paper we present
building an extended database including a vast
amount of Swiss health data from Swiss health
surveys dated from 1992 to 2012 (BAG, 2021) that is
integrated with the Swiss nutritional Survey database
menuCH (BLV, 2021). The concept and Scheme of
this extended database is fundamentally different
with the previous reported database in (Mewes,
2021), which is the reason, why we decided to report
on this database separately it in this article.
2 SELECTED DATASETS
2.1 Swiss Nutrition Database menuCH
The menu-CH National Nutrition Survey (BLV,
2021) is the first to provide representative data on the
food consumption and eating habits of the population
living in Switzerland. National Nutrition Survey
(menu-CH) diet and exercise have a direct impact on
health and quality of life.
From January 2014 to February 2015, around
2000 people from the Swiss resident population were
interviewed. Men and women between the ages of 18
and 75 provided information about their food
consumption and about their cooking, eating and
exercise along with some demographical behaviour.
The survey was conducted as a questionnaire in
the first stage and orally by phone in the second stage.
Three tables resulted from the survey:
The table with the data from the questionnaire
provides information on eating and drinking
and cooking behaviour, as well as intake of
additives and salts, avoided foods and reasons
for avoiding food. Additionally, the survey
provides basic knowledge of healthy eating,
activity patterns, body measurements, weight
satisfaction, diet behaviour, social structure of
the interviewed persons
The table with the data from the oral survey
provides information on the interview and the
interview context; Age and body information;
Food consumed (preparation, category,
Building an Integrated Relational Database from Swiss Nutrition’s (menuCH) and Multiple Swiss Health Datasets Acquired from 1992 to
2012 for Data Mining Purposes
151
nutritional values, amount, and time of taking
the food
The third table contains data on the
demographic classification of the respondents.
Telephone number, year of birth, age group,
gender, relationship status, nationality, country
of birth, household size, residence in the major
Swiss regions
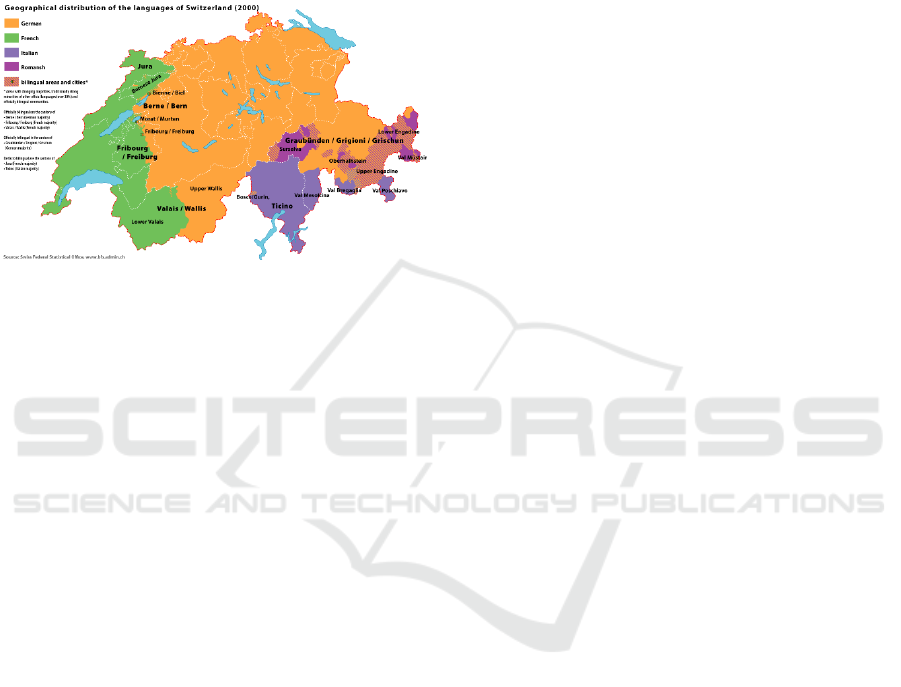
Figure 1: Swiss Demography.
2.2 Lifestyle-Diseases Database
Since 1992, the Swiss Federal Statistical Office has
been collecting health data every five years from the
population living in Switzerland using a written and
telephone questionnaire. As part of this study,
representative data from around 85,000 people from
1992, 1997, 2002, 2007 and 2012 are available (BAG,
2021).
2.3 Demographic Database
As mentioned above, two demographic tables from
the above databases were obtained. The first database
from the database Menu-CH included appx. 2000
individuals and the second one 85000 individuals.
Therefore, a third table as the profile table with the
following categories was built and linked to the two
existing demographic tables to this table.
3 SELECTION, CLEANING,
TRANSFORMATION OF THE
DATASETS
3.1 Selection
The relevant data was identified and selected from the
tables. The positive criteria were freedom from
redundancy, completeness, consistency, and
relevance (for the question). In the database of
nutritional data, 60 table columns were selected from
the oral survey data, and 125 table columns were
selected from the questionnaire data.
3.2 Cleaning
3.2.1 Cleaning menu-CH Database
The menuCH database was largely represented by
codes. menuCH database included occasionally the
same content, which was mapped with two different
codes. This inconsistency was corrected by defining
one coding type and overwriting the second coding
type with the one specified. If there were no data cells,
it was checked whether the data record was still
usable. If not (for example the absence of the Person-
ID), the entire data record was deleted.
3.2.2 Cleaning Health Database
For the issues with the highest link and priority to the
health and nutrition were extracted and reduced to a
table with 9 subject areas: Alcohol consumption, age
problems, disability, cholesterol, chronic diseases,
diabetes, drug use, nutrition, health status. This
allowed the data volume to be massively reduced and
the performance by data processing to be increased.
Redundant data in the tables have been removed as
well as missing data.
3.3 Transformation
3.3.1 menuCH Database
The setup of the menuCH database was done in three
stages. First, a database was created for the database
of the questionnaire. Another database was then
created for the database of the oral survey. A personal
profile was created with the third database (data on
demographic characteristics). The personal profile
has the characteristics age group, gender, household
size, marital status, language. This personal profile
connects the other two menuCH databases. Finally, a
relational database scheme was designed, and
menuCH database was implemented into mySQL.
3.3.2 Health Database
Health data needed some further steps to be finally
transformed. First, the various questions were sorted
out from the selected subject areas and saved in
separate tables. A comparison with the Word files
was necessary for each topic. During this process it
became clear that the number of questions varies
greatly from year to year (1992, 1997,2002, 2007,
DATA 2021 - 10th International Conference on Data Science, Technology and Applications
152
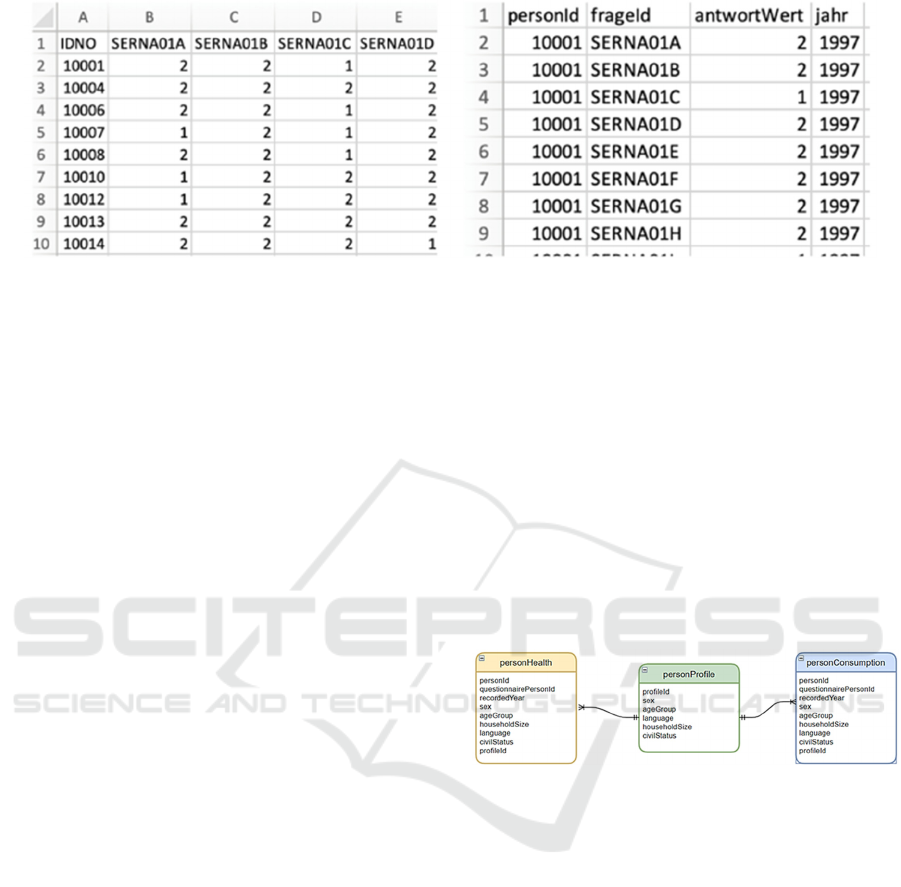
Figure 2: An example of unpivoting.
2012). For the two different types of survey - by
telephone and questionnaire - the questions were also
separated for each topic. This resulted in a total of 49
different Excel tables. Since the questions asked in
prose together with the possible answers were only
available as Word files and this data format is not
suitable for a relational database, the data had to be
brought into a database compatible form. For this
purpose, all questions were copied together with the
associated QuestionID numbers and the survey year
and saved in an Excel file. The same was done with
the answer options and their answer values. In
response to the question "Have you ever used drugs
in your life?" interview participants were able to
answer, for example, “yes”, “no” or “no answer”. The
corresponding answer values was coded as 1, 2 and 9.
Due to the structure of the Word files, this copying
process could not be automated, which is why all
questions and answer options were copied manually.
The structure of the relational database did not
provide for a separation of questions and answers
according to subject area, which is why all telephone
and questionnaire questions as well as answers to all
the selected topics could then be listed in a table and
made available for unpivoting. The Azure Data
Factory was used to unpivot the matrix tables. The
Azure Data Factory is a SaaS service and is available
and usable as part of the Azure Cloud (Microsoft,
2020a). Figure 2 shows an example of our data
unpivoting.
3.3.3 Linking Table for the Integration of
Datasets
For the integration of the nutrition and health
databases, a third person profile table had to be
created, which connects the person profile tables of
the nutrition database and the health database. Six
attributes were selected which were available in both
databases for the personal description:
a) Gender (m / f)
b) age group (15-29 / 30-39 / 40-49 / 50-64 / 65+)
c) Household size (1/2/3/4/5 / 6+)
d) Marital status (single / married or registered /
widowed / divorced / other)
e) Language (de / fr / it)
The selected attributes and their categories
resulted in 720 different categories of people. The
PersonIDs in the Menu-CH database and the
PersonIDs in the Health database were each assigned
to a person category in the PersonProfil table as
shown in Figure 3.
Figure 3: Integrated database design vial linking table.
4 INTEGRATION
A database schema was developed beforehand to
structure the integrated database. When developing
the scheme, it was considered that redundancies and
inconsistencies should be avoided. Fig. 4 shows the
scheme of the integrated database with the personal
profile (colored green) as the central link, the
structure of the health data (yellow) and the
connection to the nutritional data (blue). The database
scheme on the nutritional data side is shown as a black
box (blue), as this scheme was already created in the
previous study (Mewes, 2021). By creating the
database scheme, care was taken to ensure that no
relevant information is lost, but that referential
integrity between the tables is still ensured.
Building an Integrated Relational Database from Swiss Nutrition’s (menuCH) and Multiple Swiss Health Datasets Acquired from 1992 to
2012 for Data Mining Purposes
153
Figure 4: RDB scheme of new health database (1992-2012).
Figure 5: The final version of integrated health & nutrition database.
The final database is structured as follows:
For each subject of the menuCH database, a
combination of two tables is used. One table
contains the subject area with the categor-
ization and the other table represents the
assignment table of person and response to the
topic. In total, 16 tables contain the data from
the menuCH «Questionnaire» database of
which include 8 tables the data from the
menuCH «Nutritional values» database.
6 tables contain the data from multiple
“Health” databases from 1992 to 2012.
Contrary to the menuCH database, the used
categories of chronic diseases (alcohol, age
problems, disabilities, health status, cholester-
ol, chronic diseases, diabetes, drug consum-
DATA 2021 - 10th International Conference on Data Science, Technology and Applications
154

ption, nutrition) are stored in one single table
“chronicdiseasecategory”. Moreover, all
answers of the respondents are stored in one
single table "answeredquestion" and are
connected to the corresponding question in the
survey, to the chosen answer and to the person.
The big advantage of this new structure is, that
the database can simply be extended with
additional topics in the future, without modify-
ing the scheme. This will be enormously
efficient and timesaving if in the future years
the questionnaires are expanded, and more
lifestyle topics are added and evaluated.
Central to the integrated database are the three
person profiles of the data base nutrition the
data base health and the person profile which
connects the two person profiles, as shown in
Fig. 4. Finally, Fig. 5 illustrates the resulted
integrated menuCH and health database from
Switzerland.
5 CONCLUSION AND FUTURE
WORK
The present study aimed at linking data sources of a
nutritional database to demographical and health
statistics come from 5 surveys in a 20 years’ time
frame from 1992 to 2012. The aim of building this
integrated database is twofold: firstly, to address the
influence of food consumption patterns on lifestyle
diseases such as obesity, hypertension, cardio-
vascular diseases, cancer, type 2 diabetes, and mental
disorder. Secondly we aim at comparing the gained
association rules with the previously gained ones
coming from our previous study [19], which was
based on health data from a single Swiss health
survey in 2012 to see the differences of additional
Swiss health data to the integrated database.
According to the World Health Organization (WHO,
2018) “lifestyle diseases are among the main causes
of premature death and disability in industrialized
countries and in most developing countries.
Developing countries are increasingly at risk, as are
the poorer populations in industrialized countries “
For our future work, we intend to use data mining
techniques to discover patterns. Moreover, we intend
to compare the gained patterns and rules with the
gained one from our previous study to see the impact
of adding 4 times more health data to the integrated
database. We aim at extending further the database
first with the new Swiss federal health survey from
2017 and later with the ones of European countries to
receive accurate demographical and health data
which should help us derive interesting and ground-
breaking hidden patterns. Our goal is to find valid
rules to be able to predict and prevent lifestyle
diseases by detecting critical food consumption
patterns. We intend to use association mining
algorithms that will allow us to help reach our goal
without the common limitations of the previous
research efforts, which used the classical statistical
hypothesis-bound methods.
REFERENCES
World Health Organization (2003). Diet, Nutrition and the
prevention of chronic diseases, Report of a joint
WHO/FAO Expert Consultation
World Health Organization (2018). Noncommunicable
Diseases, Paper templates. Accessed on 29 January
2019; 2018 Available online: https://www.who.int/en
/news-room/fact-sheets/detail/noncommunicable-
diseases
World Health Organization (2018), The Top Ten Causes of
Death, accessed on 29 January 2019); 2018 Available
online: https://www.who.int/news-room/fact-sheets/
detail/the-top-10-causes-of-death.
World Health Organization (2018), accessed on 29 January
2019); 2018 Available online: https://www.who.int/
news-room /fact-sheets/detail/diabetes.
Wang L.-L., Wang Q., Hong Y., Ojo O., Jiang Q., Hou Y.-
Y., Huang Y.-H., Wang X.-H. (2018). The Effect of
Low-Carbohydrate Diet on Glycemic Control in
Patients with Type 2 Diabetes Mellitus. In
NUTRITENS 2018;10:661, doi: 10.3390/nu10060661.
Denova-Gutiérrez E., Muñoz-Aguirre P., Shivappa N.,
Hébert J.R., Tolentino-Mayo L., Batis C., Barquera S.
(2008). In NUTRIENTS 2018;10:385, The Diabetes
Mellitus Survey of Mexico City. doi: 10.3390/
nu10040385.
Sanchez-Rodriguez E., Lima-Cabello E., Biel-Glesson S.,
Fernandez-Navarro J.R., Calleja M.A., Roca M.,
Espejo-Calvo J.A., Gil-Extremera B., Soria-Florido M.,
De la Torre R. (2018). Effects of Virgin Olive Oils
Differing in Their Bioactive Compound Contents on
Metabolic Syndrome and Endothelial Functional Risk
Biomarkers in Healthy Adults: A Randomized Double-
Blind Controlled Trial. In NUTRIENTS 2018;10:626.
doi: 10.3390/nu10050626
Klímová B., Vališ M. (2018). Nutritional Interventions as
Beneficial Strategies to Delay Cognitive Decline in
Healthy Older Individuals, In NUTRIENTS
2018;10:905. doi: 10.3390/nu10070905.
Leyvraz M., Mizéhoun-Adissoda C., Houinato D., Moussa
Baldé N., Damasceno A., Viswanathan B., Amyunzu-
Nyamongo M., Owuor J., Chiolero A., Bovet P. (2018).
Food Consumption, Knowledge, Attitudes, and
Practices Related to Salt in Urban Areas in Five Sub-
Building an Integrated Relational Database from Swiss Nutrition’s (menuCH) and Multiple Swiss Health Datasets Acquired from 1992 to
2012 for Data Mining Purposes
155

Saharan African Countries. In NUTRIENTS
2018;10:1028. doi: 10.3390/nu10081028.
Sugizaki C.S.A., Naves M.M.V. (2018). Potential Prebiotic
Properties of Nuts and Edible Seeds and Their
Relationship to Obesity, IN NUTRIENTS
2018;10:1645. doi: 10.3390/nu10111645 Moore, R.,
Lopes, J. (1999).
M. Sulaiman Khan, M. Muyeba, F. Coenen (2008). On
Extraction of Nutritional Patterns (NPS) Using Fuzzy
Association Rule Mining, HealthInf 2008.
R. Agrawal and R. Srikant (1993). IBM Almaden Research
Center, http://www.almaden.ibm.com/cs/projects/iis/
hdb/Projects/data_mining/datasets/data/assoc.gen.tar.Z.
L. Manikonda, R. Mall, V.Pudi and R. Rao (2011). Mining
Nutrition Survey Data, IEEE Symposium on
Computational Intelligence and Data Mining, Paris,
France
J.D. Kinsey, P. Wolfson, N. Katsaras, B. Senauer (2002).
Data mining, A segmentation analysis of US grocery
shoppers. Working paper (University of Minnesota.
Retail Food Industry Center), 01-01.
J. Harris and N. Blisard (2002). Food-consumption patterns
among elderly age groups, The publishing company.
London, 2nd edition, Journal of Food Distribution
Research, 2002
Einsele, F., Sadeghi, L., Ingold, R., Jenzer, H. (2015). A
Study about Discovery of Critical Food Consumption
Patterns Linked with Lifestyle Diseases using Data
Mining Methods. HealthInf, BIOSTEC- International
Joint Conference on Biomedical Eng. Systems and
Technologies, Lisbon.
Mewes, I. Jenzer, H., Einsele, F. (2021). A Study about
Discovery of Critical Food Consumption Patterns
Linked with Lifestyle Diseases for Swiss poulation
using Data Mining Methods, Online HealthInf,
BIOSTEC- International Joint Conference on
Biomedical Eng. Systems and Technologies.
Mewes, I. Jenzer, H., Einsele, F. (2021). Building an
Integrated Relational Database from Swiss Nutrition
National Survey and Swiss Health Datasets for Data
Mining Purposes. In World Academy of Science,
Engineering and Technology, International Journal of
Health and Medical Engineering Vol:15, No:1, 2021.
BAG (2021). https://www.bag.admin.ch/bag/de/home/
zahlen-und-statistiken.html, date: 2/12/2021.
BLV (2021). https://www.blv.admin.ch/blv/de/home/
lebensmittel-und-ernaehrung/ernaehrung/menuch.
html, date: 2/12/2021.
DATA 2021 - 10th International Conference on Data Science, Technology and Applications
156
