
An Approach to Assess the Performance of Mobile Applications:
A Case Study of Multiplatform Development Frameworks
Dany Mota
2
and Ricardo Martinho
1,2 a
1
INESCC, Leiria Branch, ESTG, Polytechnic of Leiria, Leiria, Portugal
2
School of Technology and Management, Polytechnic of Leiria, Leiria, Portugal
Keywords: Multiplatform, Performance, Flutter, React Native, iOS, Android.
Abstract: Comparative studies between software multiplatform development frameworks lack a proper approach that
can be replicated in future performance assessments. Moreover, there is still a deficit in performance
comparison tools. Also, performance comparisons realized between mobile applications developed under
these multiplatform frameworks should be done with applications running in Release Mode, which ends up
not happening in most studies. The objective of this paper is thus to create a whole comparative process as
correct and stable as possible, so that we can use it to safely assess performance of mobile applications
developed with these frameworks. As a case study, we compare the well-known Flutter and React Native
frameworks, and present the obtained results under the proposed approach. With this work, developers can
not only assess both these particular frameworks, but also use the approach for further comparisons.
1 INTRODUCTION
In December 2020, about 99.39% of the mobile
operating system market share was dominated by the
Android (72.48%) and iOS (26.91%) operating
systems (Statista Inc. 2019). To reach this market
share, software development companies can opt by:
1) develop separate mobile applications using native
development. These applications only differ by the
fact that they are intended for different operating
systems; or 2) develop the mobile applications using
only one code base and a multiplatform development
framework, which can then deploy applications for
both operating systems.
The first option (native development) implies a
higher direct cost of software development and
maintenance, since these activities will be done in at
least two different programming languages (Java
and/or Kotlin for Android and Swift and/or
Objective-C for iOS), deriving most likely in two
separate teams, with higher synchronization/agency
costs between them.
For the second option (multiplatform
development), it allows code reutilization and
therefore less development time and cost, near-native
services with access to device hardware and the use
a
https://orcid.org/0000-0003-1157-7510
of technologies that are well-known to developers
(HTML5, Javascript and CSS) (Drifty Co. 2020).
Several studies already compare performance
between different multiplatform development
frameworks (see, e.g., (Biørn-Hansen, Grønli, e
Ghinea 2019; Gonsalves 2018)), using tools and
metrics for different purposes. Other studies can also
be found (as, for instance, in (Saarinen 2019)), which
make a comparison of multiplatform development
frameworks, focused on the execution time of certain
software features. Nevertheless, there is a lack in
literature about the process of realizing these
performance benchmarks, conveying other important
pre- and post-execution procedures and addressing
other performance metrics.
Additionally, the existence of several
multiplatform development frameworks ends up
leaving the development community in doubt about
which framework they should use in their projects.
Another fact is that, until these multiplatform
development frameworks arrive, there was no need
for Android and iOS manufacturers to provide tools
to test the performance of apps developed by non-
native, third party frameworks. Therefore, the
existing tools from these manufacturers still remain
focused on assisting in the development of (native)
150
Mota, D. and Martinho, R.
An Approach to Assess the Performance of Mobile Applications: A Case Study of Multiplatform Development Frameworks.
DOI: 10.5220/0010497401500157
In Proceedings of the 16th International Conference on Evaluation of Novel Approaches to Software Engineering (ENASE 2021), pages 150-157
ISBN: 978-989-758-508-1
Copyright
c
2021 by SCITEPRESS – Science and Technology Publications, Lda. All rights reserved

applications and not for an evaluation of what is and/
or has been developed.
The objective of this paper is, therefore, twofold:
1) to define and create a set of procedures and tests
that can really be implemented to compare the
performance of applications developed through any
(native or non-native) development frameworks;
2) to help developers understand which multiplatform
framework is better suited to the intended objectives
in each application to be developed.
The remainder of this paper is organized as
follows: in the next section we gather related work
regarding performance assessment studies in mobile
applications. In section 3 we propose an approach for
preparing, designing, testing and concluding about
performance assessment in mobile applications.
Section 4 describes our case study and associated test
cases, and in section 5 we present the obtained
performance assessment results, using the proposed
approach. Finally, section 6 concludes the paper and
points out further research directions.
2 RELATED WORK
Using the following search string "cross platform
frameworks" OR "hybrid mobile frameworks" OR
"native mobile frameworks" performance metrics on
the main scientific libraries (ACM, DBLP, IEEE and
Google Scholar), and applying a date filter to show
only the results after 2018, we could obtain 121
publications. From these, 100 were rejected because
they did not fit the theme correctly. Of the remaining
21, we could collect valuable information that helped
in the development of this work, namely:
The testing tools used to assess performance
(see, e.g., Asp Handledare et al. (2017));
The performance metrics considered (see, e.g.,
Eskola (2018));
The kind of features that were tested (see, e.g.,
Scharfstein and Gaurf (2013)).
In order to compose our approach, we considered the
most referenced items within these three types of
collected information. For the kind of mobile app
features that were tested (3
rd
type) we made another
search to find the most downloaded apps in 2019 and
selected some of the most used features.
Our literature review also revealed that there are
no “best” multiplatform development frameworks,
but some can be best suited to a given situation,
depending on the purpose and requirements of the
intended mobile application. Additionally, the
evaluation of the performance of a mobile application
is a complex process, which can easily be discussed.
For instance, one of the evaluation steps that we
found to be critical is to assure that applications are
running in Release Mode when executing
performance tests ; or, alternatively, in a mode
dedicated to the evaluation of applications (if
available) (Apple Inc. 2015; Lockwood 2013).
3 EVALUATION PROCESS
PROPOSAL
Our evaluation process began by first identifying
related works that already existed regarding mobile
app performance assessment. Then, multiple mobile
application development frameworks were evaluated
to be used in the course of this performance
assessment. With the frameworks selected, before
proceeding, we analysed the possibilities for carrying
out their evaluation. Therefore, the tools available for
this purpose were studied. We then proceeded to a
more practical part: the identification and
implementation of mobile app software features that
could be an asset in the comparison and evaluation of
the development frameworks. Then, the design and
development of the testing process was one of the
most important points, taking into account that it was
where most of the related works analysed showed
failures. Finally, the process ended by executing all
the designed specific tests, performing a statistical
evaluation on the results obtained and providing some
discussion on these.
3.1 Release Mode
The term “Release Mode” was mentioned in an
official Apple lecture (Apple Inc. 2015) when
describing their performance analyser tool known as
Instruments. From here, and due to the lack of other
works considering this issue, as well as the
inconsistency of tools and metrics that were used, we
incorporated the need of having this executable mode
either in the proposed approach and in the tools used
to assess mobile application performance.
3.2 Frameworks Selection
Bearing in mind that the defined objective involves
the comparison of applications developed using
distinct frameworks, we also tried to compare
multiplatform frameworks that have a larger market
share among the developers community today. In this
way, the selection of the frameworks was based on
An Approach to Assess the Performance of Mobile Applications: A Case Study of Multiplatform Development Frameworks
151

the most studied in the analysed publications in
conjunction with the values of each official GitHub
pages.
These criteria led to the selection of the 2 well-
known multiplatform frameworks: one created by
Facebook named React Native; and another that
belongs to Google named Flutter.
3.3 Metrics and Feasibility of
Measurement Tools
Due to the existence of a significant diversity of
metrics and tools for benchmarking found in previous
studies, we had to filter them according to some
criteria. First, in relation to the metrics, the most
found in the studies were selected, more precisely,
those that occurred more than 5 times, namely:
CPU usage;
RAM usage;
Execution Time;
Frames per second.
Regarding testing/performance evaluation tools, it
was defined that only official testing tools of the
platforms / operating systems (Android OS and iOS)
would be used. Then, we checked if they were
compatible with the “Release Mode”. These criteria
were sufficient to reduce the number of tools
available.
For the iOS system the tool selected is
Instruments, which is integrated with the official IDE,
XCode. On the Android system, we selected the
Systrace tool and the bash command top, originally
integrated on Linux based systems, in this case the
Android OS. However, it was still necessary to
complement the tools in Android through scripts, due
to limitations that these presented. We created three
scripts for this matter: two bash-based and another
using JavaScript (and NodeJS). These scripts were
named like:
Profile Extraction;
Profile Top;
Profile Transformation.
The Profile Extraction script is the largest, and
controls all the process tests and the execution of the
other two scripts with the rest of the necessary testing
tools. It starts by checking which framework project
is on the directory and automatically finding the
Android device. After that, it makes sure that the
application is not installed on the mobile device (by
uninstalling it). Then, it restarts the device and
executes the official approach of each framework to
compile the release mode of the feature to be tested.
Right after, the script runs the Profile Top script and
the Systrace tool. Ending the test all opened tools are
closed and all collected data saved in an organised
structure, to be consumed by the last script Profile
Transformation.
After all this steps, one of the ten iterations of the
test is completed, and the script Profile Extraction
will automatically repeat the process ten times.
Profile Top is a script used to save the values
resulting from the top command, since the execution
of this command takes a few seconds. The script is
then responsible to execute ten times this command
in parallel with a small-time interval to make sure that
during the test a larger number of samples is obtained.
Profile Transformation is the last script to be used,
and it checks all structure of data registered, merges
all iterations with all transformations and necessary
calculations to save the data in tables to an easy
human preview.
3.4 Features
In order to make a more comprehensive assessment,
a search of the most used applications in 2019 was
carried out to understand which features are most in
need of evaluation. The keywords “most used apps
2019” were applied to this search, filtered by the
results of the last month. As a result of this search,
several sites were consulted, where a common
referenced source was found: APP ANNIE
(Venkatraman 2019).
According to this source, the most downloaded
applications during 2019 were:
1. Facebook Messenger;
2. Facebook;
3. WhatsApp Messenger;
4. TikTok;
5. Instagram.
With the result of this search, we defined five
(mini) sample mobile applications (one per feature),
in order to understand which are the most common
features that can be targeted for testing. After the
sample applications were selected, an analysis
process was initiated to meet the most frequent
features they contained.
After analysing the various applications, nine
features were selected to be reproduced and tested.
These features are:
Launch – feature that launches any mobile
application;
Lists – feature representing most of the content
in any of the model applications. From lists,
two distinct features originate: one directed to
remote content lists and another to local content
lists;
ENASE 2021 - 16th International Conference on Evaluation of Novel Approaches to Software Engineering
152

Camera – taking into account that all model
applications are applications of social variation
and communication, all of them make it
possible to capture images, both through
photographs and videos. In this way, we have
two related features: 1) image; and 2) video
capture;
Access to local multimedia content – for the
same purpose of accessing the camera, users of
model applications can choose to share media
content that they have previously purchased.
Thus, we are facing two more features: 1)
images; and 2) videos access on the devices;
Access to remote multimedia content – model
application users are constantly consuming
remote media content. Thus, another feature
results as the reproduction of remote accessing
media content;
Animations – all model applications feature
various animations, whether in navigation or in
content interaction. Animations are present in
order to make the use of the application a better
experience. In this way, rendering animations
was also selected as feature to be tested.
3.5 Testing Setup and Development
The development of the testing process required a
significant effort and rigor, considering that all the
values should subsequently analysed and translated
into conclusions. In this process, one of the crucial
points was the execution mode in which the
applications must be to be properly tested, in this case
the release mode. After ensuring this mode, the test
environment was prepared.
In the testing environment, we chose specific
devices for each operating system and ensured that
they would not be obstructed by any other
applications or communications during testing. In the
case of features that need remote content, we created
a mock server exclusively to reply to the requirements
of this features and both parts, server and
smartphones were connected to a 5G Local Area
Network.
3.6 Tests and Evaluation
During the tests, in order for the entire assessment to
be as reliable as possible, two important procedures
were defined. The first procedure concerns the way
the test is performed. Each test consists of a set of
steps to obtain the results, namely: 1) removing a pre-
installation of the application, if it exists on the
device; 2) restarting the mobile device, so that any
information about the application in RAM memory is
discarded; 3) installing the sample application by the
framework itself in release mode; and finally 4)
running the appropriate test.
The second procedure refers to the number of
iterations for each test and for each sample application,
in order to normalize the results. We defined that each
test would run ten times, exactly the same number that
Apple uses in the automated written tests.
After the tests were performed, coloured tables
were used to provide a more intuitive and easier
analysis. The evaluation is made for each application
that is created within each selected functionality,
through the consumptions that were registered in each
operating system and each technology. In this process,
points are also assigned to each technology, according
to the metrics in which they have the best results.
3.7 Result Normalization and
Presentation
To conclude a comparative performance assessment
between mobile applications developed under
different frameworks, the points that were used
during the evaluation were assigned to each
framework. Using these points and a leverage system
resulting from the division between the registered
values of each framework, a less detailed analysis was
obtained to make a more evident and accessible
comparison.
These final results are also presented in coloured
tables, both from the perspective of the features of the
sample applications developed, and of the metrics.
These two perspectives have produced diverse results
also with regard to the operating system and the
development framework.
4 APPLICATIONS AND TEST
CASES
In this chapter, the applications created (one for each
framework to be compared) will be addressed, in
response to the features previously identified, to be
tested and evaluated. This chapter also discusses the
procedure in which each application was tested.
In the case of applications that were created with
the aim of simulating real functionalities, most of
these would require user interaction to make use of
their purpose. However, this interaction could
jeopardize the impartiality of the results. In this way,
a solution was found that was compatible with both
Android OS and iOS operating systems, in order to
An Approach to Assess the Performance of Mobile Applications: A Case Study of Multiplatform Development Frameworks
153
make the testing process free from human
interactions. After the analysis of several automation
tools, it was concluded that they had several
limitations, such as, for example, not supporting the
testing of applications in release mode, or the need to
install additional applications on mobile devices,
being unknown the interference they could have in
the results.
In addition to this, there was another factor that
prevented the use of these automation tools: their
need to start the applications under testing, and this
procedure goes against the process of executing the
Instruments tool.
Without the possibility of implementing
automated tests, it was decided to create automation
procedures integrated directly into the applications,
modelling some of the tests and reducing human
interaction whenever possible.
The testing procedure was the same for both
applications developed for Android OS and iOS.
However, in certain cases, due to the limitations of
the tools and / or some technologies as mentioned
above, some tests were adapted to each platform,
respecting the impartiality between the different
platforms and frameworks so that, later on, the
evaluations were also reliable.
In an attempt to perceive possible different
consumption peaks on the platforms, certain
applications were strategically created with waiting
bars, so that the identification of these peaks was
facilitated in a later analysis.
Bearing in mind that the frameworks being
studied are dedicated to the creation of an application
for two different operating systems, of each identified
and studied feature, four distinct applications were
delevoped, two for each framework.
However, there are some special cases regarding
the features developed. For the “lists” feature, we
tested lists with remote and local content and with
different variations of the number of elements (10, 50
and 100 elements).
Since nine unique features are being studied and,
in some of them, several variations of them are
created, a total of 52 sample mobile applications are
obtained, 26 of which are directed to the iOS
operating system and the others to the Android
operating system.
5 RESULTS
During the evaluation of the applications created for
each feature, results were scored using points. A less
detailed view of the performance of the frameworks
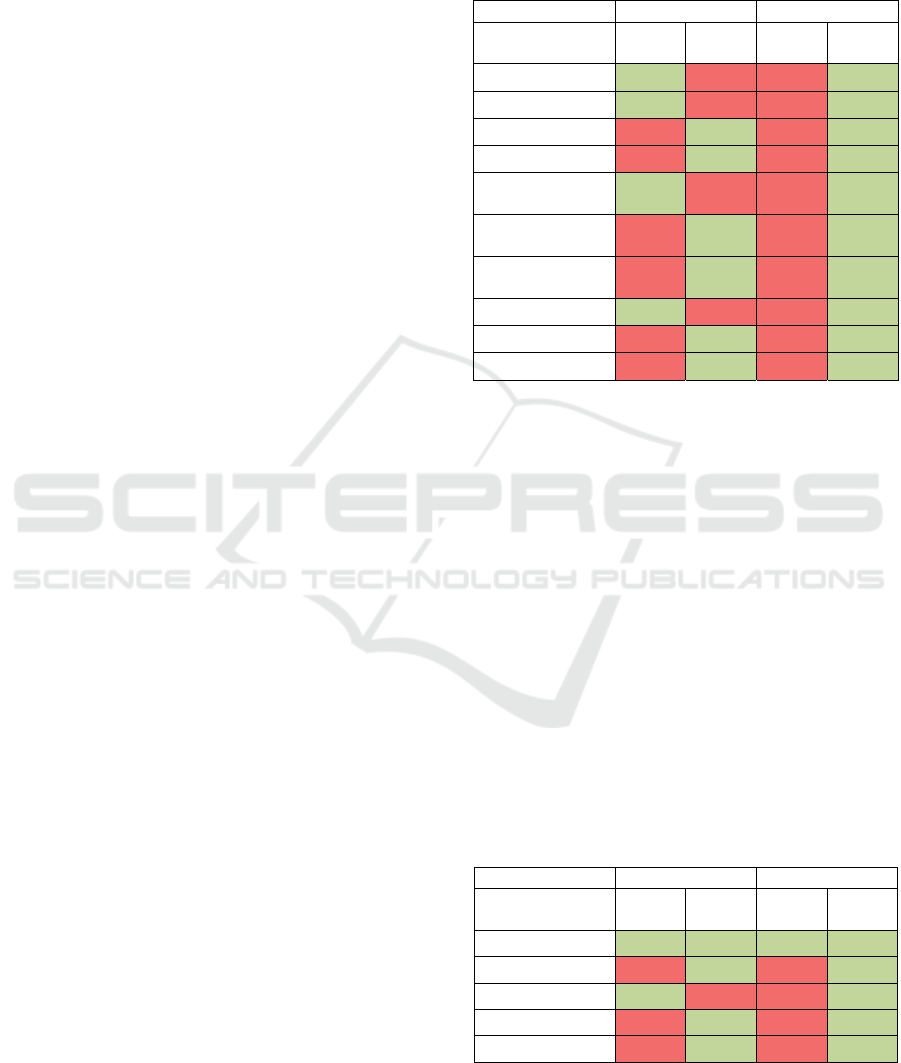
using these points is presented in Table 1.
Table 1: Points by operating system, framework and
feature.
iOS Androi
d
Features
React
Native
Flutter
React
Native
Flutter
Launch 2 1 2 3
Local Lists 9 6 3 15
Remote Lists 3 12 8 10
Take Photos 0 4 0 5
Record of
Videos
4 0 1 4
Access to
Ima
g
es
0 4 0 5
Access to
Videos
0 4 1 4
Streaming 3 2 2 3
Animations 2 3 0 6
Total 23 36 17 55
As shown in Table 1, which uses the same colour
scheme used previously to assist in the perception of
results, Flutter is the framework that presents the best
results in both operating systems, about 157% better
in iOS and more than 3 times on Android OS. In the
latter, all metrics are dominated by Flutter. However,
on the iOS side, we have React Native which,
although with fewer points, stands out with an
advantage in 4 of the 9 features.
Performing an analysis but from the perspective
of the metrics (Table 2), in terms of execution times,
both frameworks present the same score, regardless
of the operating system. Regarding iOS, it is visible
that React Native is better when it comes to RAM
consumption. However, if we compare values in
Android OS, Flutter has better performance in all
metrics, excluding the execution time which, as
already discussed, has an equivalent performance.
Table 2: Points by operating system, framework and metric.
iOS Androi
d
Metrics
React
Native
Flutter
React
Native
Flutter
Execution Time 4 4 4 4
CPU 2 11 10 16
RAM 10 3 3 23
FPS 7 18 0 12
Total 23 36 17 55
Analysing global results, without distinguishing
between operating systems, we obtain the perspective
ENASE 2021 - 16th International Conference on Evaluation of Novel Approaches to Software Engineering
154
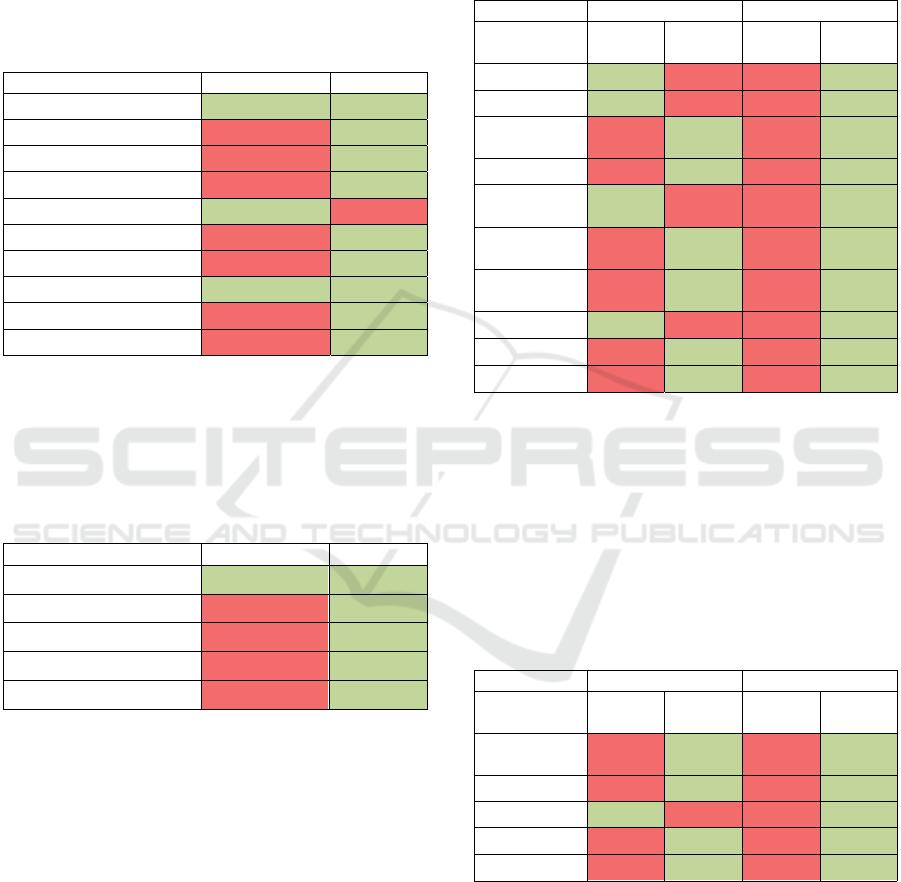
of values presented in Table 3. Here we can observe
the values of each framework and also conclude that
Flutter is the one that presents the best global results
in eight of the nine features considered. React Native
only has a small advantage in capturing videos,
having an equivalent level in launch and streaming.
In total, Flutter achieves precisely twice as much as
points obtained by React Native.
Table 3: Points by framework and feature.
Features React Native Flutte
r
Launch 4 4
Local Lists 12 21
Remote Lists 11 22
Take Photos 0 9
Record of Videos 5 4
Access to Images 0 9
Access to Videos 1 8
Streaming 5 5
Animations 2 9
Total 40 91
Through Table 4, also from the same point of
view, but in relation to the metrics, React Native only
obtains an equivalent performance regarding
execution times, while all other metrics are largely
dominated by Flutter.
Table 4: Points by framework and metric.
Metrics
React Native
Flutte
r
Execution Time 8 8
CPU 12 27
RAM 13 26
FPS 7 30
Total 40 91
In order to make an even more impartial
comparison, the score obtained by the frameworks
was normalised by dividing the highest value
obtained in the metric by the lowest. In cases where
the lowest value is zero, the difference between them
was considered. In this way, the score obtained will
more accurately reflect the real difference between
frameworks and operating systems.
Table 5 shows leveraged scores obtained by
operating system and framework. Through this
representation it is noticeable that the difference
between the technologies in the iOS operating system
is less than that analysed above by points without
leverage. React Native goes from about 64% of
Flutter points to about 90% on the iOS system.
However, in the Android OS operating system, the
difference between the frameworks intensified, thus
changing React Native from about 31% of Flutter's
points to approximately only 6%.
Table 5: Leveraged Points by operating system, framework
and feature.
iOS Androi
d
Features
React
Native
Flutter
React
Native
Flutter
Launch 3,50 1,05 3,60 4,09
Local Lists 21,62 11,40 8,68 85,12
Remote
Lists
15,36 20,52 10,08 116,80
Take Photos 0,00 9,70 0,00 7,49
Record of
Videos
4,61 0,00 1,42 7,55
Access to
Images
0,00 4,63 0,00 7,91
Access to
Videos
0,00 4,51 1,61 10,49
Streaming 11,44 3,03 2,93 65,14
Animations 3,54 11,76 0,00 164,63
Total 60,07 66,60 28,32 469,22
Performing the analysis by metric, using Table 6,
although React Native has worse performance in all
metrics excluding one, this one shows to be
significantly better in the management of RAM
memory in the iOS operating system. Still, Flutter
also has a great advantage not only in the
management of RAM memory but also in the FPS of
the Android OS operating system.
Table 6: Leveraged Points by operating system, framework
and metric.
iOS Androi
d
Metrics
React
Native
Flutter
React
Native
Flutter
Execution
Time
11,45 13,92 10,04 16,84
CPU 2,09 15,94 14,45 25,64
RAM 38,98 8,18 3,83 25,51
FPS 7,54 28,56 0,00 401,24
Total 60,07 66,60 28,32 469,22
By comparing the values in the developed
applications excluding the division by operating
systems (Table 7), the only feature in which React
Native shows to dominate with better performance is
the launch of applications. With an average
performance of more than six times higher, Flutter
once again reinforces its dominance in multiplatform
development compared to React Native.
An Approach to Assess the Performance of Mobile Applications: A Case Study of Multiplatform Development Frameworks
155
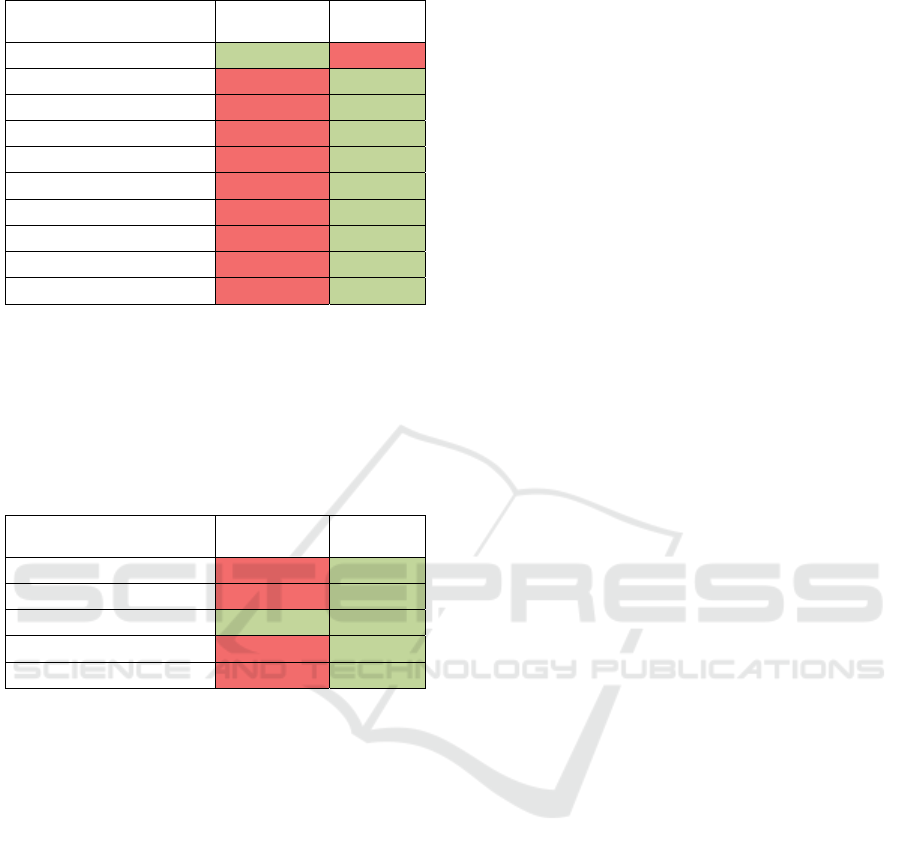
Table 7: Leveraged Points by framework and feature.
Features
React
Native
Flutter
Launch 7,11 5,15
Local Lists 30,30 96,52
Remote Lists 25,44 137,31
Take Photos 0,00 17,19
Record of Videos 6,03 7,55
Access to Images 0,00 12,54
Access to Videos 1,61 15,00
Streaming 14,37 68,17
Animations 3,54 176,39
Total 88,39 535,82
Excluding operating systems, for a more direct
comparison of frameworks at the level of metrics
(Table 8), it is clear that React Native's strong point
in relation to Flutter is RAM management for the iOS
operating system. Apart from this metric, Flutter has
a marked advantage over React Native.
Table 8: Leveraged Points by framework and feature.
Metrics
React
Native
Flutter
Execution Time 21,50 30,76
CPU 16,55 41,57
RAM 42,80 33,69
FPS 7,54 429,79
Total 88,39 535,82
6 DISCUSSION
The assorted studies existing in relation to evaluations
of technological alternatives available on the market
for the development of mobile applications showed
some inconsistencies in the procedures carried out,
including studies that did not refer to the process that
was used or the importance of several details such as,
for example, the Release Mode or equivalent in the
applications to be evaluated.
This situation reinforced the idea that there was a
need to propose an approach, in order to assist all
organizations that have to decide about the
development framework to adopt for their mobile
software applications.
In the course of this work, we did not expect that
one of the biggest challenges would be related to the
tools used to test the performance of mobile
applications. To tackle this, we decided to use several
tools of greater complexity and to create scripts
applicable to testing the various features in question.
Thus, an approach for automating tests and recording
evaluation metrics was proposed, combined with the
official testing tools of the manufacturers of the
Android OS and iOS operating systems.
7 CONCLUSION
The comparison between the React Native and Flutter
frameworks was performed and analysed through the
entire approach defined in the course of this work, as
a case study.
From the comparison between these two
frameworks, it can be concluded that, for the most
part, Flutter is the best solution for the selected
features, and regardless of the operating system
targeted by the smartphone (iOS or Android OS).
However, the comparison between the frameworks
was carried out to cover a wider range of views and
requirements. Thus, depending on the objective of
those who are analysing these results, conclusions for
a greater number of scenarios can be easily drawn.
Bearing in mind that the smartphone market is
dominated by the Android OS operating system and
assuming that the purpose of the application to be
developed is to have the best performance in this
operating system, there is no doubt that Flutter is
really a good alternative for applications that bring
together a set of features similar to those developed
and analysed.
Still, if the goal is mostly Apple's operating
system, iOS, there are already several features in
which React Native stands out, turning out to be a
good alternative. Examples include launching
applications, applications involving local storage and
lists, capturing video content and even consuming
streaming content. From the metrics point of view,
React Native also proves to be a good alternative for
an economical application in terms of RAM,
especially in the case of the iOS operating system.
After analysing all the values, a conclusion that
can also be derived is that, if the goal is to develop an
application without major visual effects for the iOS
operating system, React Native is the best solution,
especially if the application involves local SQLite
storage. In the case of an application that involves
better visual effects, this is one of Flutter's strengths,
both in terms of performance and of ease of
implementation, ending up with an application that
obtains good consumption in general, in both
operating systems.
ENASE 2021 - 16th International Conference on Evaluation of Novel Approaches to Software Engineering
156

8 FUTURE WORK
Future perspectives of this work will be focused on
improving the testing approach proposed, as well as
developing a solution that is as automated as possible.
The aim is to develop a tool, based on the official ones
and also those we developed, that will become a
reference in the mobile application performance
evaluation market.
Thus, we intend to take the scripting tool created
to a more mature application, available for any
computer, without the need of creating an entire
complex test environment, as reported in this work.
The intended application will have several levels
of use, aimed at both developers who want to evaluate
the applications they produce, as well as other entities
with less in-depth knowledge of programming. An
entire automatic process of merging several features
already implemented in multiple frameworks will
also be incorporated. This aspect will allow any
entity, even without having any knowledge of the
technologies to be compared and even without any
programming concepts, to be able to make a
comparison in a much easier way.
REFERENCES
Apple Inc. «Profiling in Depth - WWDC 2015 -Videos -
Apple Developer». https://developer.apple.com/videos/
play/wwdc2015/412/ (23 September 2020).
Asp Handledare, Filip, Arunkumar Palanisamy, Oskar
Karlsson Examinator, and Kristian Sandahl. 2017. «A
comparison of Ionic 2 versus React Native and Android
in terms of performance, by comparing the performance
of applications».
Biørn-Hansen, Andreas, Tor Morten Grønli, and
Gheorghita Ghinea. 2019. «Animations in cross-
platform mobile applications: An evaluation of tools,
metrics and performance». Sensors (Switzerland)
19(9): 2081-.
Drifty Co. 2020. «Cross-Platform Mobile App
Development». https://ionicframework.com/ (23
September 2020).
Eskola, Rasmus. 2018. «React Native Performance
Evaluation».
Gonsalves, Michael. 2018. «Evaluating the Mobile
Development Frameworks Apache Cordova and Flutter
and Their Impact on the Development Process and
Application Characteristics».
Lockwood, Nick. 2013. iOS Core Animation: Advanced
Techniques.
Saarinen, Jarkko. 2019. «Evaluating Cross-Platform
Mobile App Performance With Video-Based Faculty of
Information Technology and Communication
Sciences».
Scharfstein, M, and Gaurf. 2013. «OTT Video-Oriented
Mobile Applications Development Using Cross-
Platform UI Frameworks». Journal of Chemical
Information and Modeling 53(9): 1689–99.
Statista Inc. 2019. «Mobile OS market share 2018».
Statista. https://www.statista.com/statistics/266136/
global-market-share-held-by-smartphone-operating-
systems/ (23 September 2020).
Venkatraman, Adithya. 2019. «A successful finale to the
decade: mobile highlights of 2019». App Annie Blog.
https://www.appannie.com/en/insights/market-data/a-
successful-finale-to-the-decade-mobile-highlights-of-
2019/ (24 September 2020).
An Approach to Assess the Performance of Mobile Applications: A Case Study of Multiplatform Development Frameworks
157
