
MMR: Multiple Majority Rule Model with Bias
Sancho Rodriguez Corrales, Edwin Armas, Martin King, Joshua Moorehead,
Omar Abou Nassif Mourad and Salem Othman
Wentworth Institute of Technology, 550 Huntington Ave, Boston, MA, U.S.A.
othmans1@wit.edu
Keywords: Bias, Majority Rule Model, Opinion, Opinion Dynamics.
Abstract: The Galam Majority Rule model describes how an opinion can spread in a network of nodes with no pre-
existing edges. The model is used to describe opposing opinions that are represented in two states (Susceptible
or Infected). This paper introduces a Multiple Majority Rule model (MMR) that improves the cons
surrounding the Galam Majority Rule model by allowing opinion bias and adding a third state (undecided).
The paper presents a comparative study between both models’ behavior and performance. Lastly, the paper
analyzes the impact of the bias in the consensus of a majority.
1 INTRODUCTION
In the last few decades, opinion dynamics models
have been developed to model the spread of opinion
in a population. People’s opinion can change based
on those they interact with. The Galam Majority Rule
model does not consider social constructs that make
people biased to what they believe (Rossetti, 2017).
Furthermore, it represents a two-state system where
every node in the population has an initial state:
Susceptible and Infected. This model gives a clear
advantage to the infected state skewing results
towards an infected majority.
Our Multiple Majority Rule model (MMR) can be
used as a two-state system: Adopter and Rejector, and
as a three-state system: Adopter, Rejector, and
Undecided which classifies a population that has not
formed an opinion yet. Unlike the Galam Majority
Rule model, the MMR model includes a modifiable
opinion bias which considers the impact of social
constructs on opinion dynamics. While a population
may have two equal majorities, the bias can be
adjusted so that one population has a higher
probability of becoming prominent.
An experimental analysis has been carried out
with the MMR model, to understand the effect of the
bias. We analyze how changing the bias parameter
will impact reaching a consensus and its effectiveness
in comparison to the inherent bias used in the Galam
Majority Rule model.
The paper is organized as follows: In Section 2,
we go through the Galam Majority Rule model, how
it works, and the cons that come with the model. In
Section 3, we go through the MMR model, how it
works, and its cons. Section 4 analyzes the differences
between the Galam and MMR model. Section 5
covers the results of how the bias influences the
outcome of the MMR model. Section 6 discusses
related work. Finally, in Section 7 we conclude the
paper, underlying the advantages of the MMR model,
and further work that can be done.
2 THE GALAM MAJORITY
RULE MODEL
Model States: The Galam model is composed of
nodes existing in one of two states, susceptible and
infected. Each state represents a definitive opinion
with one in support of the opinion and the other
against it.
Model Parameters: This model has three key
parameters which are Fraction Infected, Q-group, and
Iterations.
Fraction Infected: This parameter represents the
percentage of nodes that start as infected. Its value is
between zero and one, where zero means the whole
population is susceptible and one means the entire
population is infected.
Q-group: It represents a group of people of size Q,
which is a value from one to the maximum number of
Corrales, S., Armas, E., King, M., Moorehead, J., Mourad, O. and Othman, S.
MMR: Multiple Majority Rule Model with Bias.
DOI: 10.5220/0010475802070214
In Proceedings of the 11th International Conference on Simulation and Modeling Methodologies, Technologies and Applications (SIMULTECH 2021), pages 207-214
ISBN: 978-989-758-528-9
Copyright
c
2021 by SCITEPRESS – Science and Technology Publications, Lda. All rights reserved
207
nodes, where one means there is one person in the Q-
group and the maximum number of nodes means the
Q-group is equal to the total population. Regardless
of size, all nodes in the Q-group are fully connected.
After each iteration, the model adds up the total
number of susceptible and infected nodes within the
Q-group. Whichever state holds the most nodes
becomes the majority, updating the Q-group state to
the majority. If there is a tie in the Q-group, then the
Q-group defaults to infected.
Iterations: It determines the number of times a Q-
group is selected.
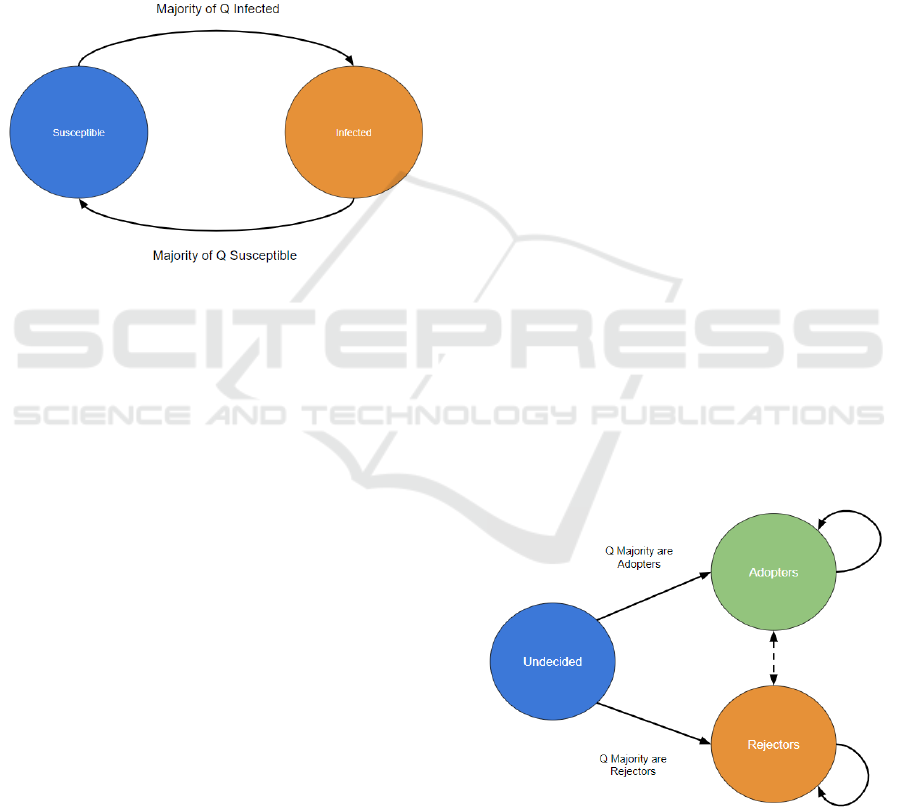
Figure 1: Diagram of the possible states and their
relationship for the Galam Majority Rule model. Nodes can
change from susceptible to infected and from infected back
to susceptible. The status of the nodes depends on the
majority status of the selected nodes for the Q-group.
2.1 Drawbacks with the Galam
Majority Rule Model
The Galam Majority Rule model is meant to model
the change in people’s opinions by using two states.
They found that the consensus for the nodes generally
tends towards whichever state had the majority in the
beginning (Krapivsky, 1). In real life, opinions that
start as a minority initially can become the majority
in the end. This model does not take into
consideration social biases that might influence the
decision making of the population. The algorithm
used by NDLib to compute the majority is biased
towards the infected status in every instance where
there is a tie, which results in a skewed experiment
when the size of the Q-group is even (Rossetti, 2017).
3 MULTIPLE MAJORITY RULE
MODEL (MMR)
Model States: Depending on the configuration, the
model can have up to three states. Undecided, people
who have yet to develop an opinion. Adopters and
Rejectors, which are those states that reflect the
people who have a predetermined opinion on a given
topic.
Model Parameters: This model has five key
parameters which are Fraction Adopter, Fraction
Rejector, Q-group, Iterations, and Bias.
Fraction Adopter: This parameter represents the
percentage of nodes that start as adopters. Its value is
between zero and one.
Fraction Rejector: This parameter represents the
percentage of nodes that start as rejectors. Its value is
between zero and one.
Q-group: Same functionality as in the Galam
Majority Rule Model but If there is a tie in the Q-
group, then the Q-group uses the bias parameter to
determine the majority.
Iterations: It determines the number of times a Q-
group is selected.
Bias: Given the case where a Q-group contains two
equal majorities, the bias value represents the
probability that the Q-group will change their opinion
to the adopter state. This value should only be set
inclusively between zero and one. When the bias
value is zero, the probability that the adopters are
selected as the majority in the Q-group is 0%. If the
bias value is one, the probability that the rejectors are
selected as the majority is 0%.
If the sum of Fraction Adopter and Fraction
Rejector is one, the MMR model behaves as a two-
state system. However, if the sum of these two
parameters does not sum to 1, the difference between
the sum and one represents the undecided population,
which models a three-state system.
Figure 2: Diagram of the possible states and their
relationship for the MMR model. If a node is undecided, it
can only go to the adopter or rejector state. If a node is either
an adopter or a rejector, it can be swayed to the opposite
state or stay at its current state depending on the Q-group
majority.
SIMULTECH 2021 - 11th International Conference on Simulation and Modeling Methodologies, Technologies and Applications
208

4 ANALYZING DIFFERENCE
BETWEEN GALAM AND MMR
MODEL
In this section, we tested the behavior of both models
using different cases to compare the reliability of their
results. The first subsection (A) discusses how each
model behaves when a tie occurs. In subsection (B),
we test the MMR model as a two-state system against
the Galam Majority Rule model. Lastly, in subsection
(C), we analyze the behavior of the MMR model as a
three-state system.
4.1 The Case of a Tie
The Galam Majority Rule model produces a skewed
result when the Q-group size is even. For Q-groups
that have an even number, there is the possibility of a
draw between both populations. A tie can only occur
if the Q-group is even. In the event of a tie, the Galam
Majority Rule model defaults the infected state to the
majority. This clearly shows that the model design is
skewed against the susceptible state. Table 1 &
Figure 3 below show the probability of the susceptible
state becoming the majority using different even
numbers for the size of the Q-group initializing both
populations at 50%.
Given a two-state system, like the Galam Majority
Rule model, using a Q-group size of 2, there are 3
possible outcomes in the Q-group. Two susceptible
nodes, one susceptible and one infected, or two
infected nodes. From this information, we can deduce
that the probability of the susceptible becoming the
majority in an iteration is one-third. The results in
Table 1 show the probability of the susceptible
population becoming the majority in a total of 400
iterations. The number of iterations selected was the
average number of iterations needed to reach a clear
Table 1: Probability of a Susceptible Majority with an even
q-Group.
Q-group size
Probability of Susceptible
Ma
j
orit
y
2 < 0.00001
4 0.00002123787
8 0.011234105
16 0.109768941
32 0.25510399
64 0.36009636
128 0.418360442
256 0.449851167
512 0.4641378
1024 0.472096004
Figure 3: Plot showing how changing the size of the Q-
group using even terms affects the probability that the
susceptible state will become the majority.
majority. Hence, this is the reason we used 400
iterations to calculate the probability of a susceptible
majority.
Table 1 shows that when the size of the Q-group is
an even number such as 2, the susceptible population
has a significantly less than 1% chance of becoming
the majority. Given an even number, the plot shows
that, as the size of the Q-group approaches infinity,
the probability of the susceptible state winning
approaches 50%. This means that the Galam
Majority Rule model results in a very skewed
experiment when the Q-group consists of a small even
number of nodes. However, the experiment becomes
less skewed as you increase the size of the Q-group.
For example, when the size of the Q-group is 1024 the
susceptible population has a 47% chance of becoming
the prevalent majority.
Although the experiment becomes more balanced
as the Q-group increases in size, the simulation also
becomes unrealistic. It is assumed that every person
in a Q-group interacts with everyone else in the same
Q-group simultaneously. Using a large Q-group size
such as 500 would mean each node is connected to
the other 499 nodes in the Q-group. To assume that
every node share 499 common connections is
unrealistic.
lim
→
1−
𝑄
2
+1
𝑄+1
=
1
2
(1)
Q is the value assigned to the size of the Q-group.
Equation (1) is used to calculate the probability of the
susceptible state becoming the majority in a single
iteration. Using limits, as the size of the Q-group
reaches infinity, this probability of susceptible
-0,1
0
0,1
0,2
0,3
0,4
0,5
0 500 1000 1500
Probability of Susceptible Majority
Q-group Size
Galam Majority Rule
MMR: Multiple Majority Rule Model with Bias
209
majority approaches one-half.
We used (1) to calculate the probability of the
susceptible state becoming the majority in a single
iteration. To compute the probability of the
susceptible state becoming the majority after the total
number of iterations, we calculated the cumulative
binomial probability, where the probability of success
in a single iteration was the value coming from (1).
Now let us measure the probability of the
susceptible state becoming the majority after the total
number of iterations instead of a single iteration.
400
𝑘
0.4
0.6
(2)
k is the number of successful iterations for susceptible
majority. To find out the probability of the susceptible
state becoming the majority after the total number of
iterations, we used the cumulative binomial
probability function (2). The probability of success on
a single trial is 0.40. The number of trials equals the
number of iterations, which we set to 400.
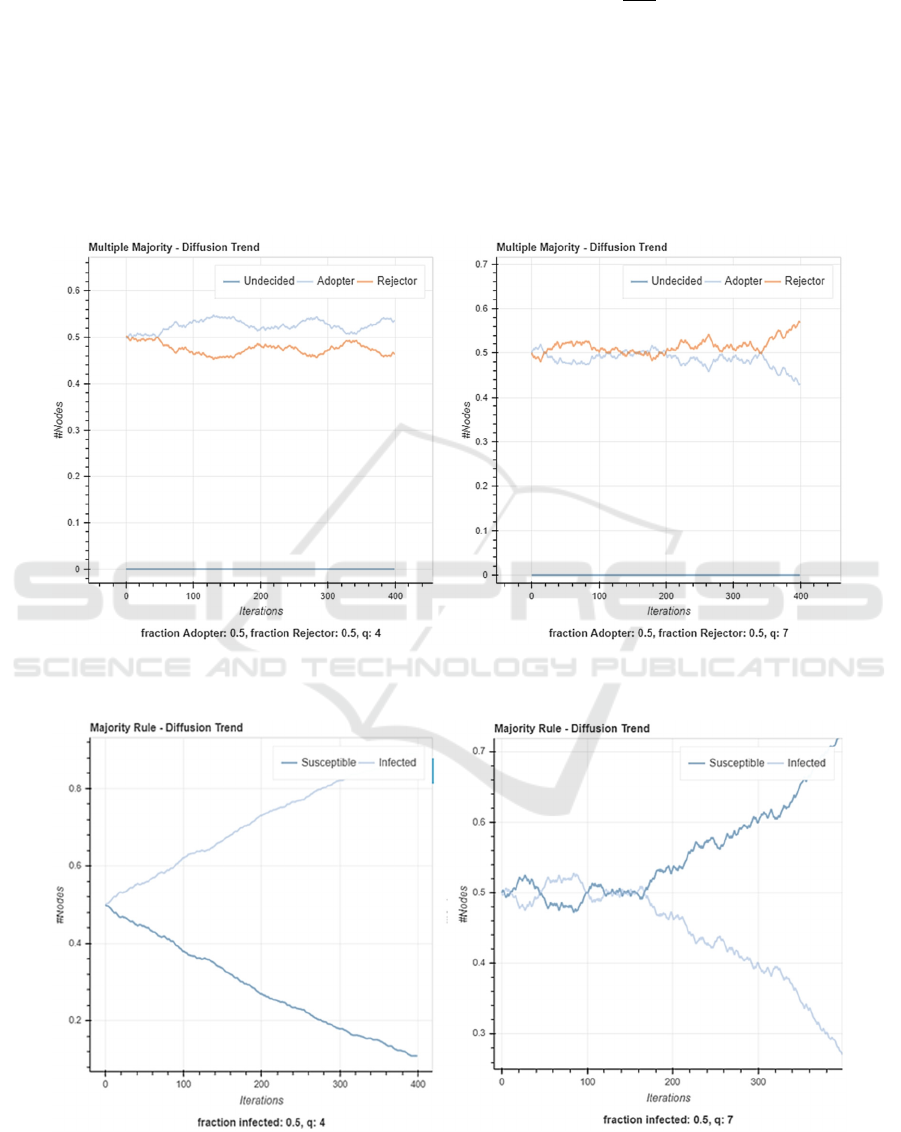
Figure 4: MMR model with a two-state system where both populations are set to 50%. 1000 nodes were selected for this
experiment along with 400 iterations, a neutral bias, and a Q-group size of 4 and 7 from left to right.
Figure 5: Galam Majority Rule model configured with the same initial parameters as shown in Figure 4 without the bias
parameter.
SIMULTECH 2021 - 11th International Conference on Simulation and Modeling Methodologies, Technologies and Applications
210
Finally, the last field is the number of successes,
which is the minimum number of successful iterations
for a population to take over the majority, which in
this case is 201. After you input all the values in their
respective fields you will find the probability of
success on a single trial. The sum of all the equations
with the different values of k will give you the
probability of the susceptible population becoming
the majority after 400 iterations. This probability
could be expressed by P(400 ≤ X ≥ 201) where X is
the number of iterations required to be the final
majority.
In the case of the MMR model if a tie occurs,
regardless if Q is even or odd, the outcome of the
majority is chosen depending on what the bias value
is. The user can choose to have a biased or unbiased
experiment favoring either adopters or rejectors, or
neither. If the user chooses to make a balanced
simulation, the bias value must be set to 0.5, which
will result in the majority being chosen stochastically
whenever a tie occurs (
Chaouiya, 2013)
.
𝑄2
⁄
𝑄
=
1
2
(3)
Equation 3 is used to calculate the probability of
the adopter or rejector population becoming the
majority using a two-state MMR model. The formula
assumes the model uses a neutral bias and both
populations start at 50%.
Since (3) can be simplified to one-half, we can
conclude that, given a neutral bias, both populations
have exactly a 50% chance of becoming the majority
in a two-state system. It must be noted that you can
use a Q-group of any size, even or odd and the
probability will not change.
4.2 The Case of Two States
The following charts showcase the MMR model
functioning as a two-state system in comparison with
the Galam Majority model in its respective order.
Figure 4 illustrates that when using the MMR model,
changing the size of the Q-group from an even or odd
number does not dictate that a specific population will
become the majority.
The left plot in Figure 5 demonstrates that when
you use an even number as the size of the Q-group,
the results are skewed towards the infected state. The
plot on the right shows that once the Q-group size has
been modified to an odd number, the Galam Majority
Rule model produces a balanced simulation where
neither population is advantaged.
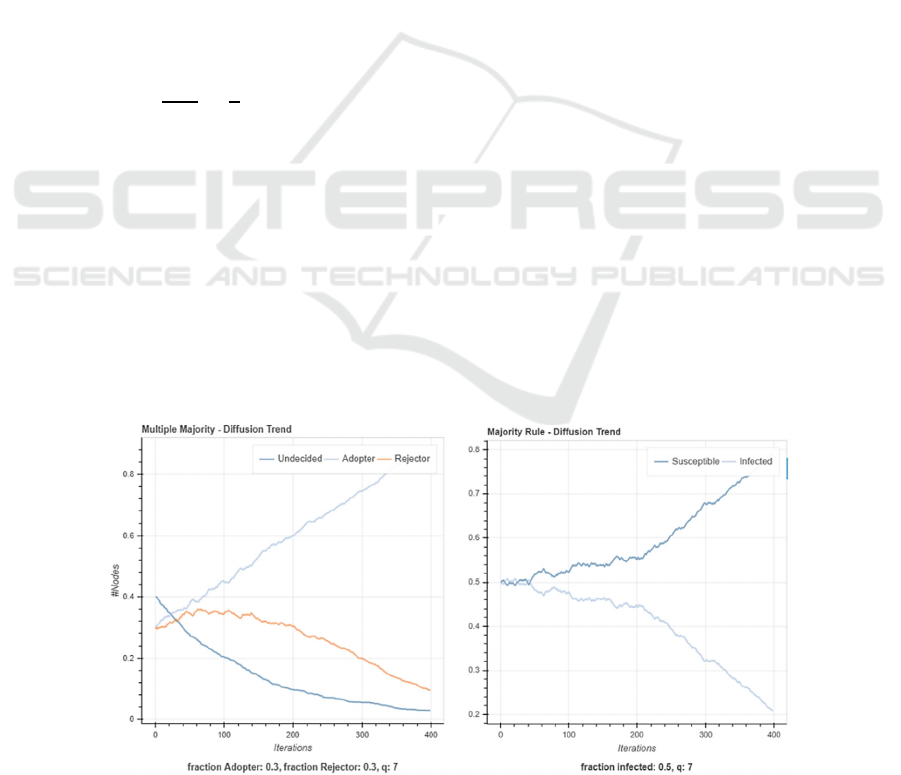
4.3 The Case of Three States
The Galam Majority Rule model cannot simulate a
three-state system. The MMR model introduces the
undecided state which represents a group of nodes
without a defined stance. It was found that the
addition of the undecided nodes increases the rate at
which nodes become opinionated. This does not
necessarily mean that a majority will be computed
sooner. The higher the population of undecided, the
more variance there is in the results. This means that
ignoring those nodes which are undecided might
make a big difference when computing a majority
with regards to time. In most cases, if you conduct an
experiment where the population is divided into 50%
of adopters and 50% of rejectors, the rate at which a
majority is computed is slower than that of an
experiment conducted with 30% of adopters, 30% of
rejectors and 40% of undecided.
Figure 6: Plots showing the impact of using the MMR model as a three-state system on the left in respect to a two-state system
Galam Majority Rule model simulation on the right. These plots also use a population of 1000 nodes.
MMR: Multiple Majority Rule Model with Bias
211
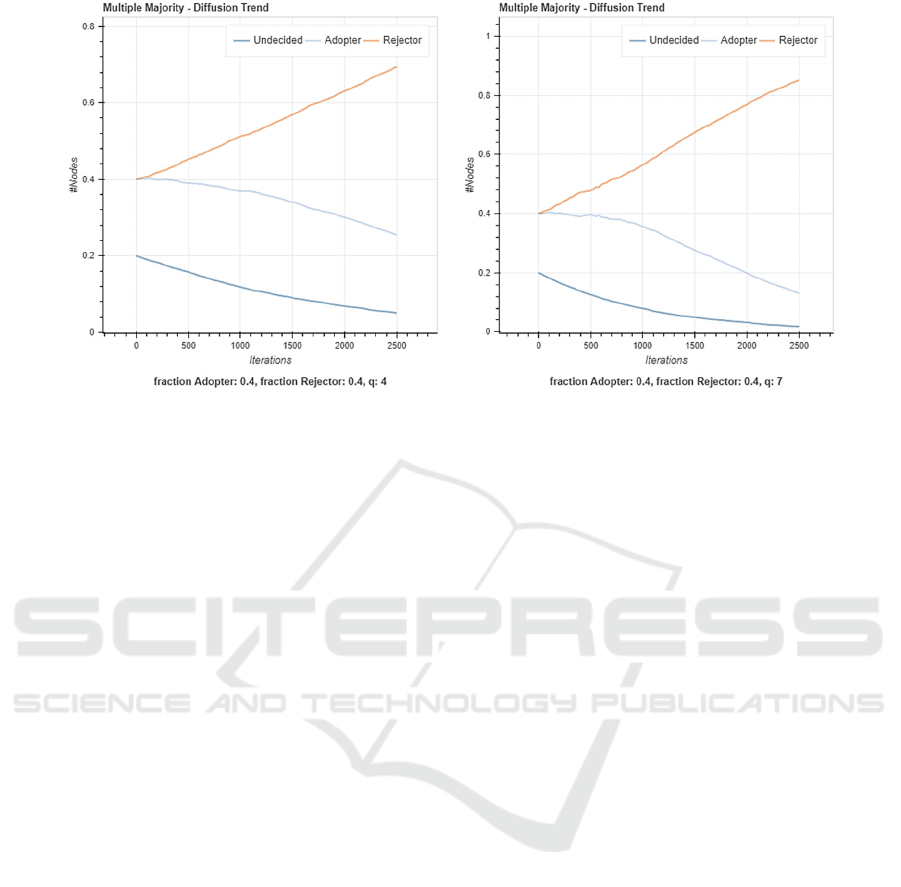
Figure 7: Plots showing a 0% bias for adopters and 100% bias for rejectors.
As shown in Figure 6, after 200 iterations using the
MMR model, 30% of the population changed their
initial stance. While using the Galam Majority Rule
model resulted in ~10% of the population changing
their initial status on the same mark. As expected,
using the three-state system MMR model results in a
faster simulation even though the two-state system
reaches a consensus sooner because of the lead start
in population.
5 THE IMPACT OF BIAS IN THE
MMR MODEL
In this section, we discuss how various values for the
bias can affect the outcome of a given simulation and
how the size of the Q-group has an effect on the bias
and its effectiveness.
5.1 Analyzing Bias Results
The results below show as expected, the two lines that
represent both states display polarizing results at 0%
and 100% bias. These lines get closer as they reach
the neutral bias value which is 0.5. From this point,
shifting the bias to one side or the other will be the
reason a state will have an advantage over the other.
With the ability to be able to set a bias before
running the model, we can visualize how the value of
the bias affects the outcome of the simulation. For the
data collected, we looked at different breakpoints of
bias values to visually see the impact it had. For
Figures 7-9, all the charts were initially configured to
have 7500 nodes, 2500 iterations, adopter, and
rejector populations at 40% each and undecided
population at the remaining 20%. Except for Figure
10.2, every left plot has a Q-group size of 4 and the
right plot has a Q-group size of 7. At the extreme ends
where the bias for either rejector or adopter is 0% or
100%, the charts show clearly that the majority
opinion with the favorable bias will end up with an
overwhelming majority. As the bias gets to the
25/75% split, this gap between the majority and
minority opinions begins to close. When there is a
neutral bias, the majority opinion only slightly hovers
above the 50% mark and not straying far from it.
As seen from these results, the dispersion between
the two states as we modify the values of the bias from
0 to 1. The closer it approaches either 0 or 1 the more
disparate the lines become. As we can see 0.5 is the
midpoint between the minimum and the maximum
bias and it is the point where neither state has an
advantage over the other. As we can see from this
diagram, both sides of the plot are symmetric,
meaning that setting a bias of 0.25 or a bias of 0.75
will make both simulations behave the same, just
changing which state is in the majority.
6 RELATED WORK
The Galam Majority Rule model has been studied and
researched extensively. It has been shown that the
Galam Majority Rule model generally results in the
final opinion being equal to the initial majority
(Krapivsky, 2003). This paper explores the spread of
opinion using the Galam Majority Rule model. It
found that for most systems the final opinion always
SIMULTECH 2021 - 11th International Conference on Simulation and Modeling Methodologies, Technologies and Applications
212
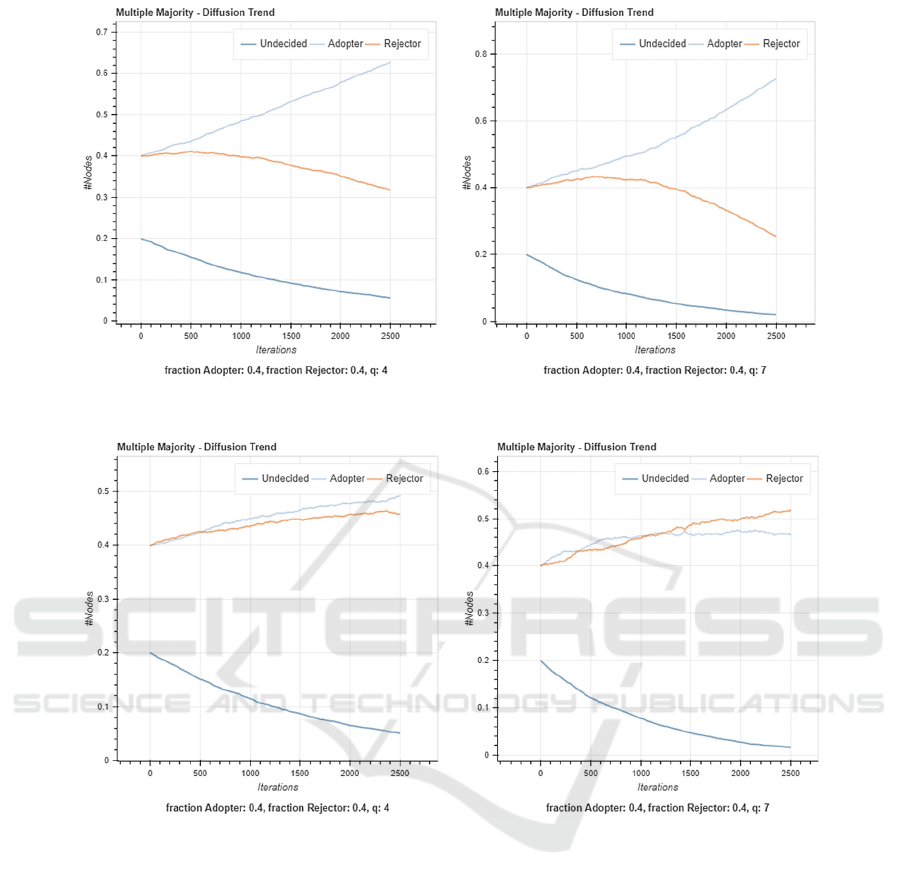
Figure 8: Plots showing a 25% bias for adopters and 75% bias for rejectors.
Figure 9: Plots showing a neutral bias (50%) for adopter and rejector.
equals that of the initial majority except when the
dimension of the model is one. The Galam Majority
Rule model when stubborn nodes are introduced into
the network (Mukhopadhyay, 2020). It shows that
when nodes are biased towards a preferred opinion,
the bias can affect the consensus of the preferred
opinion and can be achieved with a high probability.
It also shows that when stubborn agents with fixed
opinions are present, the resulting network will have
metastability, fluctuating between each of the
different states of the configuration. Our MMR model
behaves similarly to the gene regulatory networks
when they update their next gene when a tie occurs
(Chaouiya, 2013).
7 CONCLUSION AND FUTURE
WORK
The Galam Majority Rule model is a simple model
that shows the spread of opinions throughout a
population. However, it has an unmodifiable bias,
which results in creating skewed results. This model
does not allow for nodes without a definitive opinion.
It was found that counting for undecided agents in a
network makes the model more accurate with respect
to time as well as giving the model more variance in
the results. The bias has proved that it can be the
determining factor of a population reaching a
majority even if they started in the minority.
MMR: Multiple Majority Rule Model with Bias
213

The Galam Majority Rule model has proven not to
be consistent, as using an even number for the size of
the Q-group results in a skewed experiment against
the susceptible population. Alternatively, the MMR
model has proven that while using a neutral bias
neither population has an advantage. Furthermore, the
MMR model can be used as a two-state system to
replace the Galam Majority Rule model. Our model
can also be used to include undecided agents and add
a bias to account for how strong each of the opposing
populations’ opinions is.
For future work, the network graph the model uses
on the back end consists of nodes and edges which are
only formed between the nodes in the Q-group. We
believe that our MMR model could be further
improved if the nodes in the Q-group were not picked
at random and there was an underlying network layer
that simulated pre-existing connections like how
people interact in real-life. Then Q-groups could be
selected from nodes who are neighbors. This would
more accurately represent the way information
spreads in society. Further research could be
conducted by considering the eccentricity and
betweenness when selecting nodes to form Q-groups
from the network graph.
Lastly, use of statistical analysis may be considered
to find the average outcome of multiple model
simulations, and machine learning, to find the value
of the bias for different topics.
REFERENCES
Krapivsky, P. L., & Redner, S. (2003). Dynamics of
majority rule in two-state interacting spin systems.
Physical Review Letters, 90(23), 238701.
Mukhopadhyay, A., Mazumdar, R. R., & Roy, R. (2020).
Voter and Majority Dynamics with Biased and
Stubborn Agents. arXiv preprint arXiv:2003.02885.
Rossetti, G., Milli, L., Rinzivillo, S., Sîrbu, A., Pedreschi,
D., & Giannotti, F. (2018). NDlib: a python library to
model and analyze diffusion processes over complex
networks. International Journal of Data Science and
Analytics, 5(1), 61-79.
Rossetti, G., Milli, L., Rinzivillo, S., Sirbu, A., Pedreschi,
D., & Giannotti, F. (2017, October). Ndlib: Studying
network diffusion dynamics. In 2017 IEEE
International Conference on Data Science and
Advanced Analytics (DSAA) (pp. 155-164). IEEE.
Chaouiya C, Ourrad O, Lima R (2013) Majority Rules with
Random Tie-Breaking in Boolean Gene Regulatory
Networks. PLoS ONE 8(7): e69626.
https://doi.org/10.1371/journal.pone.0069626.
SIMULTECH 2021 - 11th International Conference on Simulation and Modeling Methodologies, Technologies and Applications
214
