
Transit Performance Evaluation at Signalized Intersections of Bus
Rapid Transit Corridors
Robel Desta
1 a
, Tewodros Dubale
2
and János Tóth
1
1
Department of Transport Technology and Economics, Faculty of Transportation Engineering and Vehicle Engineering,
Budapest University of Technology and Economics, Muegyetem rkp. 3, 1111 Budapest, Hungary
2
Department of Civil Engineering, Institute of Technology, Hawassa University, P.O. Box 1528, Hawassa, Ethiopia
Keywords: Bus Rapid Transit, Delay, ITS, PTV VISSIM, Transit Signal Priority.
Abstract: Bus Rapid Transit (BRT) is one of the mass transportation solutions consisting of infrastructures integrating
dedicated bus lanes and smart operational service with different ITS technologies like Transit Signal Priority
(TSP). Delay at an intersection is among the major factors for poor transit performance. This study examines
the performance of buses at intersections of BRT corridors, which are privileged with Signal Priority on the
dedicated lane. Simulation models were developed for the selected intersection together with the real-time
calibration and validation. Statistical comparisons were conducted to test the alternative scenarios aimed at
visualizing the deployment advantages. TSP options were evaluated by using PTV VISSIM with VisVAP
add-on simulation tool. Alternative scenarios with and without TSP were tested to measure the performance
of BRT buses along with impact assessment on the general traffic. TSP reduces travel time and control delay,
improves travel speed and the results depicted a reduction in average passenger delay by 10–20%. The
improvement on travel speed at an intersection of BRT vehicles were determined to be 6–8%. Prioritizing
buses has diminutive impact on the general traffic, nonetheless, it is the easiest way of improving transit
performance.
1 INTRODUCTION
Many of the cities around the world are experiencing
alertly growing traffic congestion in urban areas and
motorway networks. The impact of congestion could
be calmed down by optimizing the performance of the
traffic infrastructure through various traffic
management and operational strategies. The
effectiveness of the proposed mitigation measures are
examined in carefully designed experiments for a real
highway stretch with real demand scenarios.
Furthermore, the behaviour of the proposed
intervention schemes is examined and evaluated
through microscopic simulation models along with
refined validation (Ziaei and Goharpour, 2019;
Papadopoulou et al., 2017; Gunawan et al., 2014).
Bus Rapid Transit (BRT) is one of the efficient and
sustainable solution enhancing mass transportation
performance. It is a high quality bus-based transit
system that provides dedicated lanes for buses and is
therefore considered to be fast, safe, comfortable, and
a
https://orcid.org/0000-0002-8055-7137
cost effective. It requires an improvement in the
infrastructure like BRT dedicated lane, integration of
the service and operation with different intelligent
transport technologies like Transit Signal Priority
(TSP), because of this, it is considered to be an
effective and cheap way of improving transit service
reliability and efficiency (Prayogi and Satwikasari,
2019; Raj et al., 2013; Deng et al., 2013).
TSP is an Intelligent Transportation System (ITS)
component that modifies the normal signal operation
process to better accommodate transit vehicles. It
aims to reduce the delay and travel time of transit
vehicles, thereby increasing the quality of a transit
service, meanwhile, it should attempt to provide these
benefits with minimal impact on other road users
(Shaaban and Ghanim, 2018; Parr et al., 2014;
Albright and Figliozzi, 2012). Various cities are
implementing BRT for making public transport an
attractive travel option; nevertheless, it is better to
develop virtual models in order to visualize the
impact of TSP performance, which should be done
618
Desta, R., Dubale, T. and Tóth, J.
Transit Performance Evaluation at Signalized Intersections of Bus Rapid Transit Corridors.
DOI: 10.5220/0010474506180625
In Proceedings of the 7th International Conference on Vehicle Technology and Intelligent Transport Systems (VEHITS 2021), pages 618-625
ISBN: 978-989-758-513-5
Copyright
c
2021 by SCITEPRESS – Science and Technology Publications, Lda. All rights reserved

before implementation on signalized intersections of
BRT corridors. It aids in envisaging the real-world
characteristics of the traffic operational conditions. It
also assists in visualizing traffic performance impacts
under different situation and scenarios, which help
decision makers to choose the best approach during
deployment period (Prayogi and Satwikasari, 2019;
Gunawan et al., 2014; Krajzewicz et al., 2012).
Various microsimulation software’s are available
on the market and used as tools for the evaluation of
traffic management and control. Released in 1992,
PTV VISSIM (Planung Transport Verkehr - Verkehr
In Städten - SIMulations model) is a microscopic,
time step and behaviour-based simulation model
developed to model urban traffic and public transit
operations. It can operate with the analyses of various
traffic and transit operations under various conditions
and aid the assessment of traffic impacts of physical
and operational alternatives in transportation
planning. VISSIM itself can be considered as a very
technical software to work with, due to its complexity
and versatility. Application of the simulation tool
include functions of testing TSP timing alternatives
(Papageorgiou et al., 2006; Smith et al., 2005; Ngan
et al., 2004; Park and Schneeberger, 2003).
Operational measures like TSP may have positive
as well as negative impact on the general traffic. In
general, TSP helps the public transport vehicles to
easily pass the congested signalized intersection.
However, due to lack of different operational and
technical problems, the efficiency of this technology
could be highly distorted and to cope with this, the
responsible authority shall assess its effectiveness in
regular basis. It is always better to see the impact or
the possible problem, which may be affecting the
operation of transportation systems (Shaaban and
Ghanim, 2018; Deng et al., 2013; Ngan et al., 2004).
Since such infrastructure could be costly and may
cause impedance to the general traffic, investigations
should be conducted to evaluate their possible
impacts behind their expected benefits. In this regard,
this study provides additional insights as it focuses on
the evaluation of TSP performance at signalized
intersection along the BRT corridor with the
developed microsimulation models, together with the
real-time calibration and validation.
2 LITERATURE REVIEW
TSP can be an effective method for improving transit
service, efficiency, and reliability despite increasing
congestion. However, unless the results of this
method are measured and evaluated, the system will
never actually contribute its maximum potential
benefit. Ultimately, the goal of TSP is to improve
transit performance; nevertheless, from local routes to
BRT, understanding of how TSP affects the
performance of a system is prerequisite to
maximizing the benefit of such measures. The
primary aspects of transit service that are exaggerated
by TSP include travel time, speed, and reliability.
Four primary performance measures that can be used
to determine travel speed and reliability are average
speed, statistical variability in travel time, percentage
of buses arriving on time and frequency/variance of
headway (Shaaban and Ghanim, 2018; Smith et al.,
2005).
TSP technologies can be used to extend or
advance green times or allow left turn swaps to allow
buses that are behind schedule to get back on track,
improving schedule adherence, reliability, and speed.
The technology requires traffic signal controllers with
imbedded software, TSP capable equipment on the
transit vehicle and equipment at the intersection for
identifying the transit vehicle and generating low
priority request when appropriate (Albright and
Figliozzi, 2012; Ngan et al., 2004; Baker et al., 2002).
TSP strategy is used to extend the green interval by
up to a preset maximum value if a transit vehicle is
approaching. Detectors are located so that any transit
vehicle that would just miss the green light (by no
more than the specified maximum green extension
time) receive extended green time and is able to clear
the intersection rather than waiting through an entire
red interval (Parr et al., 2014; Smith et al., 2005).
Green Extension provides a benefit to a relatively
small percentage of buses (only the delayed buses that
arrive during a short time window). However, the
reduction in delay for those buses that do benefit is
large (an entire red interval). This strategy is used to
shorten the conflicting phases whenever a bus arrives
at a red light in order to return to the bus's phase
sooner. The conflicting phases are not ended
immediately like they are for emergency vehicle
preemption systems, but are shortened by a
predetermined amount. Early green benefits a large
portion of buses (any bus that arrives at a red light),
but provides a relatively modest benefit to those
buses. Early green can be combined with green
extension at the same intersection to increase the
average benefits for transit (Shaaban and Ghanim,
2018; Wolput et al., 2015; Parr et al., 2014; Albright
and Figliozzi, 2012; Dion et al., 2004; Baker et al.,
2002).
VisVAP (VISual Vehicle Actuated
Programming) is an optional add-on module of PTV
VISSIM for the simulation of programmable phase or
Transit Performance Evaluation at Signalized Intersections of Bus Rapid Transit Corridors
619
stage-based traffic actuated signal program controls.
The control logic is described in a text file using a
simple programming language. During VISSIM
simulation runs or in the text mode, VisVAP
interprets the control logic commands and creates the
signal control commands for the VISSIM network. At
the same time, various detector variables reflecting
the current traffic situation are retrieved from the
simulation and processed in the logic. In signal
priority logic, various studies disclosed that early
green and extended green or red truncation of TSP
strategies are the most used approaches (Smith et al.,
2005; Dion et al., 2004; Ngan et al., 2004; Baker et
al., 2002).
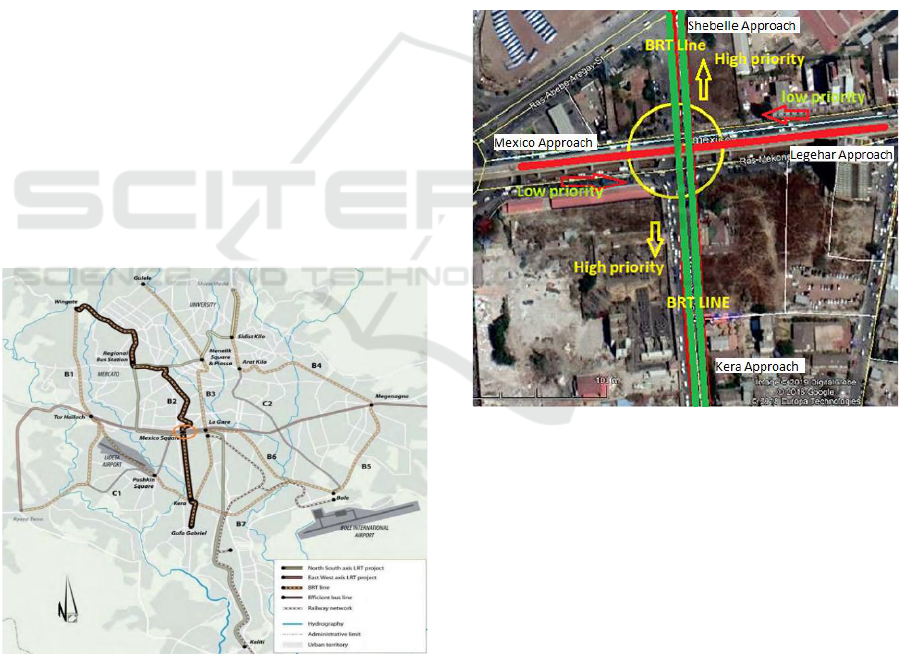
3 CASE STUDY AND METHODS
In this study, the project of the line B2 of the BRT
network (Fig. 1) was considered, which is developing
along an axis crossing Addis Ababa city from North
to South, the entire B2 BRT line stretches nearly 20
km. The standard cross-section has two directions
central lane bus ways having 3.5m lane width per
direction with passing lanes of 3.5m width on the
adjacent sides for the general traffic. Along the
corridor, the cross-section converted was between 25-
40 meters width for works related to both the BRT
corridor and the mixed traffic.
Figure 1: The proposed BRT corridor (B2 line) in Addis
Ababa city (Source: (LTPA, 2010)).
This study describes the relationship and impact
on traffic performance of the BRT-B2 operation at
selected intersection (Mexico square signalized
intersection), which is considered for TSP study (Fig.
2). Actual field data on classified intersection volume
at each leg by vehicle type, traffic signal cycle
lengths, traffic composition, road geometry,
categorized average vehicle sizes, mid-block traffic
volume, spot speeds and observation data on traffic
operation were accumulated for developing the
simulation models in VISSIM.
Moreover, additional data were collected from
field for samples of vehicles based on standard
literature. Such data include actual vehicle
categorized travel time (Garber and Hoel, 2008), time
headways (Shawn et al., 1998), categorized total
traffic delays (Garber and Hoel, 2008; Bhavsar et al.,
2007), queue lengths (Shawn et al., 1998) and speed
data (Garber and Hoel, 2008; Currin, 2001) to verify
the validity of the simulation results with the actual
traffic conditions. Accordingly, the summarized data
collected based on the above sampling strategies were
utilized in the development of the simulation models.
Figure 2: BRT direction at Mexico square signalized
intersection near Ras Mekonen avenue.
The Mexico square signalized intersection is the
junction where the BRT is given priority and
expected to pass the intersection with insignificant
impact on the general traffic. The BRT direction is
North to South, which will be receiving signal priority
over the East to West general traffic (Fig. 2).
Basic measurements are taken at the intersection,
which are preliminary geometric data input for the
VISSIM model.
Intersection volume and spot speed study were
conducted on each approach of the intersection to
determine the distribution along the intersection (Fig.
3). Furthermore, the speed data are also used for
calibrating the PTV VISSM model to ensure the
correct representation of the field conditions.
VEHITS 2021 - 7th International Conference on Vehicle Technology and Intelligent Transport Systems
620
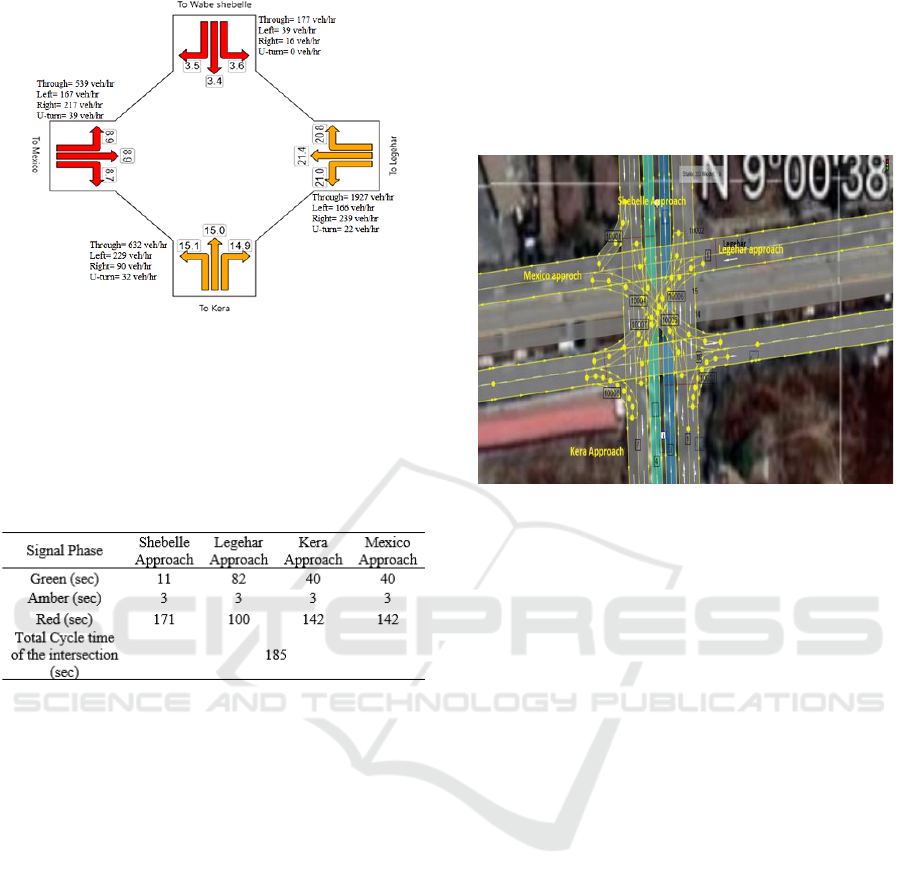
Figure 3: Total hourly volume on each approach and
average travel speed including all delay effects (km/h).
The signal data for the four phases were recorded
for creating the signal program in VISSIM (Table 1),
which facilitates the creation of a realistic base model.
Table 1: Fixed time signal cycle lengths at Mexico square
signalized intersection.
3.1 Developing the Base Micro
Simulation Model
According to LTPA (2010), the proposed BRT B2
works with a virtual loop detector installed on the bus
lane. When a bus arrives in the virtual loop, it detects
the bus arrival and sends a signal to the traffic signal
controller at the junction. The controller will initiate
the bus priority signal cycle, which will reduce the
green signal time for other arms of the junction or
extend the green signal for the bus lane to prioritize
the transit operation. Green Extension of a buffer time
less than or equal to 10-25 s, whereas Red Truncation
/Early Green/ of termination less than or equal to 10-
25 s are considered in the BRT B2 corridor. In this
study, fixed Green extension and Early green time are
taken as 15s.
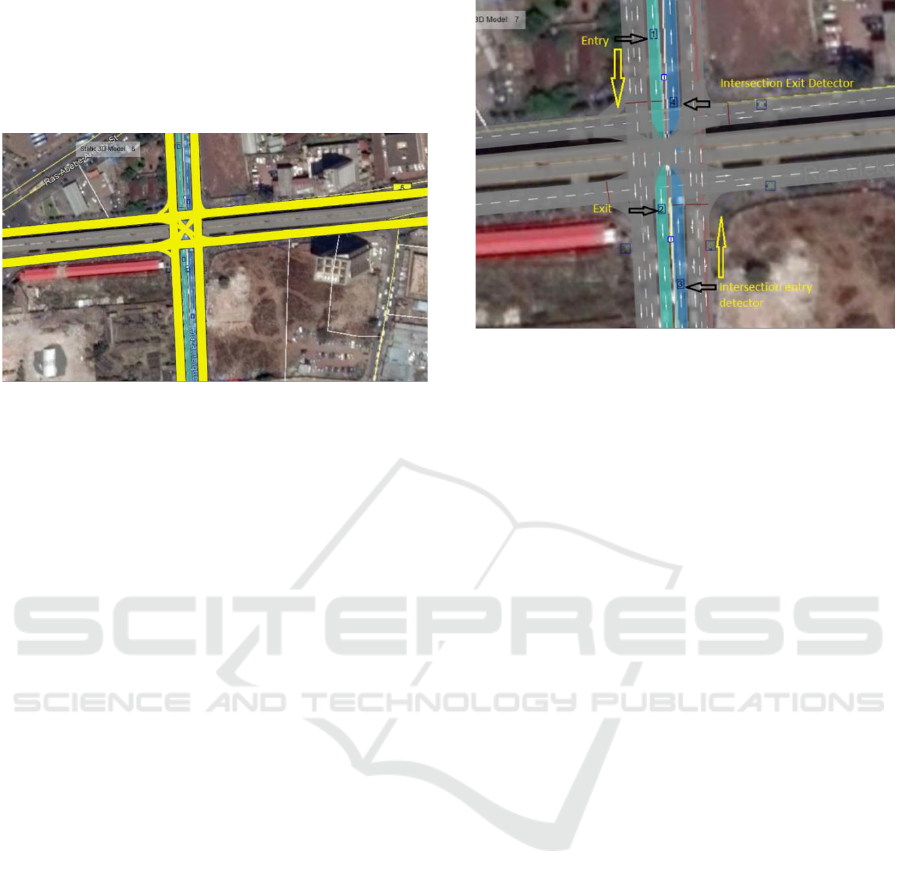
In developing the model with PTV VISSIM,
scaled background map of the intersection along the
BRT dedicated lane ensures accurate geometric
representation. The selected Mexico square
signalized intersection was modelled on VISSIM
using the data obtained from field (geometric data
like lane width, approach length, segregated lane, and
section of the BRT-B2 corridor) and secondary data
sources (Fig. 4). Validation of the PTV VISSIM
model were conducted using speed data from the field
and data from the software output with justified
confidence interval. Afterwards, evaluation of the
TSP setups was performed at the intersection.
Figure 4: Snapshot of simulation model with the links,
splined connectors, and reduced speed areas at Mexico
square signalized intersection.
Overall, in the model development, PTV VISSIM
annex software (VisVAP) were used to program the
actuated signal controller. Scenario 1 will be with No
Green Extension /No Early Green, where the Existing
fixed cycle time is adopted as it is. In Scenario 2, the
program consists of green extension of 15 s, early
green time of 15 s and the interruption of cycle time
based on the call from the BRT buses reaching the
detectors.
3.2 Routing Decision and Vehicle
Attributes
Combining inputs of vehicle attributes, vehicle route
per direction, speed distribution and inputs of public
transport characteristics for the BRT, general routing
of BRT buses was made following the traffic
behavior in the dedicated lane. Defining vehicle
routes (static vehicle route decision) were configured
based on the actual field conditions by considering
the direction of the link flows (Fig. 5). Then, link
relative flows were entered in each direction for
separate movement types of the intersection. Each
routing decisions show the branches of possible
movements with their corresponding relative
flows/traffic volumes. Directional traffic flow at the
intersection was assigned in VISSIM with relative
flow of vehicles along with the vehicle types, each
volume input was calibrated later for better level of
Transit Performance Evaluation at Signalized Intersections of Bus Rapid Transit Corridors
621
accuracy in the model. Before inserting the relative
vehicle volumes at each leg, new vehicle
compositions were defined for those vehicle types
that does not exist by default in VISSIM to represent
the actual vehicle types in the corridor.
Figure 5: Snapshot of simulation model with the vehicle
routes at Mexico square signalized intersection.
3.3 Signal Controller
A detector was placed on the BRT dedicated lane near
the signalized intersection (Fig. 6). Signal control on
the intersection were based on the existing signal
scheme and priority given via the sensor, which is
initiated by a call by the BRT buses approaching at an
intersection. By interrupting the fixed signal cycle, an
optimum green extension and red truncation was
incorporated in to the system.
Modelling traffic signal control to emulate the
‘before’ case and to deploy a ‘green extension/early
green’ priority logic to scrutinize the ‘after’ case is
the main element of this study. Therefore, it was very
important to outdo the signal control data and to
program the model for deploying the priority strategy.
In this research, VisVAP based approach was chosen
to model selected intersections signal program in
VISSIM, which includes different signal head groups
attributed to different lane geometric configurations.
One of the primary importance in this research
was guaranteeing minimum disruption of traffic
signal operations. This feature was especially
important to the selected study junction, where the
main corridor is a major urban road carrying high
traffic volumes in peak hours; moreover, the
deployment is planned for green extension.
Therefore, the study incorporated a 15 s green
extension and 15 s red truncation to evaluate the
possible outcomes of the strategies.
Figure 6: Signal and detector coordination in VISSIM.
3.4 Validation of the Model
The validation and calibration of the model is an
important process in the simulation process, since it
delivers credibility to the results by closely
representing the actual conditions. Calibration
involves adjusting the default values of PTV VISSIM
software, which may not be the representative of the
driving and geometric characteristics of the study
segment. The validation process involves comparing
and justifying the result (field and VISSIM output)
with level of accuracy given by confidence interval
(Raj et al., 2013; Vedagiri & Jain, 2012; Park and
Schneeberger, 2003). Typical calibration measures
include the consideration of traffic parameters like
volume, delay, and travel speeds. In this study,
average operating speed (spot speed) was used as a
measure of effectiveness parameter for the transit
network.
Average spot speed of vehicles within the speed
distribution ranges from 5 to 55 km/h. VISSIM allows
the operating speed of a class of vehicles to be
controlled during the simulation process. The average
operating speed was in the range of 5 to 60 km/h,
which closely relate with the field data. Furthermore,
the signal time distributions for ‘No TSP’ case
observed from the VISSIM output are similar to the
inputs from field conditions, which provides further
support for the signal control. The speed distribution
in VISSIM and in the field favourably compare with
one another with 95% confidence (Fig. 7). Therefore,
the model is closely related to the real traffic
behaviour in the field.
VEHITS 2021 - 7th International Conference on Vehicle Technology and Intelligent Transport Systems
622
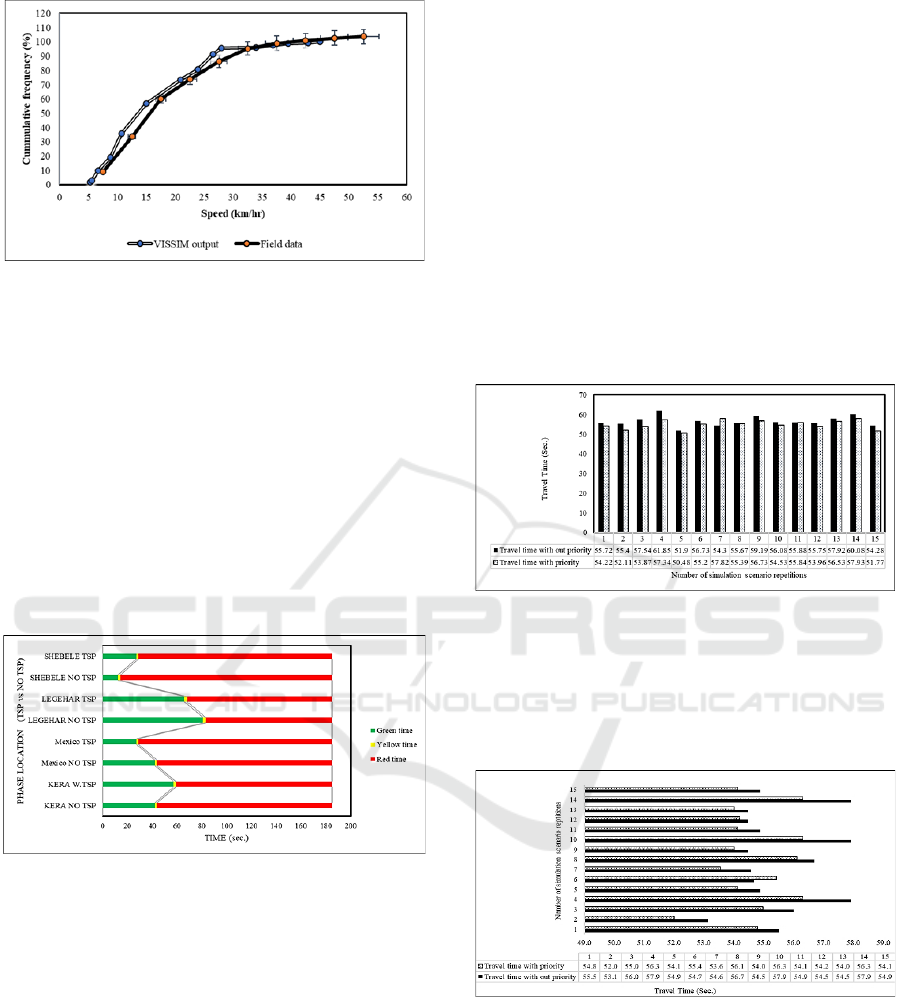
Figure 7: Comparison of speed distribution from PTV
VISSIM with field measurement.
3.5 Simulated Signal Scenarios and
Scenario Management
Two scenario groupings were implemented in
simulation runs that can be distinguished by certain
characteristics being simulated. The two scenarios
analyzed were the No Transit Signal Priority
(scenario I) and with Transit Signal Priority (scenario
II). The change in signal phases coordination (either
Green extension or early Green) within the two
scenarios brought considerable alteration in the
performance of transit operation (Fig. 8).
Figure 8: Green Extension and/or early Green on
intersection phase in the two scenarios.
To investigate the impact of signal priority on the
performance of BRT B2 buses and general traffic,
scenario management were considered during the
simulation to facilitate the assessment of traffic
parameters. The basic conditions of TSP plan and
way of detecting the bus arrival at an intersection,
green extension of 15 s (GE-15), and red truncation
/early green 15 s (EG-15) are critical dimensions in
the scenarios. In general, 15-20 s of GE and EG
extension was fused in the simulation network. The
above signal modification of green extension and/or
early green was made on the existing signal to
experiment on the variations that occur. The changes
in the signal coordination was made with the help of
VisVAP logic, which was used for programming the
detector call.
4 RESULTS AND DISCUSSIONS
The extracted output data from PTV VISSIM result
directory include travel time, delay, and queue length
of BRT buses, and the general traffic. For the
assigned approach crossing segment at the
intersection (North to South), the vehicles travel time
were extracted from VISSM output directory for both
scenarios (Fig. 9). There is a significant improvement
in the travel time of BRT the North to South line by
an average of 2.83% decrease in the overall travel
time.
Figure 9: Travel time of BRT vehicles from North bound
Shebelle approach to South bound Kera approach.
Data extracted for the South to North flow
indicated that there is a significance improvement in
the travel time of BRT with an average 4.78%
decrease in the overall travel time (Fig. 10).
Figure 10: Travel time of BRT vehicles from South bound
Kera approach to North bound Shebelle approach.
The simulation result of average queue length from
VISSIM results directory were summarized for
average values based on vehicle composition and
category of the general traffic (Table 2). The priority
direction in Kera and Shebelle approaches has
improvement in queue length, which was reduced by
1.5%-1.7%, whereas the non-priority side of the
intersection the queue length increased by 1.1%-2.5%.
Transit Performance Evaluation at Signalized Intersections of Bus Rapid Transit Corridors
623
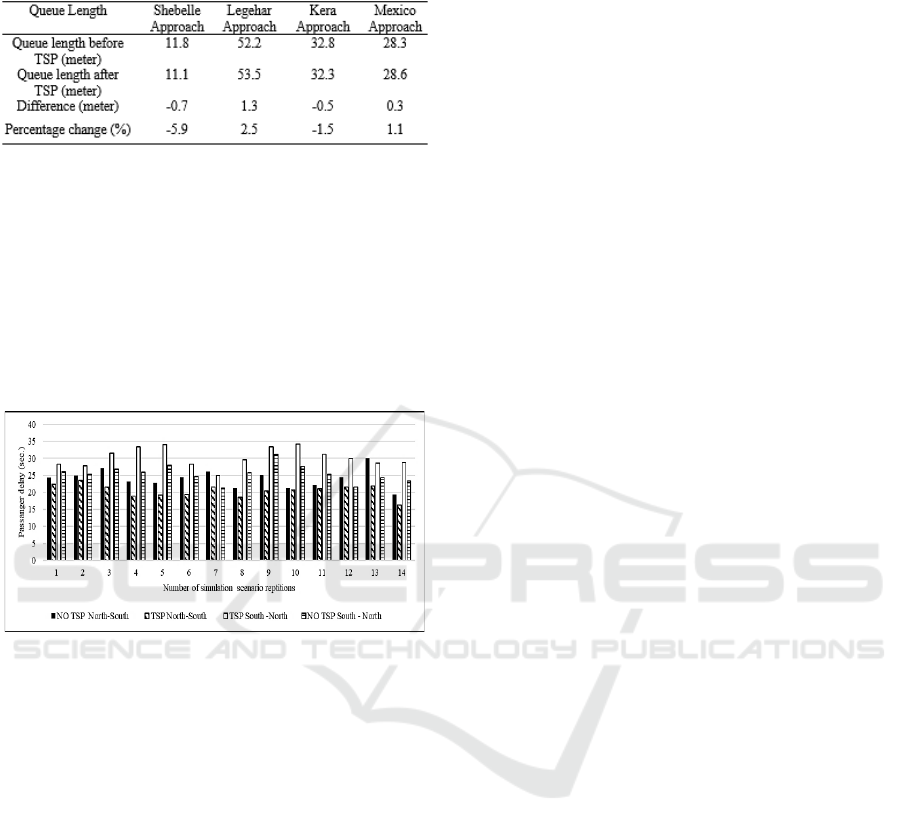
Table 2: Summary of average queue length at the different
approaches of the intersection.
The simulation results from PTV VISSIM
indicated that for the selected BRT corridor, the travel
speed increased by an average of 7.25%. The Speed
variability for BRT vehicles with and without transit
signal priority was significant.
From the overall results of the simulation
scenarios, the average passenger delay for the
multiple simulation cases signposted a positive result,
which is an average of 10%-20% in delay reduction
in comparison to the no priority case (Fig. 11).
Figure 11: Average Delay of BRT vehicle passengers in the
No TSP and With TSP scenarios.
5 CONCLUSIONS
This study presented crucial insights in developing a
simulation model with relative comparison of various
scenarios for experimenting transit signal priority
approaches at intersections of BRT corridors. The
study particularly addressed the performance of buses
running on a segregated lane and receiving signal
priority at junctions over the general traffic.
Moreover, the influence on the general traffic
performance was examined to evaluate the pre- and
post-deployment conditions of the Transit Signal
Priority on BRT corridors. Based on the experimental
investigations, the following conclusions are made:
• the PTV VISSIM simulation output and
statistical comparisons indicated that there is a
significant improvement in the performance of
BRT buses at an intersection level crossing
because of the TSP;
• the introduction of TSP resulted in an average
travel time reduction by a minimum of nearly
4% for BRT buses;
• the average delay reduction for passengers of
the BRT line was found to be 10-20% and the
travel speed of BRT vehicles was increased by
7-8%;
• TSP may reduce the queue length in the priority
direction (parallel to the BRT lane) by nearly
2%, while in the non-priority direction, the
queue may increase by a maximum of 3%.
Overall, implementation TSP have little impact on
the traffic performance of the general traffic, while it
can bring significant operational improvement on the
vehicles of the BRT lane.
ACKNOWLEDGEMENTS
The authors wish to acknowledge all the professionals
who contributed to this work; especially, Transport
Programs Management Office’s (TPMO’s), Traffic
Safety and management (TSM) division staffs and
BRT unit staffs for their technical assistance and
provisions of the license to run PTV VISSIM. The
authors extend their sincere appreciation for the
Ethiopian Roads Authority (ERA) and Hawassa
University for funding this research work.
CONFLICT OF INTEREST
The authors declare that they have no competing
interest.
REFERENCES
Albright, E., Figliozzi, M., 2012. Factors influencing
effectiveness of transit signal priority and late bus
recovery at signalized intersection level.
Transportation Research Record, 2311(1), pp.186-194.
Baker, R. J., Collura, J., Dale, J.J., Head, L., Hemily, B.,
Ivanovic, M., Jarzab, J.T., McCormick, D., Obenberger,
J., Smith, L., Stoppenhagen, G.R., 2002. An Overview of
Transit Signal Priority, ITS America, Washington, D.C.
Bhavsar, J.N., Sharma, S., Dhingra, S.L., 2007. Simulating
Bus Priority System for an Urban Corridor in Mumbai
City. In: 11th World Conf. on Transport Research.
I.C.T. Pvt. Ltd., A-8 Green Park, New Delhi 110016.
Civil Engineering Department, I.I.T., Powai, Mumbai
400076. India.
Currin, T.R., 2001. Spot Speed Study. In Introduction to
Traffic Engineering: A Manual for Data Collection and
VEHITS 2021 - 7th International Conference on Vehicle Technology and Intelligent Transport Systems
624

Analysis, ed. B. Stenquist. Stamford, Conn.:
Wadsworth Group, pp. 4–12.
Deng, T., and Nelson, J. D., 2013. Bus rapid transit
implementation in Beijing: An evaluation of
performance and impacts. Research in Transportation
Economics, 39(1): 108–113.
Dion, F., Rakha, H. and Zhang, Y. (2004). Evaluation of
potential transit signal priority benefits along a fixed-
time signalized arterial. Journal of Transportation
Engineering, 130 (3), 294-303.
Garber, N.J., Hoel, L.A., 2008. Traffic and Highway
Engineering, 4th Ed., University of Virginia: United
States of America, Cengage Learning, pp. 99-140.
Gunawan, F.E., Suharjito, Gunawan, A.A.S., 2014.
Simulation Model of Bus Rapid Transit. In: EPJ Web
of Conferences. EDP Sciences 21: 1-7.
Krajzewicz, D., Erdmann, J., Behrisch, M., Bieker, L.,
2012. Recent Development and Applications of SUMO
– Simulation of Urban Mobility. In: International
Journal on Advances in Systems and Measurements, 5
(3 & 4): 128-138.
Lyon Town Planning Agency-LTPA. (2010) Addis Ababa
Bus Rapid Transit Line Feasibility study. Available at:
https://docplayer.net/54352900-Feasibility-study-bus-
rapid-transit-line-addis-ababa.html.
Ngan, V., Sayed, T., Abdelfatah, A., Impacts of Various
Parameters on Transit Signal Priority Effectiveness. In:
Journal of Public Transportation, 7 (3): 71-93.
Papadopoulou, S., Papamichail, I., Roncoli, C., Bekiaris-
Liberis, N., Papageorgiou, M., 2017. Microscopic
simulation-based validation of a per-lane traffic state
esti-mation scheme for highways with connected
vehicles. In: Elsevier Transportation Research Part C,
86 (2018) 441–452.
Papageorgiou, G., Damianou, P., Pitsilides, A., Thrasos, A.,
Ioannou, P., 2006. A Microscopic Traffic Simulation
Model for Transportation Planning in Cyprus. In:
International Conference on Intelligent Systems and
Computing: Theory and Applications, pp. 157-166.
Park, B. and Schneeberger, J.D., 2003. Microscopic
simulation model calibration and validation: case study
of VISSIM simulation model for a coordinated actuated
signal system. In: Transportation Research Record,
1856(1), pp.185-192.
Parr, S.A., Kaisar, E.I., Stevanovic, A., 2014. Application
of Transit Signal Priority for No-Notice Urban
Evacuation. In: ASCE Journal of Natural Hazards
Review 15 (2) :167-170.
Prayogi, L., Satwikasari, A.F., 2019. Bus Rapid Transit-
Oriented Development: An Identification of Bus Rapid
Transit System Passengers’ Modal Shift Potential
Considerations. In: CSID Journal of Infrastructure
Development, (2)1: 127-136.
Raj, G., Sekhar, C.R., Velmurugan, S., 2013. Micro
simulation Based Performance Evaluation of Delhi Bus
Rapid Transit Corridor. 2nd Con. of Transportation
Research Group of India (2nd CTRG). In: Elsevier
Procedia – Social and Behavioural Sciences, 104
(2013) 825-834.
Shaaban, K., Ghanim, M. 2018. Evaluation of Transit
Signal Priority Implementation for Bus Transit along a
Major Arterial Using Microsimulation. The 9th
International Conference on Ambient Systems,
Networks and Technologies (ANT 2018). In: Elsevier
Procedia Computer Science, 130 (2018) 82–89.
Shawn, M.T., William, L.E., Robert, J.B., Douglas, J.H.,
1998. Travel Time Data Collection Handbook: Texas
Transport Institute. The Texas A&M University
System: Collage station, Texas 77843-3135, USA.
Smith, H.R., Hemily, B., Ivanovic, M., 2005 “Transit
Signal Priority (TSP): A Planning and Implementation
Handbook.” ITS America. US Department of
Transportation, Washington DC.
Vedagiri, P., Jain, J., 2012. Simulating Performance
Impacts of Bus Priority Measures. In: ACEE Int. J. on
Transportation and Urban Development, Vol. 2, No. 1,
pp. 15-19.
Wolput, B., Christofa, E., Carbonez, A., Skabardonis, A.,
Tampère, C.M.J., 2015. Optimal Traffic Signal Settings
with Transit Signal Priority. In: Transportation Re-
search Board 94th Annual Meeting Washington D.C.
Ziaei, M., Goharpour, A., 2019. Performance Evaluation of
Tehran Bus Rapid Transport (BRT) Routes by the Two
stage Data Envelopment Analysis (DEA) Model. In:
IJRRAS, 38(1): 87-92.
Transit Performance Evaluation at Signalized Intersections of Bus Rapid Transit Corridors
625
