
Satoyama Forest Management Learning Game for SDGs Education:
Comparing the Effect of Providing Additional Information in the
First Half and Latter Half of the Game
Koga Yago
1
, Yukiya Shingai
1
, Wakana Kobayashi
2
, Ryota Aoki
2
, Yoshiaki Takeda
2
,
Fusako Kusunoki
3
, Hiroshi Mizoguchi
1
, Masanori Sugimoto
4
, Hideo Funaoi
5
, Etsuji Yamaguchi
2
and Shigenori Inagaki
2
1
Department of Mechanical Engineering, Tokyo University of Science, 2641 Yamazaki, Noda-shi, Chiba-ken, Japan
2
Graduate School of Human Development and Environment, Kobe University, Hyogo, Japan
3
Department of Information Design, Tama Art University, Tokyo, Japan
4
Graduate School of Information Science and Technology, Hokkaido University, Hokkaido, Japan
5
Faculty of Education, Soka University, Tokyo, Japan
Keywords: Science Education, Biodiversity, Environmental Conservation of Forests, Vegetation Succession.
Abstract: Conservation of biodiversity and the forest environment has become increasingly important in Japan because
it has been set as the 15th sustainable development goals (SDGs). In Japan, Satochi-satoyama is currently
drawing researchers’ attention from the perspective of learning about forests and biodiversity. However, there
are concerns that the biodiversity of Satoyama will soon deteriorate both in quality and in quantity due to the
decline in the population that manages it. Therefore, Satoyama management needs to be promoted through
education to continue sustainable development. The authors are currently developing a simulation game called
"Satoyama Management Game" to use it as an effective tool for learners to absorb in-game information about
Satoyama and learn about the process involved. In this paper, we discuss the experiments conducted to
investigate the effect of providing in-game information on learners and present its results.
1 INTRODUCTION
In recent years, educational activities focusing on
biodiversity conservation and forest environment
conservation have become increasingly important
because conserving terrestrial ecosystems has been
set as the 15th sustainable development goal (United
Nations, 2015).
In Japan, Satochi-satoyama is attracting attention
to learn about forests and biodiversity. Satochi-
satoyama refers to areas comprising farmlands,
irrigation ponds, secondary forests, plantation forests,
and grasslands that border human settlements. Even
before the SDGs were established, Satoyama has
been part of the rich culture of people coexisting with
nature through the use of recycled resources and
intervention in vegetation. The Satoyama landscape
serves as a valuable model of a nature-harmonious
society because it fosters the biodiversity of a
secondary natural environment created through
interaction between human activities and nature
(Takeuchi, 2020).
However, with the declining population, an aging
population, and changes in the industrial structure,
many Satoyama are exposed to major environmental
changes due to the reduced circulation of natural
resources with the exploitation of Satoyama forests
and wild grasslands. There are concerns that the
biodiversity of Satoyama will deteriorate in terms of
both quality and quantity (Ministry of the
Environment, Government of Japan, 2010). It is
necessary therefore to learn about Satoyama
management and continue Satoyama conservation
and sustainable development (Dublin and Tanaka,
2014).
Games have always been found to support
learning (Prensky, 2003) (Calderón and Ruiz, 2014).
Thus, various learning support games have been
developed to learn how to manage Satoyama and the
ecosystem. The Satoyama management game we
developed is a simulation game. Learners can
Yago, K., Shingai, Y., Kobayashi, W., Aoki, R., Takeda, Y., Kusunoki, F., Mizoguchi, H., Sugimoto, M., Funaoi, H., Yamaguchi, E. and Inagaki, S.
Satoyama Forest Management Learning Game for SDGs Education: Comparing the Effect of Providing Additional Information in the First Half and Latter Half of the Game.
DOI: 10.5220/0010473703470351
In Proceedings of the 13th International Conference on Computer Supported Education (CSEDU 2021) - Volume 1, pages 347-351
ISBN: 978-989-758-502-9
Copyright
c
2021 by SCITEPRESS – Science and Technology Publications, Lda. All rights reserved
347
experience simulating Satoyama management on a
longer time scale than usual, such as 10 or 100 years.
Kawaguchi et al. (2017, 2018) developed a
Satoyama management game in which learners
become Satoyama managers to learn Satoyama
management methods and vegetation successions.
We improved on the user interface of the Satoyama
management game and added in-game information
(Shingai et al., 2020). We conducted an experiment
on elementary school students and confirmed that the
improved user interface enhances the immersive
feeling of the game. However, the effect of adding in-
game information on learners' understanding was not
investigated.
We conducted an experiment to clarify whether
the in-game information added by Shingai et al.
(2020) enhanced learners’ understanding of
Satoyama. The results of the experiment confirmed
that the added in-game information was indeed
effective in promoting learners' understanding. The
results also indicated that presenting in-game
information after the learner has become accustomed
to the game would make the game more effective.
The remainder of this paper is organized as
follows. Section 2 describes the Satoyama
management game previously developed by us.
Section 3 describes the experiments performed and
their results, and Section 4 presents an evaluation of
the experimental results and the rationale. Finally,
Section 5 summarizes the main conclusions.
2 SATOYAMA FOREST
MANAGEMENT GAME
2.1 Overview of the Game
The simulation game developed can help learners
understand Satoyama management and vegetation
successions. In the game, learners can experience
Satoyama management on a time scale of 10 years or
100 years, which is not possible for ordinary people
to experience. Learners understand the difficulty of
maintaining a Satoyama environment and sustainable
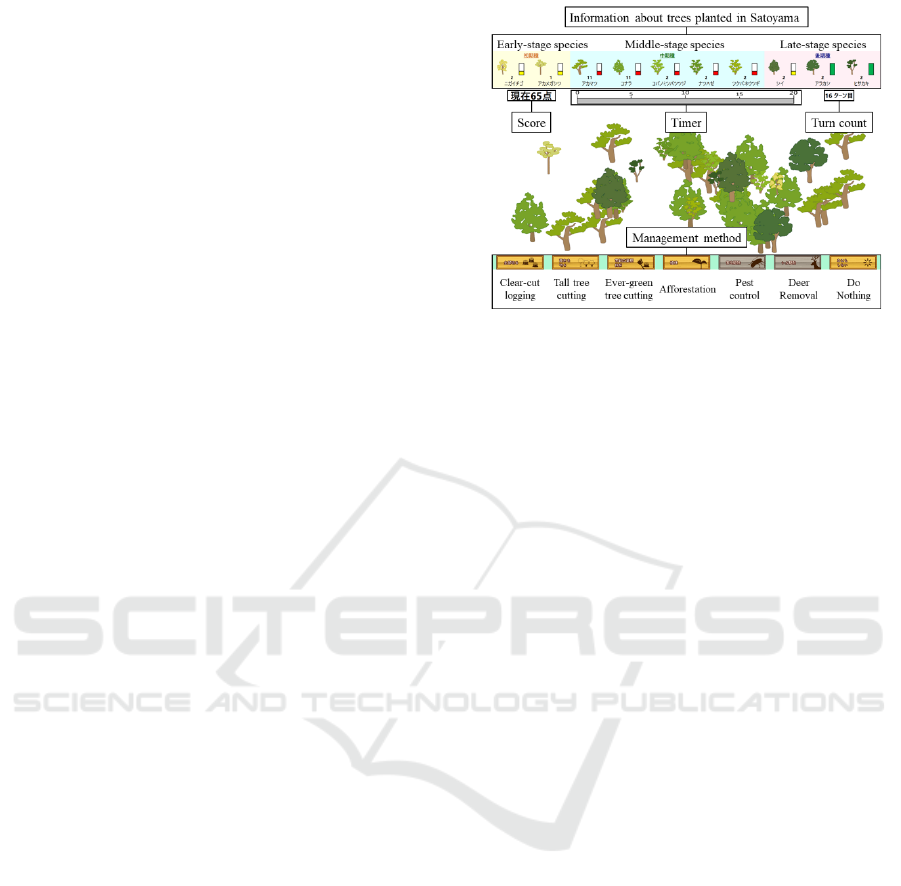
development. Figure 1 shows the play screen of the
Satoyama management game developed by us
(Shingai et al., 2020)
Learners manage Satoyama once per turn using
one of the six management methods mentioned at the
bottom of the screen. When converted to real time,
one turn manages about 15 years, and one game
manages Satoyama for 20 turns, which adds up to 300
years.
Figure 1: Play screen of Satoyama management game by
Shingai et al. (2020).
In the game, there are early-, middle-, and late-
stage types of tree species on the vegetation
succession of Satoyama. Each tree has different
characteristics, such as tree height, or pattern of
growth.
Learners aim to maintain an ideal Satoyama
environment by referring to the score displayed on the
upper left of the game screen. Scores of the game
ranged from 0 point to 100 points. The more ideal the
number and proportion of trees, the higher the score.
For 20 turns, the learner seeks the ideal tree ratio and
effective management methods. By repeating this
game, users can learn Satoyama management and
vegetation successions.
2.2 Additional In-game Information
In our previous research, we added a meter for the
number of trees and an information picture with the
characteristics of trees, as shown in Figure 2 and
Figure 3 (Kawaguchi et al., 2018) (Shingai et al.,
2020). This is important information for Satoyama,
but there has been no study to verify whether learners
are making good use of this information during play.
2.2.1 Information Picture
The information picture is displayed at the top of the
screen when the cursor hovers over each tree (Figure
2). In this picture, important information has been
written for the game, such as wood types and features.
Checking the information provided in the pictures
will help learners find appropriate Satoyama
management methods.
CSEDU 2021 - 13th International Conference on Computer Supported Education
348
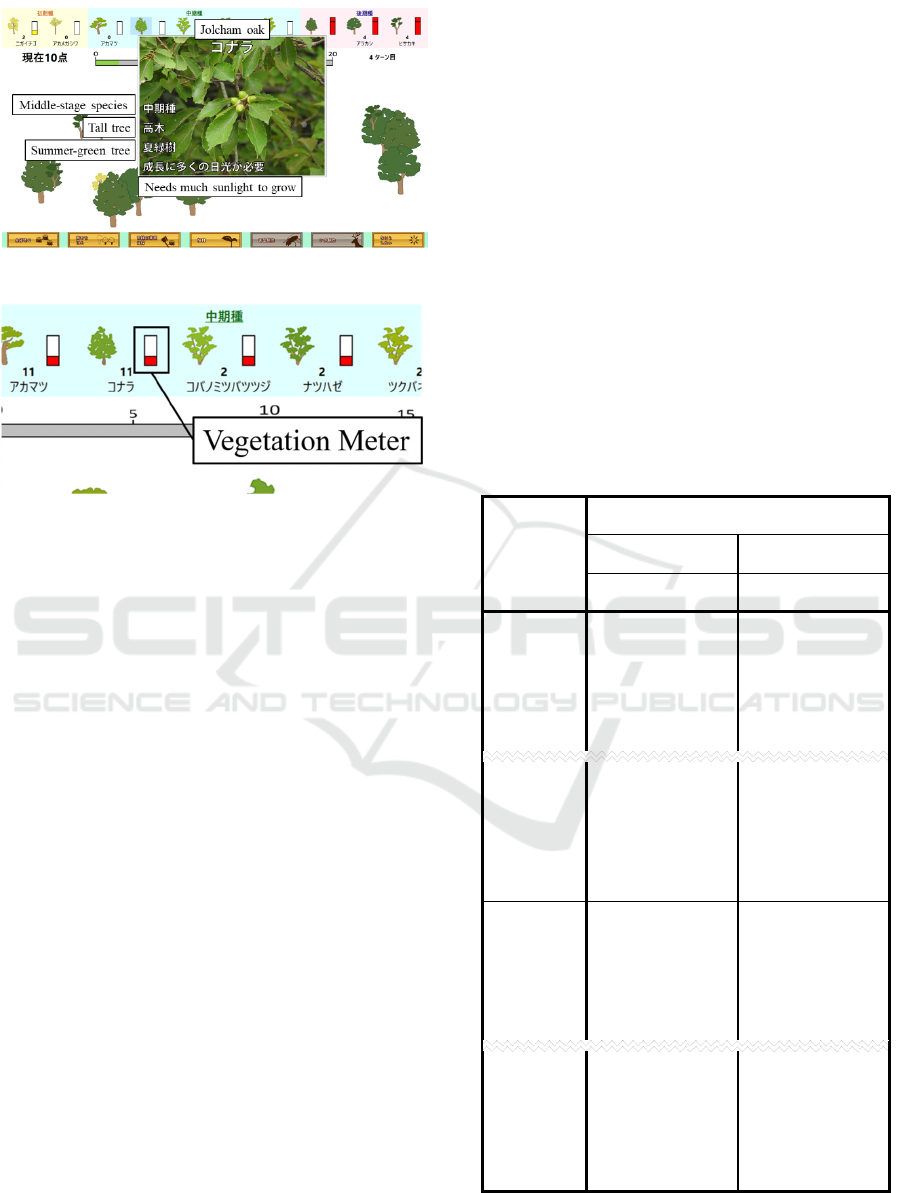
Figure 2: Information picture display.
Figure 3: Vegetation meter display.
2.2.2 Vegetation Meter
The vegetation meter shows whether there are many
or few trees (Figure 3). The early- and late-stage
species appear in red when the ideal number of trees
is exceeded, and the middle-stage species appear in
red when the number of trees is much smaller than the
ideal number. Learners are not aware of this
condition. Learners need to find the right percentage
of trees through the play.
3 EXPERIMENT
3.1 Experimental Design
The Satoyama management game experiment was
conducted over four days, from October 27 to
October 30, 2020. The participants in this experiment
were 22 students from the Tokyo University of
Science.
3.2 Experimental Method
To clarify whether in-game information helps
learners understand Satoyama, we prepared two types
of Satoyama management games: one with the
information added and the other without the
information mentioned above.
We assessed the level of understanding of the
participants from their scores when playing with and
without the added information. Further, to investigate
whether the timing of providing in-game information
affects the score of participants, we divided the
participants into two groups, A and B, and compared
the scores.
In the six rounds of the game played, Group A was
given the information in the first three rounds, and
Group B in the latter three rounds.
3.3 Experimental Result
Table 1 presents the summary of the final scores for
each round for each participant. Group A participants
were assigned numbers starting with A, and Group B
participants were assigned numbers starting with B.
For convenience, 16 out of 22 participants were
omitted, and only 8 were listed under each group.
Table 1: Final score for each round after 6 rounds.
Participant
Numbe
r
Final Score for Each Round
First Half Latter Half
1 2 3 4 5 6
A1 69 67 63 54 55 65
A2 57 62 60 31 37 35
A3 66 29 66 67 34 74
A4 45 14 56 54 64 77
A9 6 15 56 62 55 59
A10 30 34 29 30 41 58
A11 26 54 70 56 56 61
A12 32 60 47 45 68 59
B1 18 18 64 64 64 53
B2 41 70 66 78 69 65
B3 33 53 44 61 61 64
B4 69 75 72 70 72 56
B7 60 66 66 76 77 70
B8 47 67 70 62 74 63
B9 32 36 65 69 77 77
B10 56 65 44 55 65 55
Satoyama Forest Management Learning Game for SDGs Education: Comparing the Effect of Providing Additional Information in the First
Half and Latter Half of the Game
349
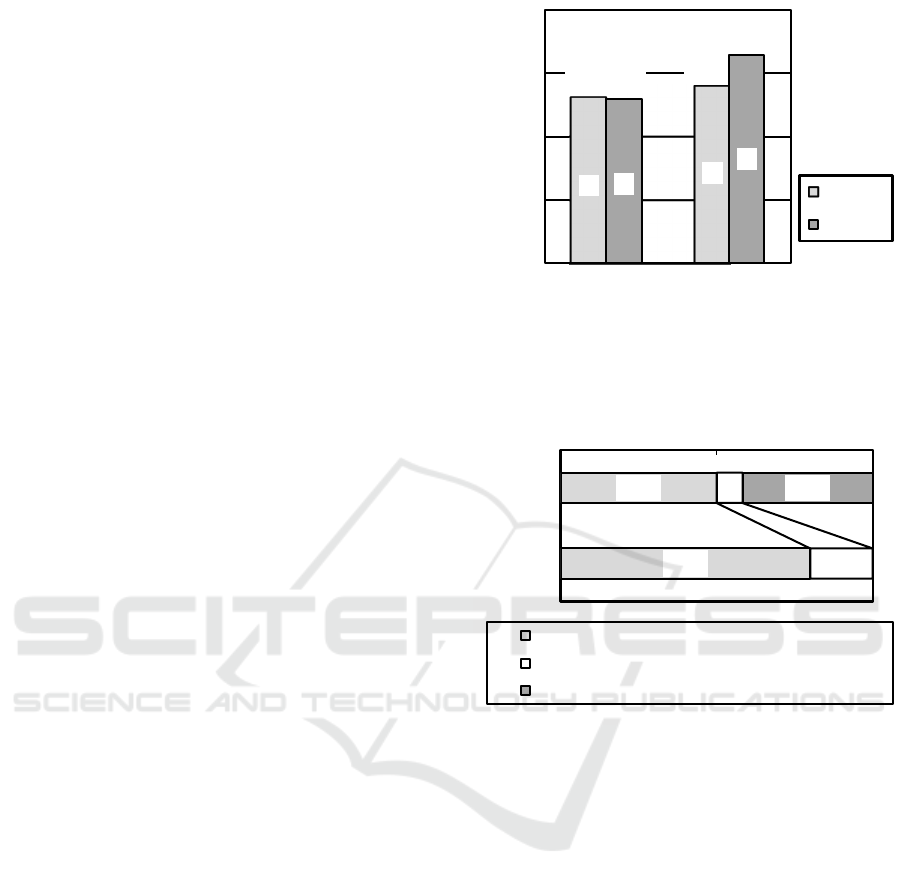
4 ASSESSMENT
The average score is calculated from the experimental
results shown in Table 1. We compared the results of
the first half and the latter half to assess the validity
of the additional information and compared the
results of each group to assess the impact of the
timing of giving information.
4.1 Assessing Effectiveness of
Providing In-game Information
Figure 4 shows the average scores of the participants
in the first half and the latter half. Figure 4 reveals that
there is almost no difference in the average points in
the first half of Group A and Group B. This implies
that learners are unaware about using the information
well in the first half. At the start of the game, learners
may not yet be accustomed to the game. On the other
hand, Group B’s scores improved significantly in the
latter half as information was added after getting used
to the game. Thus, it may be inferred that it is more
effective to provide information after learners have
become accustomed to the game.
4.2 Effect of the Timing of Providing
Information
We compared the average scores of each participant
in the first half and the second half and divided them
into those whose scores increased those whose scores
decreased. Participants whose scores had a difference
of less than 1 point were classified as almost
unchanged. Figure 5 shows the percentage of
participants whose scores showed an increase and
those whose scores showed a decrease in each group
According to Figure 5, 42% of Group A
participants showed a reduced score in the latter half
while in Group B, no decrease was seen in anyone’s
score. By playing the Satoyama management game
repeatedly, participants tended to increase their scores
(Shingai et al., 2020). These results lead us to
understand that the scores of Group A decreased
because of lack of information. Thus, it was
confirmed that in-game information is important for
increasing the scores. In other words, the added in-
game information is effective in helping learners
understand.
Figure 4: Comparison of average scores for the first half and
the latter half.
Figure 5: Percentage of participants whose score increased
and whose score decreased in each group.
5 CONCLUSION AND FUTURE
WORK
This paper describes how in-game information added
to the Satoyama management game of Shingai et al.
(2020) can help learners understand the process of
Satoyama management better. The experiment
performed on university students in playing the
Satoyama management game confirmed that the
learners' scores increased when presented with the
additional information. Further, if the information
were presented after learners got used to the game, it
was found to be more effective than if it were
presented at the start of the game.
In future, we aim to develop a system that can
infer missing information from learners' scores and
patterns of play and present the requisite information
on priority.
52,3
55,8
51,9
65,8
0
20
40
60
80
First Half
Average Score
Latter Half
Average Score
Score [point]
Group A
Group B
A
A
B
B
50%
80%
8%
20%
42%
0% 50% 100%
Group A
Group B
Score Increased (First Half < Latter Half)
Almost Unchanged (First Half ≒ Latter Half)
Score Decreased (First Half > Latter Half)
CSEDU 2021 - 13th International Conference on Computer Supported Education
350

ACKNOWLEDGMENTS
This work was supported by JSPS KAKENHI, Grant
Number JP19H01734.
REFERENCES
Calderón, A., & Ruiz, M., 2014. Bringing Real-life Practice
in Software Project Management Training Through a
Simulation-based Serious Game. In Proceedings of the
6th International Conference on Computer Supported
Education (CSEDU2014). Vol. 2. Barcelona, Spain,
April, pp. 117-124.
Dublin, R., & Tanaka, N. 2014. Indigenous agricultural
development for sustainability and “Satoyama”
Geography, Environment, Sustainability, 7(2), pp. 86-
95.
Kawaguchi, S., Sakai, T., Tamaki, H., Mizoguchi, H.,
Egusa, R., Takeda, Y., Yamaguchi, E., Inagaki, S.,
Kusunoki, F., Funaoi, H., Masanori, S., 2017.
SATOYAMA: Time-limited decision game for
management. In Proceedings of the 9th International
Conference on Computer Supported Education
(CSEDU2017). Springer International Publishing. New
York, vol. 1, April, pp. 481-486.
Kawaguchi, S., Mizoguchi, H., Egusa, R., Takeda, Y.,
Yamaguchi, E., Inagaki, S., Kusunoki, F., Funaoi, H.,
Masanori, S., 2018. A forestry management game as a
learning support system for increased understanding of
vegetation succession- effective environmental
education towards a sustainable society. In Proceedings
of the 10th International Conference on Computer
Supported Education (CSEDU2018). vol. 1.
SciTePress. Setubal, Portugal, March, pp. 322-327.
Ministry of the Environment, Government of Japan, 2010.
Action plan for the conservation and sustainable use of
socio-ecological production landscapes (Satochi-
satoyama), Government of Japan. Tokyo, Japan.
Prensky, M., 2003. Digital game-based learning.
Computers in Entertainment (CIE). Association for
Computing Machinery. vol. 1, No.1. New York,
October, pp. 1-4.
Shingai, Y., Aoki, R., Takeda, Y., Kusunoki, F.,
Mizoguchi, H., Sugimoto, M., Funaoi, H., Yamaguchi,
E. and Inagaki, S., 2020. Learning Support Game
System for Sustainable Development Goals Education:
Effects of Improved User Interface on Satoyama Forest
Management Learning. In Proceedings of the 12th
International Conference on Computer Supported
Education (CSEDU 2020). vol.1, SciTePress, Virtual,
Online, pp. 428-435.
Takeuchi, K. (2010). Rebuilding the relationship between
people and nature: the Satoyama Initiative. Ecological
research, 25(5), pp. 891-897.
United Nations, 2015. Transforming our world: The 2030
agenda for sustainable development, United Nations.
New York.
Satoyama Forest Management Learning Game for SDGs Education: Comparing the Effect of Providing Additional Information in the First
Half and Latter Half of the Game
351
