Implementation of IoT, Wearable Devices, Google Assistant and
Google Cloud Platform for Elderly Home Care System
Jung-Tang Huang
1
, Li-Ying Chang
1a
and Hsin-Chang Lin
2b
1
Department of Institute of Mechatronic Engineering, National Taipei University of Technology, Taipei, Taiwan
2
Department of Institute of Mechanical and Electrical Engineering, National Taipei University of Technology, Taipei,
Taiwan
Keywords: IoT, Cloud, GCP, Wearable Devices, Data Analysis.
Abstract: The purpose of this research is dedicated to designing the care system. By using Google assistant speaker,
various sensors, web page, and cloud data processing to design an Internet of Things environment combining
health information and various parameters to improve the quality of the care system. We use wearable devices
to transmit physiological information, then collect data through Bluetooth sensors and upload them to the
database via edge devices. At the same time, it monitors unusual values at any time. Then, it notifies users
through google assistant to trigger Google Home System. We carry out cloud data analysis and optimize
dialogue patterns by obtaining physiological information, escorting services, recording conversations, and
other forms of active questioning. Through using conversation feedbacks as data, we can also generate simple
data analysis, fill out various questionnaires by using the web pages. With this complete care system, the
cloud data is integrated and networked to provide a better care system for the elderly.
1
INTRODUCTION
The Internet of Things means that there is a large
number of composite data through statistics and
analysis, which can get relevant information that was
previously ignored by a single data. Conducting to
solving problems in various fields such as smart home
care, this research focuses on providing services
between smart homes and elderly care, by using the
data collected from the sensor and Google Home
System to perform a series of verification, processing,
classification, storage, statistics, and visualization on
the data for the user or their caregiver. Those data can
help them to make plans for improving their health.
The main purpose of the Internet of Things
application is to provide humanized services, making
family life more comfortable, safe and energy-
efficient, and processing some of the more
burdensome computing by the cloud, which can
quickly adapt to changing loads. Therefore, the
integration of smart homes into the cloud and
obtaining more information from the cloud will help
provide more humanized services. This is the goal of
a
https://orcid.org/0000-0001-5655-2048
b
https://orcid.org/0000-0002-6457-712X
smart homes for IoT applications now (Haijun Gu,
Yufeng Diao, Wei Liu, and Xueqian Zhang, 2011).
The services provided by the smart home can be
roughly divided into many types (Xiaojing Ye and
Junwei Huang, 2011). (1) Environment: air-
conditioning, water, lighting. (2) Safety: fall, injury,
and break in. (3) Entertainment: TV, stereo. (4)
Electrical appliances: Recipe suggestions, automatic
cooking, cleaning, refrigerator inventory. (5)
Message and communication: alarm, home calendar,
remote control. (6) Health: behavior, medication,
sleep, etc. In response to demand, well-known
companies such as Google, Amazon, Microsoft, IBM,
etc. have all proposed SaaS (Software as a Service),
PaaS (Platform as a Service), and IaaS (Infrastructure
as a Service). This research is to develop PaaS among
them, establish a service-oriented cloud computing
architecture and provide users with SaaS. Users can
use our existing services through simple settings. In
reference (M. M. E. Mahmoud et al., 2018), there is a
new term named COT (Cloud of Things), after
integrating the cloud and IoT, all IoT devices can be
accessed through the cloud as a service, the role of the
cloud in COT is a middleware between things, this
Huang, J., Chang, L. and Lin, H.
Implementation of IoT, Wearable Devices, Google Assistant and Google Cloud Platform for Elderly Home Care System.
DOI: 10.5220/0010473102030212
In Proceedings of the 7th International Conference on Information and Communication Technologies for Ageing Well and e-Health (ICT4AWE 2021), pages 203-212
ISBN: 978-989-758-506-7
Copyright
c
2021 by SCITEPRESS – Science and Technology Publications, Lda. All rights reserved
203
research on health services is still focused on individual
sensor values. As the result, it cannot clearly
understand the impact of external factors on users.
In this study, with Bluetooth devices as the main
body, we integrate indoor positioning services, and
various interactive devices as the collocation mesh
network of Bluetooth nodes which are used to upload
data to the cloud. In order to help elderly easier to use
the system, we use Google Home Nest Mini to notify
abnormal physiological signal from the wearable
devices and design dialog system to give them
advices about health. At the same time, we record
these conversations to help doctors or their
caregivers. On the other hand, doctor or their
caregiver can monitor, remotely control and obtain
statistical behavior information by web in real time.
Unlike reference (D. C. Yacchirema et al., 2018),
with a long-term behavioral record, it is possible to
understand what bad habits may cause problems
before getting sick and be proactively alerted.
Medical information and long-term behavioral
records help us to find out what the real causes are.
2
IOT SYSTEM ARCHITECTURE
2.1 System Architecture Level
The system combined light source devices and
Bluetooth devices. It uses wearable devices and fixed
sensors for positioning tracking, activity monitoring,
behavioral mode judgment, and fall notifications. By
building a network with each other through Bluetooth
wireless communication technology, sensors can
automatically sense and count data. The Bluetooth
mesh network pushes the data to the terminal and
uploads data to the cloud by Wi-Fi and stores data in
the cloud database. This system has 3 ways to notify
or show data for users, web interface, asking for
information from Google Nest Mini or notifying
messages by using Raspberry Pi.
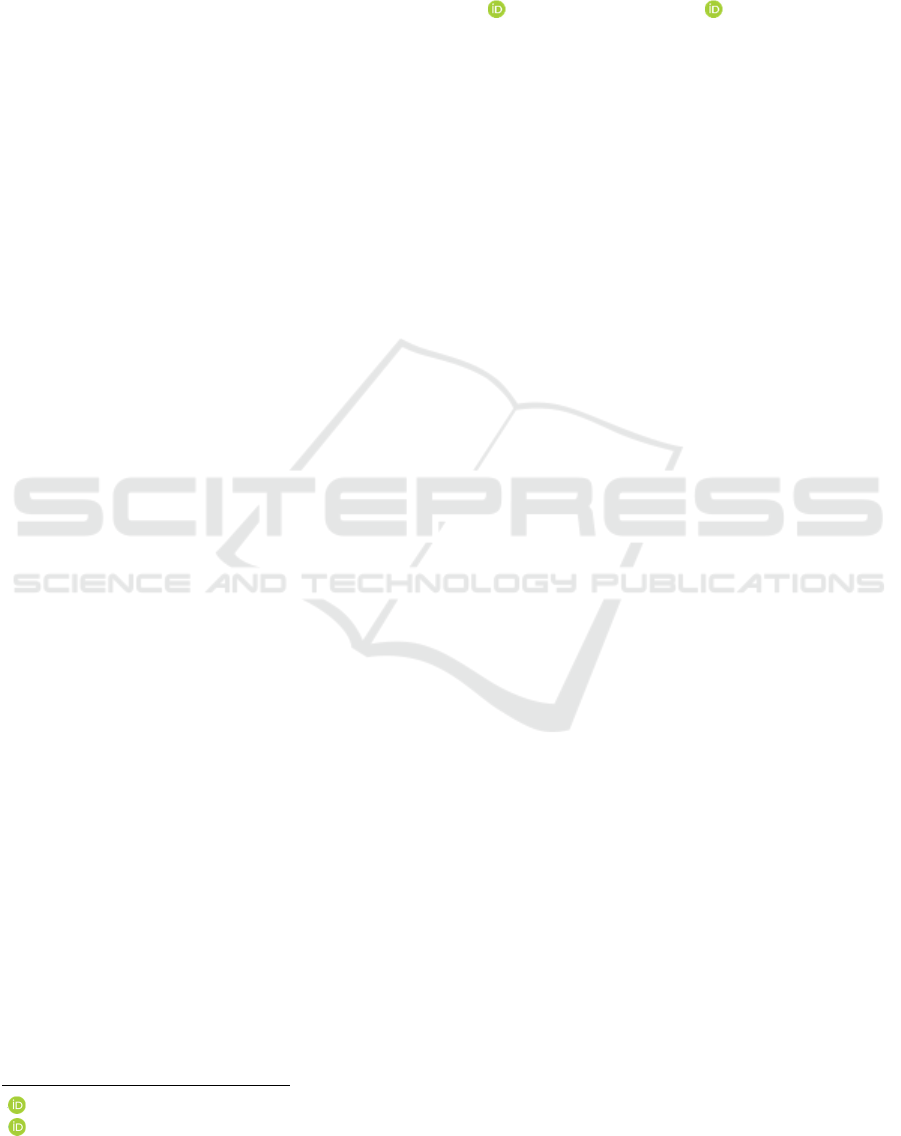
The IoT system architecture is mainly divided into
six levels. The architecture diagram is abstractly
presented in “Figure 1”.
2.2 Wearables and Fixed Devices
The sensors of this system are wearable devices, fixed
devices, and Google Home Nest Mini.
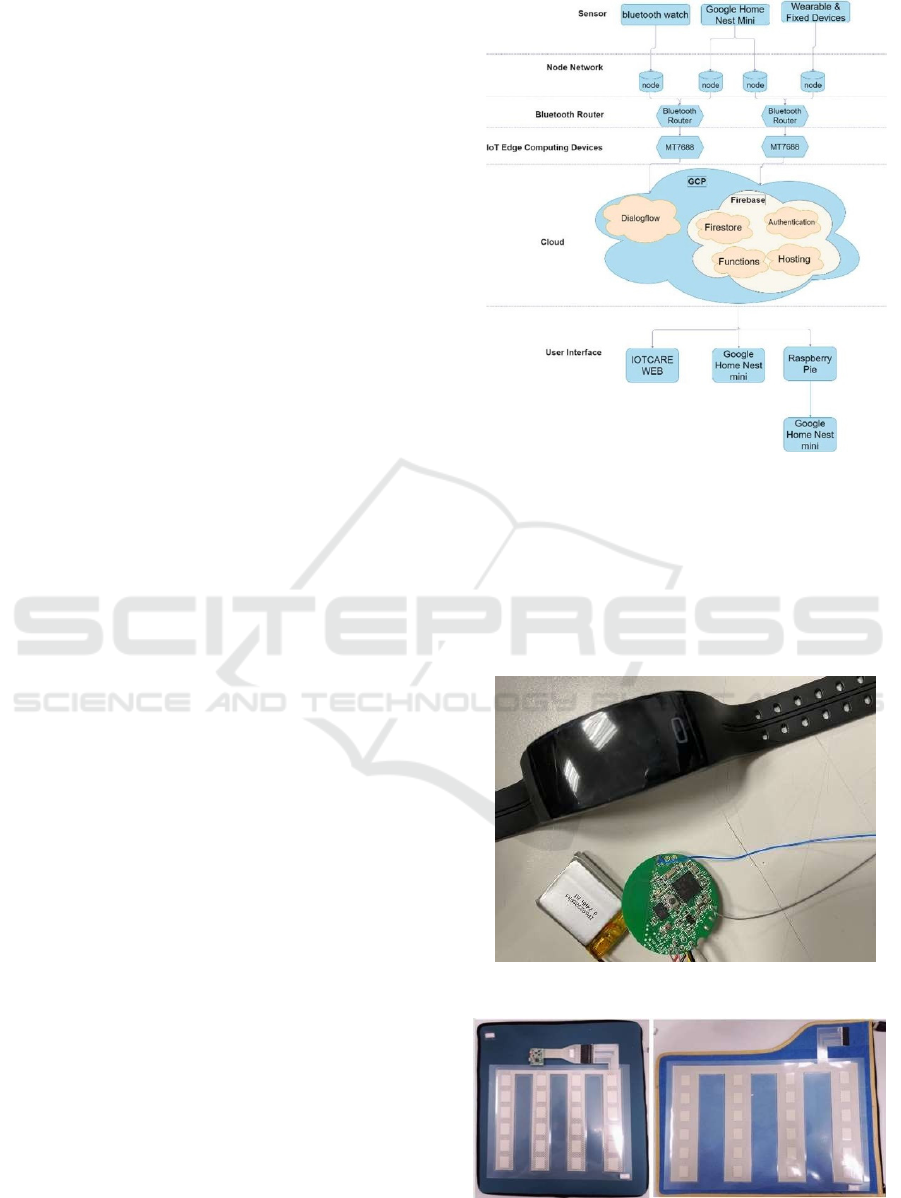
Wearable devices are Bluetooth watch and
Bluetooth tag, as shown in “Figure 2”. Bluetooth
watch uploads physiological data, like heart beat rate
per minute. The Bluetooth tag is designed to detect
the user's movement and their location.
Figure 1: System architecture hierarchy diagram.
Fixed sensor means contact sensors and Google
Home Nest Mini. They both are triggered by a person.
The difference is the way how to trigger them. As
shown in “Figure 3”, such as magnetic reed switch,
seat cushions and pedal mats, they are triggered by
physical contact. And Google Home Nest Mini is
triggered by audio messages from user.
Figure 2: Bluetooth watch and Bluetooth tag.
Figure 3: Contact sensor, cushion (left), step cushion
(right).
ICT4AWE 2021 - 7th International Conference on Information and Communication Technologies for Ageing Well and e-Health
204
Google Home Nest Mini is running based on GCP
services that help us to create dialog system to process
audio messages. In the processing, it can classify
different dialog intents, events, responses and
records. On the other hand, the design of the smart
seat cushions and pedal mats uses silicone rubber as
the dielectric material. Through the calibration
algorithm, the capacitance value is converted into the
corresponding pressure for comparison and analysis
to determine the sitting posture, for example, normal
sitting, forward, left, right. By recording the position
of the center of gravity of the posture and analyze its
proportion, it may correct the elderly's sitting posture
to avoid scoliosis and elderly falling.
2.3 IOT Edge Computing Device
An edge computing device is located on the edge be-
tween two networks. Edge computing is the
decomposition of large services that were completely
processed by the data center through cutting the service
into smaller and more manageable parts, scattered to
the edge nodes for calculation (W. Shi et al., 2016).
Edge computing can speed up data processing and
transmission speed, reduce network latency. Under
such a structure, the analysis of data will be closer to
the source of the data, so it is more suitable for
processing a large amount data collected by sensors.
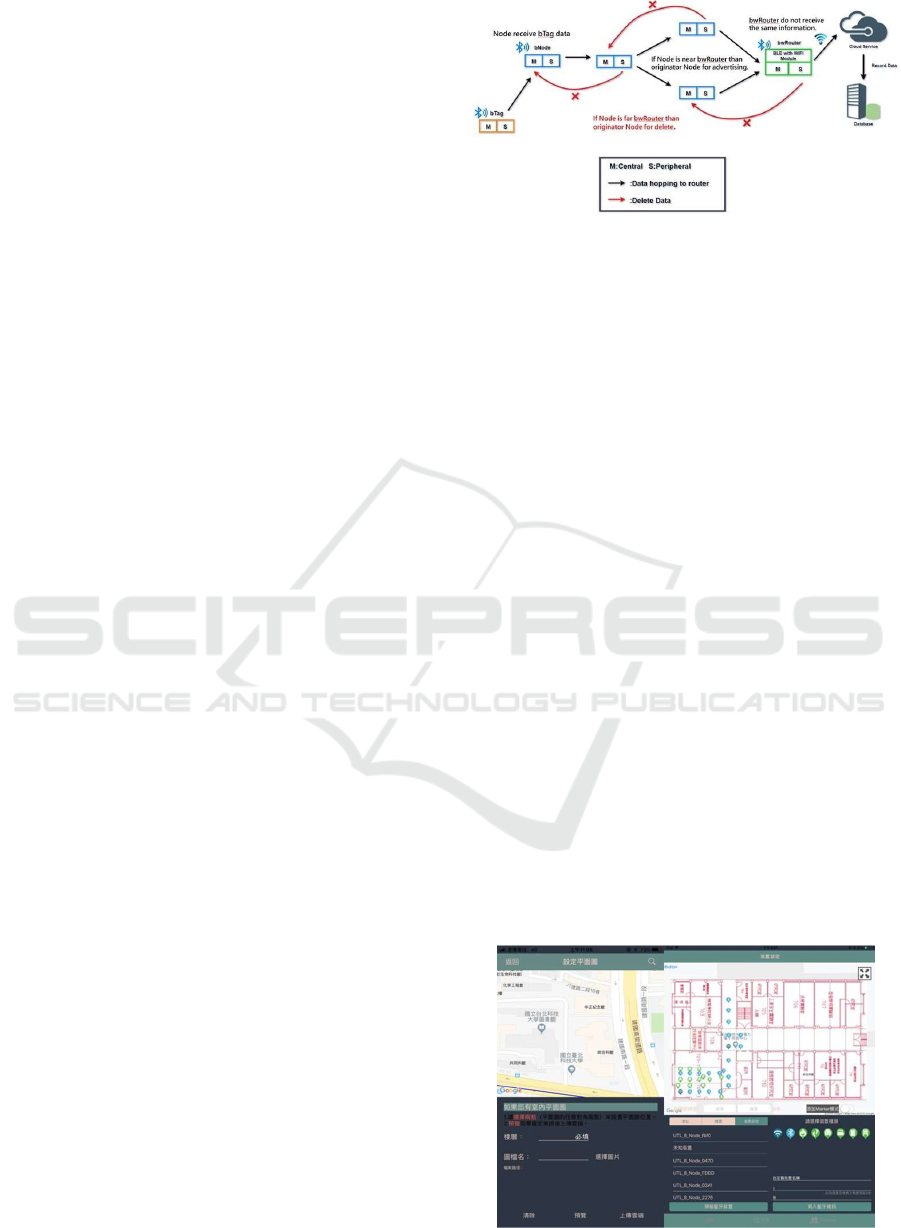
2.4 Bluetooth Mesh
The Bluetooth mesh network is constructed by many
bNodes and a bwRouter. The Node device is
equipped with two Bluetooth roles central (Master)
and peripheral (Slave). The former will scan the
broadcast channel at 20 ms intervals, and only receive
our proprietary protocol. Master is transmitted the
data of the communication protocol to the slave
station through the UART communication interface.
The latter is in addition to provide broadcast location
packets for wearable device positioning, the data sent
by the host will be considered as priority forwarding
data. The data will be continued to send to the next
bNode until the master scans its own return packet
and notifies the slave device to stop broadcasting.
This design not only ensures that each piece of data
reaches the next bNode, but also reduces end-to-end
latency. Based on this design, it can build a Bluetooth
mesh network. “Figure 4” is describe the bNode
workflow among multiple bNodes.
The bwRouter consists of Bluetooth and
Raspberry Pi. It inherits the bNode function, and also
it is the top layer of the Bluetooth mesh network. It
acts as a communication bridge between BLE and
Figure 4: bNode upload and transfer process
Diagram.
WIFI. BLE uses the UART communication interface
to send data to the Raspberry Pi, and then uploaded to
the cloud via WIFI for data storage and analysis. The
bwRouter can send acknowledgement to the bNode
or send commands to the lower-layer devices of the
BLE mesh network to implement a two-way
transmission system.
2.5 BLE Initial Setting
Mobile phone application plays a role of setting
terminal as shows in “Figure 5”. The system uses
Android and IOS phones as the main mobile devices.
Bluetooth mesh networks use a method called
"Flooding" to publish and relay messages. In order to
let Flooding have direction, the mobile phone
establishes a connection between the bNode,
bwRouter and the fixed devices and write the
information. This information is obtained from the
Google Map in mobile phone application where gives
the absolute position to itself and let each bNode
know the location of the bwRouter, and then writes
the mesh group to each bNode. This method provides
bNode master judging bwRouter distance and makes
the data transmission directional. In addition to
setting the latitude and longitude, it can also divide
the area, such as restaurant, bathroom, living room,
balcony and kitchen.
Figure 5: IOS APP setting interface.
Implementation of IoT, Wearable Devices, Google Assistant and Google Cloud Platform for Elderly Home Care System
205
3
CLOUD SYSTEM
ARCHITECTURE
This research uses some of the cloud capabilities of
Google Cloud Platform such as Web development
framework, related development tools and Google
Home Nest Mini. In order to store personnel indoor
positioning and behavior data collected by sensors
into the NoSQL database for web and APP request,
batch output historical data, output statistical reports
through data ETL (Extract-Transform-Load), analyze
of elderly behavior, and push messages through social
media and smart speakers (Google Home Nest Mini).
It can analyze elderly behavior, and push messages
through social media and smart speakers (Google
Home Nest Mini). There will be detailed introduction
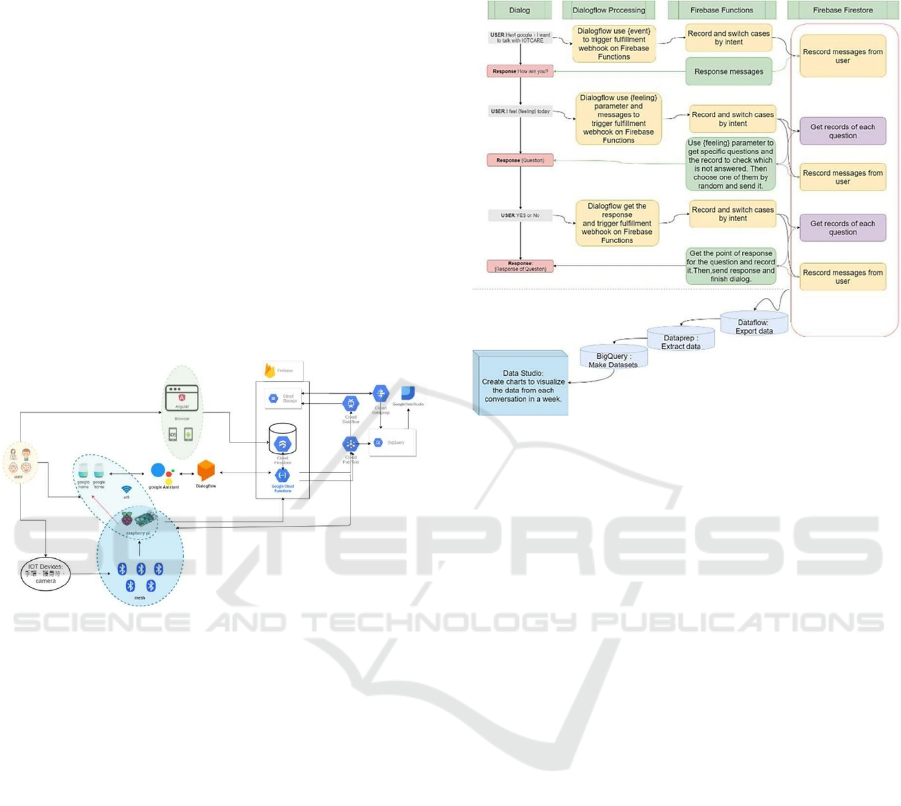
and description below. The cloud architecture
diagram of this system is shown in “Figure 6”.
Figure 6: Cloud system architecture diagram.
In this system, we use Google Home Nest Mini in
many ways, such as notify user, company with user
by messages and record messages about geriatric
depression scale (Keelung City Government,2017) to
take care of their health. The dialog flow is shown in
“Figure 7”.
At the beginning, users use their voice to awake
Google Home Nest Mini and it will response “How
are you?”. If users keep talking with Google Home
Nest Mini, it will take those messages to trigger
Firebase Function that Firebase Function will save
messages to Firebase and push messages to Google
Home Nest Mini. In “Figure 7”, we take problems in
Geriatric Depression Scale (Keelung City
Government, 2017) for example. When user tell it
their “feeling”, it will trigger Firebase Functions to
collect the questions by “feeling” and respond a
random question in the questions. Then users answer
the question, Firebase functions will save messages,
score each answers and push messages back to
comfort users.
In order to collect the messages, we coded lots of
functions and designed different conversation
templates to create each dialog flow in Google Home
Nest mini.
Figure 7: Dialog process in Google Home.
3.1 Angular Framework
It is one of the UI service webpages in the system. In
order to efficiently make the data collected by a large
number of IOT sensors responded to users in real
time, this research uses Angular to build a client
application platform. Dialogflow
3.2 Dialogflow
Dialogflow is a natural language understanding
platform that makes it easy to design and integrate a
conversational user interface into mobile app, web
application, device, bot, interactive voice response
system, and so on. Using Dialogflow, we can provide
new and engaging ways for users to interact with
Google Home Nest Mini.
Dialogflow can analyze multiple types of input
from user, including text or audio inputs (like from a
phone or voice recording). As the result, we can use
it to design dialog and set fulfiilment webhook with
Firebase Functions that we can program those
parameters, give response to Google Home Nest Mini
and upload data to Firebase Firestore.
3.3 Actions on Google
Actions on Google is the developer platform for
creating conversational apps for the Google Assistant
and publishing them to Google Home, Android, the
ICT4AWE 2021 - 7th International Conference on Information and Communication Technologies for Ageing Well and e-Health
206
Google Assistant app on iPhone, and beyond.
It is used to deploy our application on Google
Home Nest mini and manage with different GCP
services.
3.4 Google Home App
The Google Home app helps us to set up and control
Google Nest, Google Home, and Chromecast devices.
We can control thousands of compatible lights,
cameras, speakers and more, all from a single app, as
well as check reminders and recent notifications.
Google Home app also help us to get wifi mac
address to set up Raspberry Pi, distinguish different
devices and use voice-match with g-mail to login
user.
3.5 Cloud Functions for Firebase
Because the user interface of this system includes
web pages, Android IOS APP and Google Home Nest
Mini. User often adds, deletes, modifies, and queries
structural fields at the same level of the object
database to unify specifications, development and
maintenance. The operation of the database at the
application layer of this system adopts the same API
specifications.
This service allows developers to deploy back-end
environments, code to cloud services, eliminate the
need to set up, maintain, expand, manage, and
provide services endlessly.
3.6 Cloud Firestore for Firebase
Firestore is a flexible and extensible NoSQL database
that can synchronize data between client applications
through a real-time listener, and provide offline
support for APP and web applications. Whenever the
data that the client application is listening to changes,
the system will notify through a snapshot of the data
and only retrieve the new changes. By employing
Firestore we can modify the database only in response
to new physiological data in the care system, without
tthe need to significantly reset and modify the entire
system back end. At the same time, it has the ability
to trigger events on the database backend. When the
sensor collects new data, the front end web page and
app screen can be actively updated by the back end,
without the front end actively refreshing, significantly
reduce the use of front end performance, and can load
a larger amount of IOT care sensor data for
visualization.
3.7 Cloud Storage for Firebase
The storage space of this system is not only for
accessing media files such as images, audio, video,
etc. Compared with well-known cloud storage spaces
such as Google Drive, cloud storage can be more
flexible in choosing plans such as charging and data
retention time based on usage. And there are multiple
SDKs to easily integrate different systems. At the
same time, the follow-up of this research will
introduce how to extract and transpose the Firestore
object data for analysis later. Cloud storage can be
flexibly integrated with other cloud services without
unnecessary development costs, and it can
synchronize the organized data to cloud storage.
3.8 Cloud Pub/Sub
The publish & subscribe mode is an instant
messaging service that allows information to be
transferred between different applications.
3.9 Cloud Dataflow
Dataflow is a fully-hosted, high-speed, integrated
streaming and batch data processing service that
minimizes latency, processing time, and costs by
automatically scheduling resources and batch
processing functions. In addition, there is no need to
rely on a server when deploying and managing
resources, so this research uses the Dataflow service
to subscribe to the pubsub topic to extract and convert
each history record in the database into a json file and
store it in cloud storage for subsequent data
transposition.
3.10 Cloud Dataprep
Cloud Dataprep is a smart data service that uses a
visual interface to easily explore, clean, and prepare
structured and unstructured data for data analysis,
reporting, and machine learning operations.
In this research, Dataprep was used to
automatically convert the data extracted by dataflow,
format, clean, label, and combine the live data of
different objects collected by fixed devices and
wearable devices so that subsequent research can
focus on analyzing the data.
3.11 BigQuery
BigQuery is a serverless enterprise data warehousing
service from Google that not only has high scalability,
but also excellent cost-effectiveness, which can help
Implementation of IoT, Wearable Devices, Google Assistant and Google Cloud Platform for Elderly Home Care System
207
improve our data analysis work efficiency (O.
Dawelbeit and R. McCrindle, DC, 2016).
BigQuery is based on a custom schema and data
from object storage and spreadsheets, thus it can
create a logical data warehouse, and analyze all batch
and streaming data. In this study, batches of table data
in the custom view model format were transferred
from Dataprep to BigQuery for large-scale IOT
device data streaming storage and analysis.
3.12 Cloud Data Studio
This research uses Google's data visualization tool
Cloud Data Studio, which is a system’s big data
statistics report UI service, to create custom
visualizations by turning data into compelling visual
content and reports. We link Data Studio to a
BigQuery by transposing dataset in advance via
Cloud Dataprep. With BigQuery BI Engine the
system can get analysis in a very short time.
4
EXPERIMENTAL STEPS AND
DATA
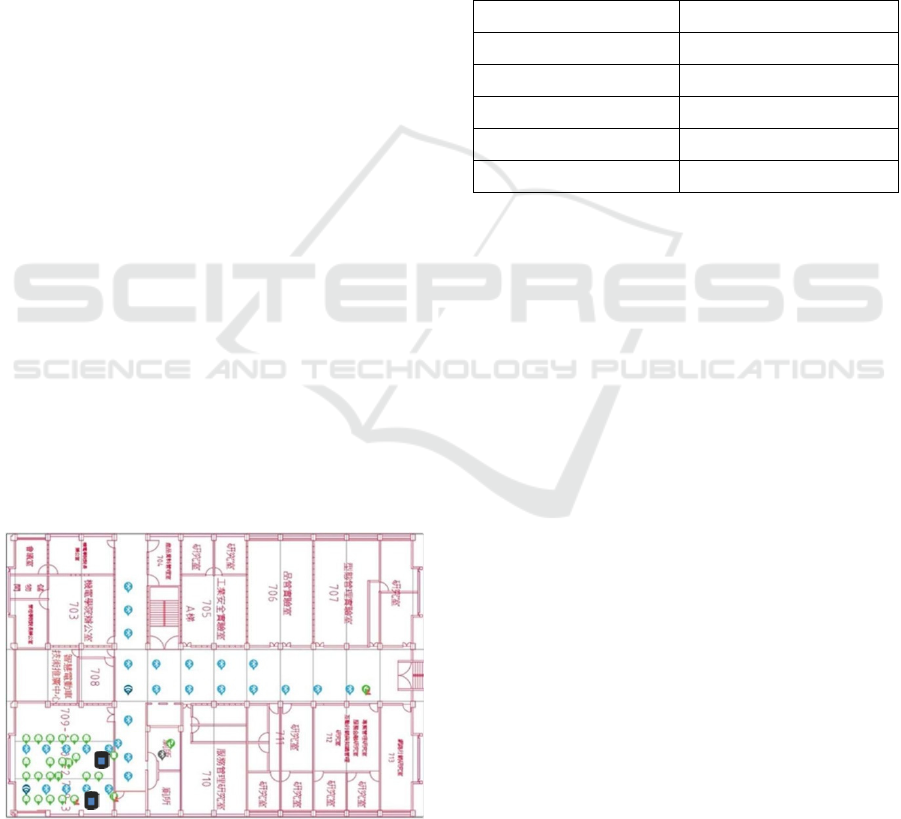
4.1 Experimental Field Environment
The experimental field is a 45 x 31 meters area
located on the 7th floor of the Tzung-He hall, which
is in the National Taipei University of Technology.
The 31 Bluetooth light source devices (bNodes) are
subordinated as shown in “Figure 8”. Google Home
Nest Mini are set in the center of room 709-2 and 709-
3. Experiments were conducted every day for 10 days
from 1:00 to 6:00 pm, and data on personal behavior
patterns were recorded in the database.
Figure 8: Experimental field plan & bNode installation
location.
In this experiment, we obtained a total of 11938
row data of tag-records of mobile devices; a total of
10594 row data of device-records; 200 row data of
people-records; 250962 raw data of Bluetooth watch
records; and test the Google Home Mini by using
13504 unusual data. The statistics are shown in
Table.1. As People-records is an individual's
behavioral statistics for the day, there will be only one
piece of historical data per day.
The design of the experimental data objects and
the meaning they represent will be explained in the
next paragraph.
Table 1: 10-day experimental data quantity.
Data field Numbers of row data
Tag-records 11938
Device-records 10594
People-records 200
Bluetooth watch records 250962
unusual data 13504
4.2 Data Model Design
This system database is mainly based on Firestore.
The data structure design concept is permission
security, optimized query, and reuse. “Figure 9” is the
Firestore database object design diagram which is
presented in the form of a multi-tree. The following
are the object structure nodes definition:
Personal-account: Record user account, phone,
permissions, device password and setup time, user
information covers individuals and organizations.
Locations: Record one or more addresses.
Floors: Inherit the address information of the
previous layer, multiple floor information,
including the latitude and longitude of the floor
boundary and the floor plan of this floor.
Devices: Inherit the information of the previous
floor and records the current status of the fixed
devices on this floor. The fixed device
information includes fire detection devices, seat
cushions, pedal mats and reed switches, etc.
Devices-records: Inherit a fixed device whose
content is the contact history information of this
device.
Mobile-devices: To this end, the user's mobile
phone or tablet records the alias that the user gives
to this tablet or mobile phone and the necessary
ICT4AWE 2021 - 7th International Conference on Information and Communication Technologies for Ageing Well and e-Health
208
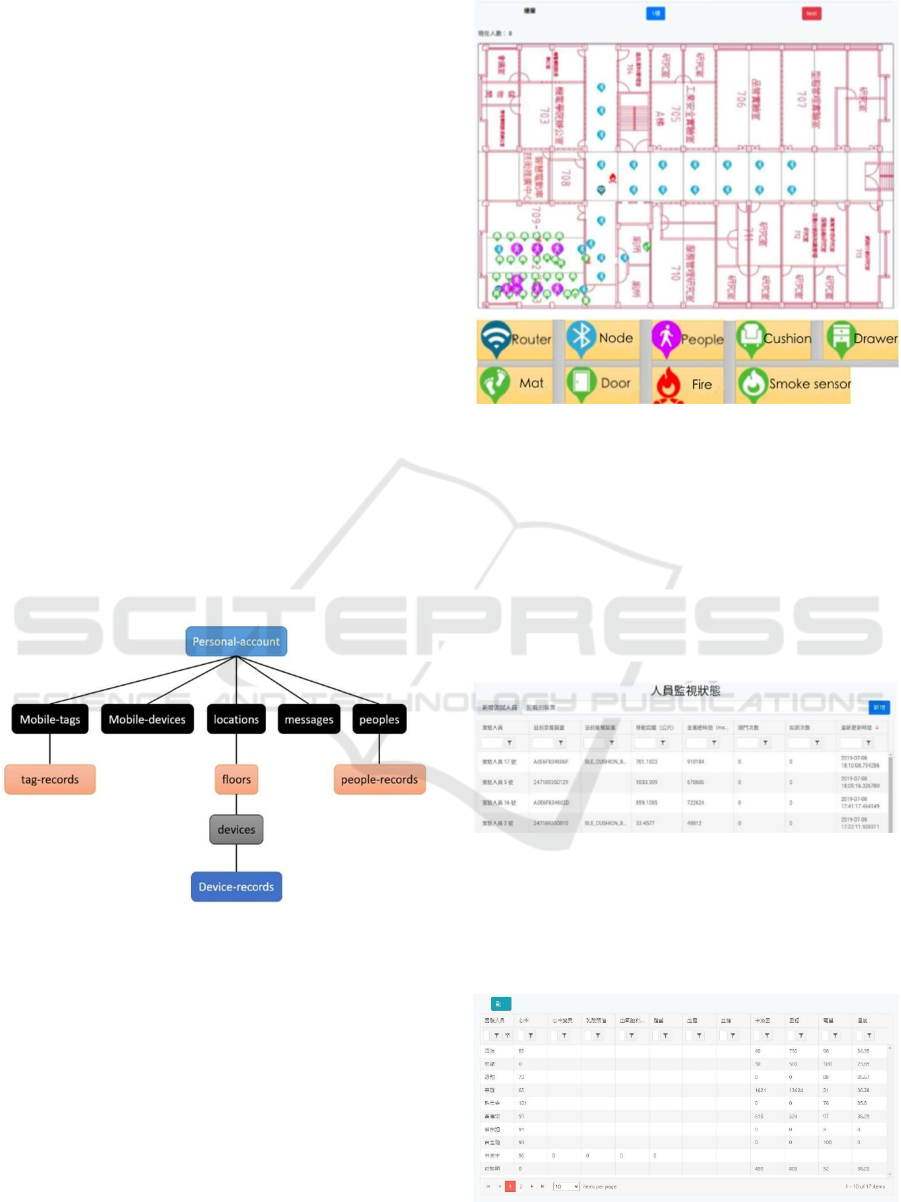
information for the push function.
Mobile-tags: This is a wearable device. The
current wearable device of the system is a
bracelet, a fixed device that records the current
address, floor, movement and contact of the
bracelet.
Tag-records: Record historical information from
the previous wearable device and contains
positioning latitude and longitude information.
Messages: It records the content of the message
from the web, APP or Google Home Nest Mini,
the source informations.
Peoples: As mentioned in the personal-account,
users can be divided into individuals and
organizations. When the user is an individual, this
node records the current user or the user's family,
their current behavior and the wearing device.
Nodes record the behavior, physical data, and
messages of current employees or caregivers from
Google Home Nest Mini and the devices they
wear.
People-records: The inherited parent node records
the historical information of a person's behavior
physical data, and messages.
Figure 9: Firestore data structure design.
4.3 Web Monitoring Status
The web is mainly divided into monitoring equipment
status, personnel status, and equipment status.
Through the webpage, we can instantly monitor the
position of personnel and the status of related
equipment. “Figure 10” presents indoor positioning
information. When an event (fall, fire, break-in, etc.)
occurs, the user's location information and floor
information can let relevant personnel know.
If the wearable device paired with a related
device, after the data is uploaded to the cloud, the
Figure 10: Real-time indoor infographic.
user's information will be integrated to know which
device the user interacts with, environmental
variables are obtained as well, and then keep track of
all the above information. That is the user's time,
position, and behavioral data are continuously
recorded in the database. From “Figure 11”, we can
know that the real-time information of the wearers on
the day, the currently worn device, and the currently
contacted device.
Figure 11: Real-time indoor infographic.
In order to help user, there is also charts and data.
From “Figure 12”, we show every users physical data,
such as blood pressure, temperature and heart beat
rate, in real time.
Figure 12: Real-time physical data.
Implementation of IoT, Wearable Devices, Google Assistant and Google Cloud Platform for Elderly Home Care System
209
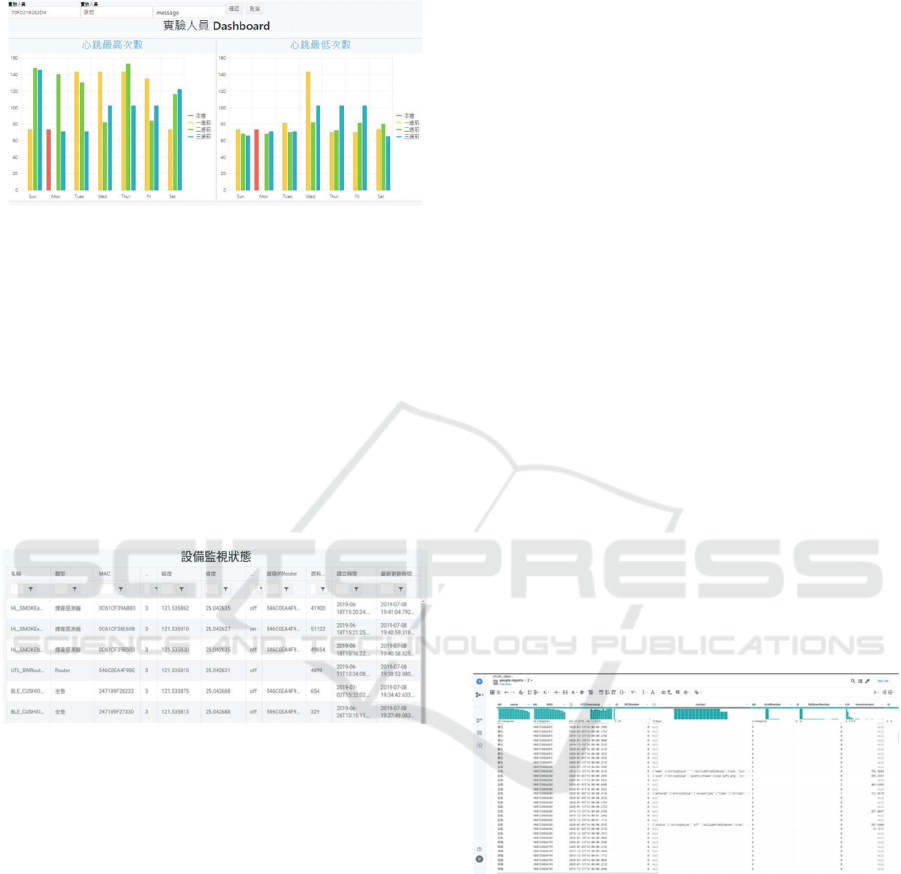
And create charts (weekly physical data) by click
the column of user as shown in “Figure 13”.
Figure 13: Weekly physical data charts.
In addition to the condition of the elderly, this
system also cares about the management of a large
number of sensors. Therefore, the device list provides
this user not limited to a single address floor, but the
real-time status of all the devices they own, because
there are too many types and numbers of devices. As
shown in “Figure 14”, this table provides each field
that can be sorted and searched in order, or we can
manually search for the device by entering a keyword.
The fields are in order: name, type, MAC, altitude,
longitude, latitude, status, number of data, setup time,
and latest update time.
Figure 14: Real-time device infographic.
4.4 Google Home System
We use Google Home as notify system and a way to
get points of Elderly Depression Scale to make sure
our user are healthy.
As a notify system, we use codes to get the data
of physical data when the value is too high or low.
And the data will be downloaded, create messages
and check the location of user and the nearest Google
Home Nest Mini. Then it will push the message to the
user.
User can talk to Google Home Nest Mini get their
health condition. At the same time, we will ask them
some question in geriatric depression scale to make
sure their mental health and change the dialog
message.
4.5 Data ETL
(Extract-Transform- Load)
Except real-time monitoring of the Firestore and web,
in order to see the long-term life behavior patterns of
the elderly, we will periodically export People-
records, Tag-records, Device-records data of the
object database through Cloud Dataflow and Cloud
DataPrep to set the data recipe. Then Dataprep's
graphical interface perform data cleaning, merging,
labeling and other data preprocessing actions, as
shown in “Figure 15”. Finally, we output personal
behavior pattern analysis and statistics Table data into
BigQuery database and Cloud Data Studio to link
output visual report as shown in “Figur. 16”.
Because People-records data includes the mac
address of the wearable device worn by the
experimenter on the day. Tag-records data includes
the Tag's mac address, the contacted Device mac
address and positioning coordinates. Device- records
includes the Device's mac address and the contacted
event type. We can combine the above three types of
historical data records through the above-mentioned
ETL data transposition to obtain the experimenter’s
long-term who-when-where-which features and
behavioral pattern information. In addition to instant
notifications of emergency events such as falls and
fires, when the behavior of the elderly is too different
from past behavioral patterns, the system can also
broadcast care reminders, or notify the family to
achieve the effect of smart care.
Figure 15: Dataprep Data processing interface.
The advantage of the design in this research
system is that data can be passed through fixed
DataPrep recipes. Historical data can be ETL
repeatedly stored in BigQuery to accumulate big data.
There is no need to do data preprocessing all the time.
And the Data Studio reports are continuously updated
through BI Engine and SQL. In addition to through
the filter of Data Studio, we can easily search for
individuals or data on specific dates and experimental
time intervals for analysis.
ICT4AWE 2021 - 7th International Conference on Information and Communication Technologies for Ageing Well and e-Health
210
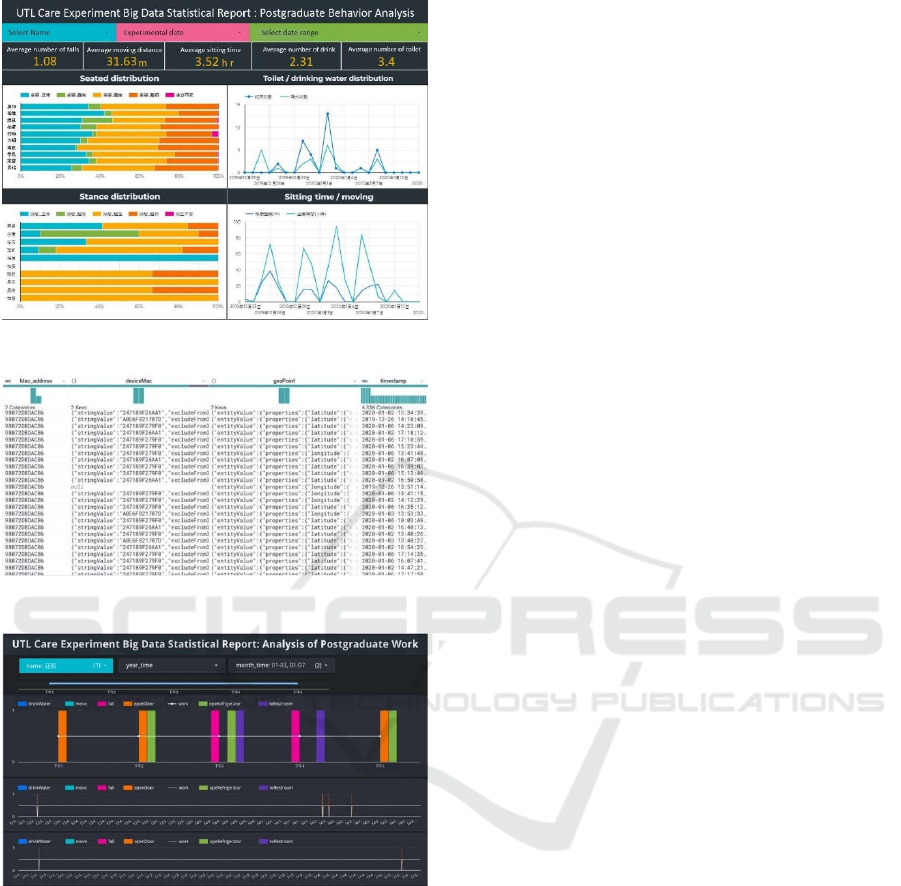
Figure 16: Data studio behavioral big data statistics report.
Figure 17: Tag-records data detail.
Figure 18: Daily activity pattern of 2 students under test.
According to the statistics of the IOT smart care
experiment results based on the above report, it was
found that 20 graduate students in this laboratory, 2
of whom were often restless. And in the experiment,
each person sat an average of 3.52 hours, went to the
toilet 3.4 times, filled water 2.31 times and walked
31.63 meters. If some students have abnormal day
activity data in the future, we can take care of his
health immediately. Through more tag positioning
and access to historical data of the device, such as
“Figure 17”. We collected tens of thousands of wearer
device mac address, contact device mac address,
corresponding event actions, positioning coordinates,
event time and other data in each experiment, more
detailed behavior patterns can be analyzed as shown
in “Figure 18”. When elderly people living alone have
irregular lifestyle habits, they can ask for care or
notify the family before the tragedy occurs.
5
CONCLUSION
This study is dedicated to improving quality of
people's life. The only solution to deal with and
manage the behavior and health of millions of people
is big data and Internet of Things technology (Kwok
Tai Chui et al., 2019). We hope to use any simple
BLE device to automatically sense the surrounding
environment and build a smart IOT care system.
Therefore, this research uses BLE as the main axis to
design, which includes wearable devices, Google
Home Nest Mini, magnetic reed switches and other
devices. We integrate these with cloud database and
big data analysis system. Since the system in this
experiment can collect basic sensor data, at the same
time, it can collect historical data of absolute
positioning of personnel.
Where detailed people go in a day? What action
was taken? What time does the elder do with other
elders or caregivers in the living room or social room
every day? Long-term big data analysis can reveal
more detailed life pattern data, and even the social
relationships of the elders.
Although we have designed whole system and
done some testing, we have still not finished the
Google Home System experiment. But we will still
work on it, design new data charts and use them to
make whole system better. In the near future, through
Google Home System, we will provide care,
reminders, suggestions and other levels of treatment
to elderly proactively.
REFERENCES
Haijun Gu, Yufeng Diao, Wei Liu and Xueqian Zhang.
(2011). The Design of Smart Home Platform Based on
Cloud Computing. International Conference on
Electronic & Mechanical Engineering and Information
Technology.
Xiaojing Ye and Junwei Huang. (2011). A Framework for
Cloud-based Smart Home. International Conference on
Computer Science and Network Technology.
M. M. E. Mahmoud, Joel J. P. C. Rodrigues, Syed Hassan
Ahmed, Sayed Chhattan Shah, Jalal F. Al-Muhtadi,
Valery V. Korotaev, Victor Hugo C. De Albuquerque.
(2018). Enabling technologies on cliud of things for
smart healthcare. IEEE Access. pp. 31950-31967.
Implementation of IoT, Wearable Devices, Google Assistant and Google Cloud Platform for Elderly Home Care System
211

W. Shi, J. Cao, Q. Zhang, Y. Li and L. Xu. (2016) . Edge
computing: Vision and Challenges. IEEE Internet
Things. pp. 637-646.
D. C. Yacchirema, D. Sarabia-JáCome, C. E. Palau and M.
Esteve. (2018). A Smart System for Sleep Monitoring by
Integrating IoT With Big Data Analytics. In IEEE
Access, vol. 6, pp. 35988-36001.
Keelung City Government. (2017). Geriatric Depression
Scale.
O. Dawelbeit and R. McCrindle. (2016). Efficient
Dictionary Compression for Processing RDF Big Data
Using Google BigQuery. 2016 IEEE Global
Communications Conference (GLOBECOM),
Washington, pp. 1-6
Kwok Tai Chui, Ryan Wen Liu, Miltiadis D. Lytras &
Mingbo Zhao. (2019). Big data and IoT solution for
patient behavior monitoring. Behaviour&Information
Technology.
ICT4AWE 2021 - 7th International Conference on Information and Communication Technologies for Ageing Well and e-Health
212
