
Civic-Tech and Volunteered Geographic Information under the
COVID-19 Pandemic: A Japanese Case Study
Koshiro Suzuki
a
Faculty of Humanities, University of Toyama, 3190 Gofuku, Toyama, Japan
Keywords: COVID-19, Participatory GIS, Volunteered Geographic Information.
Abstract: In the early spring of 2020, a new infectious disease, COVID-19, emerged and spread globally, showing how
vulnerable humans are to novel viral threats. Evidently, this crisis has inspired new technological and social
innovations. The aim of this paper is to provide a brief overview of the application of civic tech and
volunteered geographic information to confront the disease, which spontaneously emerged after the first case
was confirmed in Japan in late January 2020. The trend of participatory Geographic Information
Systems/PGIS that emerged from the GIS controversy in the 1990s went through crisis mapping and has
demonstrated a new way of using GIS via social participation in the 21st century.
1 INTRODUCTION
The year 2020 will be considered as the year in which
the world fought the first pandemic to occur in 100
years. This highly infectious disease, COVID-19, has
shown how vulnerable human society is to novel viral
threats. Taubenberger and Morens (2006) reported
the spread of Spanish flu in the UK during the 1918
pandemic, and according to their study, it is likely that
the current pandemic will last for at least another
year, and we expect at least three waves of infections.
This paper was written in December 2020, when the
scale of the third wave had already exceeded that of
the second wave in Japan, and this persuades us to
reflect on the fact that our initial outlook was
extremely optimistic.
The work of Pyle (1986) provides fundamental
knowledge about the spread of an infection. Pyle
compared the processes by which influenza
pandemics spread over a period of approximately 100
years and found that the pandemic in 1791 took seven
months to reach Spain after invaded Europe from
Russia, whereas that of 1889 reached Spain in just
three months. One of the major events that had
occurred during this latter time was the improvement
of railways. The world's first railway line was built in
England in 1825, and railways were then built in
France in 1832 and in Germany in 1835 (Baxter 1866;
a
https://orcid.org/0000-0003-1106-3798
Kobayashi and Cotte 1997; Ebeling 2005). Pyle's
research shows that the spread of disease has an
unquestionable relationship with the changes and
developments in transportation modes, via which
humans act as virus carriers.
In the case of COVID-19, the peak of infection
spreading within China (where the virus is believed
to have originated) was in early February 2020, and it
is believed that this occurred in relation to people
moving around the country during the Chinese New
Year holidays from 24 January (Zhou et al. 2020).
In Japan, four Chinese people who visited Japan
from Wuhan from 16 to 26 January developed the
disease sequentially, and the first Japanese person
was infected on 28 January (Shigemura et al. 2020).
This occurred just prior to the docking of the
Diamond Princess (a luxury cruise ship suspected of
carrying many positive patients) in Yokohama Port
on 3 February (Gallego et al. 2020). To establish a
better understanding of the Japanese situation in the
context of this paper, I would like to recall that at this
time, Japan considered that the initial spark of the
COVID-19 outbreak would have no direct
repercussions for Japan. This course of time fulfils the
role of understanding the context of this study.
Incidentally, approximately 100 years ago (on 17
November 1910), an advert appeared in the St. Louis
Post, a local newspaper in St. Louis, Missouri, in the
United States. The advert was placed by the Bell
214
Suzuki, K.
Civic-Tech and Volunteered Geographic Information under the COVID-19 Pandemic: A Japanese Case Study.
DOI: 10.5220/0010467502140221
In Proceedings of the 7th International Conference on Geographical Information Systems Theory, Applications and Management (GISTAM 2021), pages 214-221
ISBN: 978-989-758-503-6
Copyright
c
2021 by SCITEPRESS – Science and Technology Publications, Lda. All rights reserved

Figure 1: Newspaper advertisement placed by Bell
Telephone Company approximately 100 years ago (source
is indicated in the body text).
Telephone Company, which originated in Boston in
1877, and it was captioned ‘When in Quarantine’.
The caption was then accompanied by a short
description summarising the implications of the
caption: ‘PEOPLE who are in quarantine are not
isolated if they have a Bell Telephone’ (Fig. 1).
This advert suggests that at the dawn of the last
century, the desire played a significant role in the
spread of this new technology and its associated
demand, because it is targeted at patients in isolation
who need to communicate with the outside world.
The theme I of this paper is symbolically depicted
in this advertisement; in other words, ‘disaster
promotes technological innovation’. Social crises
such as wars, illnesses, and disasters provide major
opportunities for the development of technological
innovations. The aim of this paper, therefore, is to
review the social peril induced by COVID-19 in
Japan 2020 from the perspective of epidemic
prevention activities achieved through citizen
participation in a ‘participatory GIS context’.
2 SOCIAL PARTICIPATION OF
CITIZENS
2.1 What Is Volunteered Geographic
Information?
The internet is the main infrastructure in today’s
information society, and its roots lie in a network
system of academic institutions by packet
communications developed in the late 1960s by
funding from the U.S. Department of Defense’s
Advanced Research Project Agency (Abbate 1994).
Similarly, the development of the geographic
positioning system (GPS), the core technology that
supports today's car navigation systems and
autonomous driving technologies, developed from
precision guidance technology introduced to combat
during the Gulf War (Daly 1993). Other fundamental
technology, such as that of infrared photography,
which forms the basis of remote sensing technology,
has its roots in film that can visualise the infrared
band, which was developed by Kodak during WW2
in 1943. These infrared and ultraviolet night-vision
techniques made it possible to identify obscured
firearms and military installations from the sky
(Monmonier 2002a). Aerial photography, the use of
which will be discussed later in this paper as a life-
saving entity, is no exception. In 1936, the
Agricultural Adjustment Administration began taking
aerial photographs of farmland for using in soil
surveys and demarcation, and by 1941, more than
90% of farmland in the United States (U.S.) had been
photographed (Monmonier 2002b). Shortly
afterwards, aerial photographs were used together
with latitude and longitude coordinates and
topographic maps in Japanese urban air raids at the
end of the Pacific War, which showed that they were
highly effective for enabling horizontal bombing
from the sky (United States Army Air (Forces 1944)).
Based on the bitter lessons learned from the Great
Hanshin–Awaji Earthquake (1995), Japan has
promoted the digitisation of land information. Today,
various statistical data and numerical maps (digitised
geographic information, such as prefectural
boundaries, railways, roads, rivers, and elevations)
can be accessed free of charge on the websites of the
National Geographic Institute and the Statistics
Bureau of the Ministry of Internal Affairs and
Communications, which makes them easy to use on
personal computers and mobile devices (Sato and
Une 2020).
In 2011, 16 years after the Great Hanshin–Awaji
Earthquake, crisis mapping was conducted during the
Civic-Tech and Volunteered Geographic Information under the COVID-19 Pandemic: A Japanese Case Study
215

first restoration stage immediately following the
Great East Japan Earthquake. In a situation where it
was not possible to determine what was happening in
the immediate aftermath of the disaster, the only clues
were obtained from the photos taken by satellites in
real time and aerial photographs taken by aircraft. It
was thus essential to read and digitise these to
understand the information relating to roads in coastal
areas and to associate it with digital maps on the web,
and then to enable its sharing so that Self-Defense
Forces and rescue teams could access entrance routes
as quickly as possible. A platform was therefore built
and used during the Great East Japan Earthquake
(Seto 2011), wherein bitter lessons learned following
the Great Hanshin–Awaji Earthquake were put into
practice.
At this time, the Japanese version of crisis
mapping became a copyright-free web map called
Open Street Map (OSM), which was created in 2004,
and a website (sinsai.info) used map built-in
technology called GeoAPI to operate OSM. All these
were created by the general public in a collaborative
spirit, and not by government officials nor
researchers. Although participatory GIS has been
rapidly accepted since the beginning of the 21st
century, it was the first instance in Japan where social
participation by citizens through mapping, namely
participatory GIS, achieved concrete and remarkable
results for the first time and resulted in the
democratisation of mapping (Seki 2011).
In the 2000s, the bi-directionalisation of web
communication (Web 2.0) advanced rapidly against
the background of faster web communication and
higher performance computing devices. Michael
Goodchild of the University of California (UCSB)
coined the phrase, ‘volunteered geographic
information (VGI)’ in relation to the arrival of an era
in which geographic information can be mapped in
both directions from anywhere in the world by
anybody, provided they have certain skills and the
available infrastructure (Goodchild 2007).
2.2 Code for Project
It is welcomed to have knowledge about computer
programming when participating in providing VGI.
Social participation through mapping can be achieved
by people having skills necessary to design a
platform, who are willing to play a central role in the
VGI project. In other words, VGI is supported by the
general public (including engineers and
programmers), who write programmes and codes to
design the site, and by end-users, who modify and
correct the wording on electronic maps and websites.
This successful combination enables people to
participate in solving social issues. One of the key
movements was the Code for Project (CfP), which
was founded in the United States in 2004 as a Code
for America. The main leader is Jennifer Pahlka, who
is also the partner of Web 2.0, advocating Tim
O'Reilly. CfP was also introduced in Japan, and the
code for Japan was established in 2013 via the
achievements made through the Japanese version of
the crisis mapping mentioned earlier. It is no
coincidence that the founder of the Code for Japan
was Hiroyuki Seki, a system engineer who built the
website, sinsai.info. Various mobile applications
have subsequently been created from Japanese CfP on
occasions where it is not possible for local
government to focus on providing information. For
instance, the Code for Kanazawa developed an
application named ‘5374.jp’ by identifying users’
residences from information about their GPS location
through a mobile phone and linking them with
garbage disposal dates provided by the local
government. The application then automatically
informs you about the type of garbage that can be put
out every day (Takeda 2014). Similarly, the Code for
Tokushima published an application known as ‘Ren-
radar’ that informed users of the real time locations of
Ren, a team of dancers, during the Awa-Odori festival
(Code for Tokushima 2015).
In summary, an open data trend was developed
in Japan after the Great Hanshin–Awaji Earthquake,
and the trend of civic-tech citizens actively
participating in society through programmes and data
editing was established prior to the emergence of the
current social peril, COVID-19.
2.3 Visualising Infectious Diseases with
VGI
One of the countermeasures that can be employed in
tackling COVID-19 is to use electronic maps and
diagrams that can be shared to gain a better
understanding of the status and process of
transmission of infection, in the same way as we use
maps when lost. In fact, this has become the front-
line attack for VGI vs. COVID-19.
In this respect, the most famous visualisation site
globally as of December 2020 is the website ‘Covid-
19 Dashboard (DB)’ created by The Center for
Systems Science and Engineering, Johns Hopkins
(JH) University.
A DB is a set of visualisation tools on the web that
look like an administration screen. It allows users to
adjust values and output results by clicking or
pressing buttons relating to data, figures, and charts.
GISTAM 2021 - 7th International Conference on Geographical Information Systems Theory, Applications and Management
216
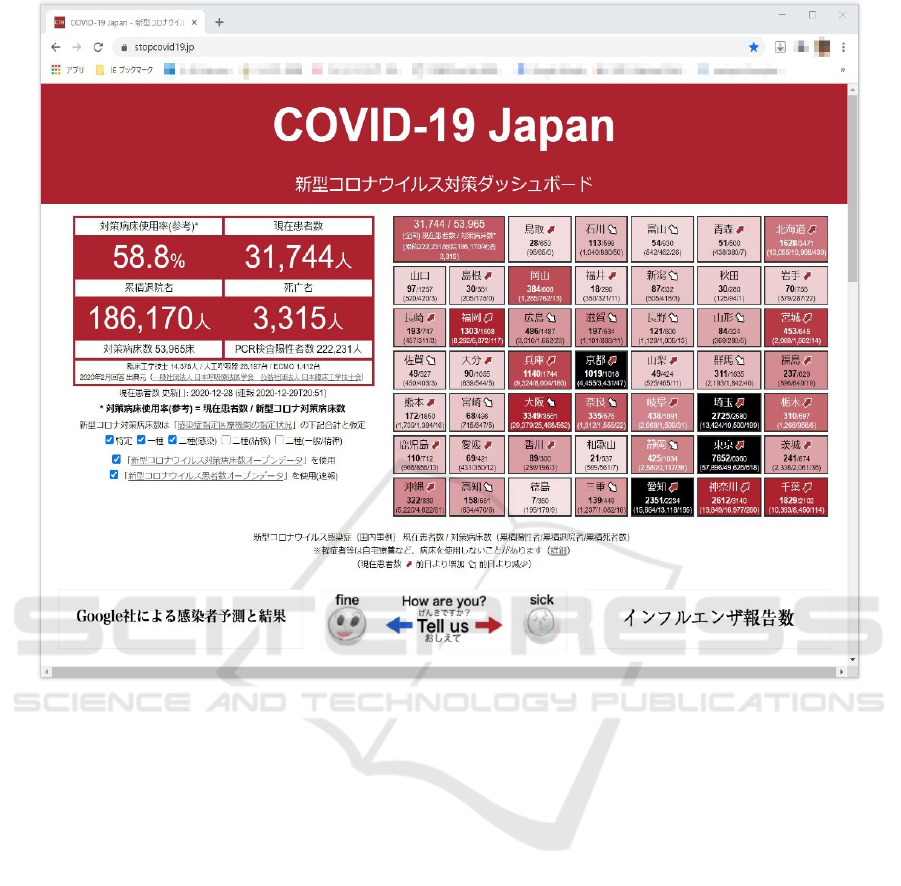
Figure 2: Dashboard screenshot of COVID-19 Japan. (Retrieved on 30 December. 2020 from; https://www.stopcovid19.jp/).
A DB does not analyse anything from a
professional point of view. It is a public instrument
that can be used to effectively visualise and
understand the current situation as accurately as
possible.
The earliest example of a visualisation website
was launched by a Japanese newspaper company,
Nihon Keizai Shimbun Co., Ltd., on 7 February, who
aimed to visualise the COVID-19 spread using
graphic charts. Subsequently, Takuma Ohamazaki, a
representative of an election consulting firm,
launched the DB entitled ‘Map of the Number of
Infected People’ on 16 February. In this respect, the
company aimed to visualise the disease by adding its
own expressions, such as a kernel density map, with
technical support from the ArcGIS dashboard, while
referring to the DB design of JH University.
On 27 February, another newspaper company,
Toyo Keizai Shimbun, published a DB that visualises
the progress of domestic infection. There are two
notable points relating to this DB: the author (Kazuki
Ogihara) worked for the company's editorial
department individually planned and created the DB,
and he used a data vault on the web called GitHub on
the visualisation site as far as being found.
GitHub opens the source code of the user’s
programme so that volunteers can request, point out,
and respond to bugs in real time. As a result, sections
can contain errors, and their revision statuses and the
content of the conversation during the revisions are
also visible. This DB subsequently received a good
design Award 2020 in October.
This trend became firmly established when the
Tokyo metropolitan government, under the technical
support of the Code for Japan, released the official
‘New Coronavirus Countermeasure Site’ on GitHub
on 4 March and took further measures to enable
perfecting it using collective knowledge by applying
an open-source code under a common licence that
permits its reproduction and distribution for non-
commercial purposes. It was also selected for the
Good Design Best 100 award in 2020. In fact,
Hokkaido, which was suffering from the spread of
infection, employed a Hokkaido version of the Tokyo
Civic-Tech and Volunteered Geographic Information under the COVID-19 Pandemic: A Japanese Case Study
217
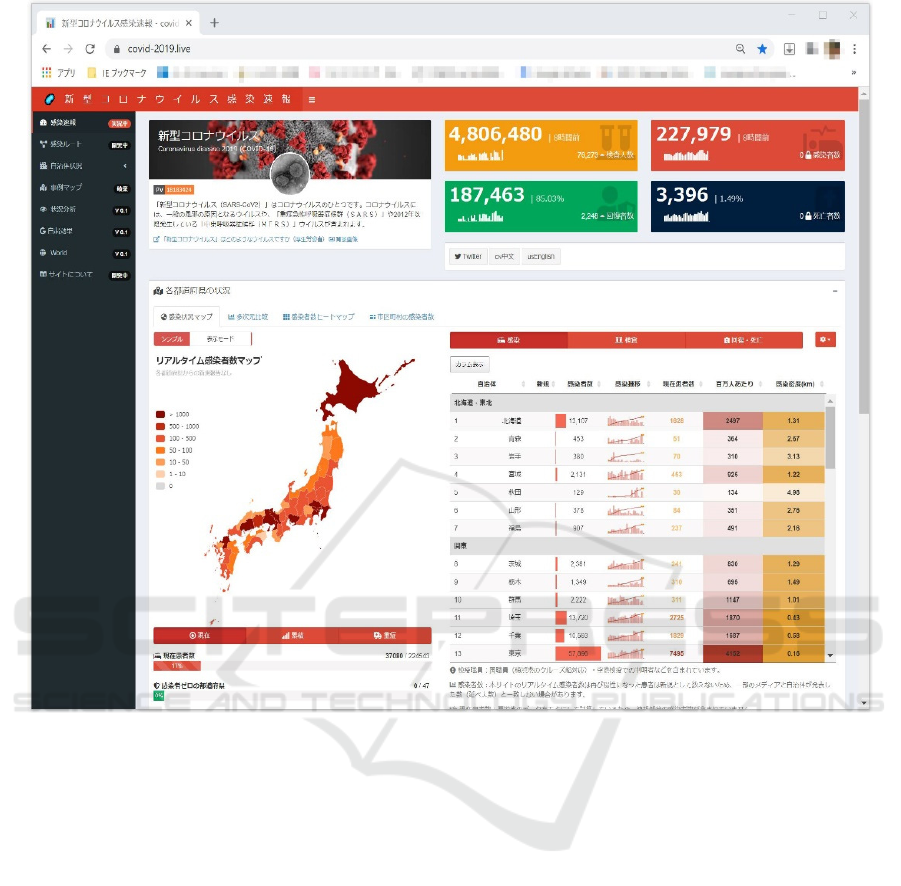
Figure 3: Dashboard screenshot of COVID-19 live. (Retrieved on Dec. 30. 2020 from; https://covid-2019.live/).
metropolitan government site created under the name
of ‘#JUSTDoIT’, and a similar movement spread to
Kanagawa and other prefectures. In addition, large
information technology corporations such as ESRI
Japan and Yahoo also created the COVID-19
visualisation websites using open data.
A participant in a VGI renders a social
contribution based around their time limits and ability
and without expecting anything in return. In Japan,
during 2020, the VGI movement also occurred on an
individual level with based on this conviction.
The first DB relating to COVID-19 was created on
8 March by an anonymous person known as
‘Kenmonezumi’. As the data formats and methods of
publication for each prefecture were not uniform and
the number of PCR tests and the positive test rates were
published in PDF format, he manually converted these
to CSV via text and published them using Google's
data portal. Although it is not a visualisation site using
a map, his DB is an example of an individual's first
attempt to visualise data related to COVID-19.
Taisuke Fukuno, representative of the Code for
Sabae and president of a venture company based in
Sabae City, Fukui Prefecture, also charted the
occupancy rates of hospital beds by prefecture in late
March, and this enabled the visualisation of the risk
of the health system collapsing (Fig. 2). This website
was viewed more than a million times in one month
from late March (Mainichi Shimbun, 29 April 2020).
Another noteworthy aspect of VGI that has
occurred during the epidemic is that foreigners living
in Japan, who tend to be considered socially
vulnerable, have made social contributions through
VGI. On 23 February, Dong-Yeon Lee, a student
from South Korea studying at Kyushu University,
created the ‘Novel Coronavirus Case Map’, which
shows infected people in red, people whose migration
history is known in blue, and people who have been
cured in green, as well as a streamline map of
migration history by city, ward, and town (the map
has not been updated since 30 October 2020). In
addition, covid19.live was launched on 3 March by
GISTAM 2021 - 7th International Conference on Geographical Information Systems Theory, Applications and Management
218

Wei_Su, a Chinese international student, and this
visualises transitions between the infection density
and status by prefecture (Fig. 3). Such a movement
is in accordance with the Sustainable Development
Goals/SDGs philosophy of ‘ensure responsive,
inclusive, participatory, and representative decision-
making at all levels (Goal 16-7)’ and ‘ensure public
access to information and protect fundamental
freedom, in accordance with national legislation and
international agreements (Goal 16-10)’ (United
Nations 2020). It is remarkable that active
participation of people, who are in a socially
vulnerable position during an emergency, occurred
via mapping.
3 VGI POSSIBILITIES AND
CHALLENGES
As Dekker (2008) noted, ‘a prerequisite for partaking
in civil society is commitment, the willingness to bind
oneself to a common course and to take
responsibilities.’ In the sense of ‘social organisation,
such as trust, norms, and networks, that can improve
the efficiency of society by facilitating coordinated
actions’ (Putnam et al. 1993: 167), the current VGI
movement can be characterised as being a typical
social capital. Symbolically, they complained about the
lack of usability and inconsistent formats of relevant
information released by local and national govern-
ments resulting from top-down management. Notably,
the COVID-19 disaster has shown how vulnerable the
hierarchical (top-down) decision-making system is in
the face of a rapidly advancing crisis.
Goodchild (2007), who foreshadowed the
promising future of VGI, referred to ethical issues in
his article, such as the accuracy of information
created and the digital divide. In this respect, ethical
issues relating to VGI that have been progressed
under the present COVID-19 disaster should be
mentioned.
COCOA, the contact verification application
released by the Ministry of Health, Labor, and
Welfare on 19 June was developed based on COVID-
19 Radar, a volunteer open-source project led by
Kazumi Hirose, a Microsoft Japan employee. On 8
May, the initiative to develop the application, which
had been promoted on a well-intentioned basis, was
taken up by the Ministry of Health, Labour, and
Welfare and contractors after their decision to use it.
However, it was later discovered that when Bluetooth
access was disabled, the device would not launch on
the iOS. This was severely criticised, and the
development was halted. Mr. Hirose, the developer of
COCOA, revealed on twitter that he had only three
weeks to make changes to the system at the time of
the transfer. The COCOA case thus exposed the
ethical issue of the extent of qualitative responsibility
the donor should take for contributions from
volunteers.
Another ethical issue relates to the spread of
malice during social crises. Fan et al. (2020) extracted
3,457,402 tweets about COVID-19 and China from
twitter API using query ‘china + and + coronavirus’
and showed that 25,467 of these involved hate
speech, which was highly related to the users’ poverty
and unemployment status and feeling of fear. The
analysis used the U.S. as a case study and also showed
that an upward trend in hate speech occurred when
the first COVID-19 cases in the U.S. were reported
and then immediately after the spread of the disease
was in full swing (which was evidenced by a report
from the Asia Pacific Policy Planning Council, which
found that 1,497 cases were reported in the U.S.
between 19 March and 15 April (Jeung and Nham
2020)).
Since the second wave of COVID-19 hit in
October 2020, messages encouraging the exclusion of
Asians have spread on social networking sites in
France, accelerating the division of society. For
example, one tweet said ‘Arabs and blacks living in
the 91
st
, 92
nd
, 93
rd
, 94
th
, and 95
th
arrondissements of
Paris, please attack Chinese people if you see them on
the street’ (Fig. 4). When people perceive that they
Figure 4: Tweet calling for Chinese assault.
Retrieved on 29 December 2020 from;
https://twitter.com/ruiwangfrance/status/13216083752983
79777/photo/2.
Civic-Tech and Volunteered Geographic Information under the COVID-19 Pandemic: A Japanese Case Study
219

are protected by anonymity, they are less likely to
exercise the same psychological restraint as when
they are not anonymous. Suler (2004) called this the
‘online disinhibition effect’. The problem, as the
tweet suggests, is that threats in virtual space can be
projected into real space by virtue of their location
(Suzuki 2021).
Velásquez et al. (2020) investigated the spread of
malicious content on social media using machine
learning to identify COVID-19-related hate speech,
false information, and misinformation. They revealed
that malicious content starting at 4ch spread to other
social networking sites (SNSs) (such as Telegram,
Gab, and Facebook) while forming network clusters.
At present, the right to delete such malicious content
is limited to the operating company of each SNS, and
it is extremely difficult to prevent it from spreading
over SNSs. The EU's ratification of a voluntary code
of conduct relating to hate speech in 2016 has not
been effective. France is in the midst of developing a
new law, the Avia Act (The Cube 2020) that regulates
online hate speech, and in the U.S. there is a fierce
battle over whether or not Section 230 of the
Communications Decency Act (CDA), which has
long held the view that social network operators are
not legally responsible for the content of their posts,
should be upheld (Musil 2020; Sink et al. 2020).
Due to the characteristics of social networking
tools, cyberspace sometimes becomes a stage for
information warfare between nations and ethnic
groups. As it was strongly suspected that COVID-19
originated in Wuhan, China, a conflict arose between
the U.S., who claimed it should be called the ‘Wuhan
virus,’ and the Chinese, who objected and claimed
that it had been imported from the U.S. Wang et al.
(2020) tracked Chinese #USAVirus propaganda
retweets from 1,256 twitter accounts and analysed
3,567 tweets collected before they were banned by
twitter on 12 June 2020. As a result, while many were
written in English, 74% of them held attached image
files of long sentences written in simplified Chinese
letters, and the posting time distribution was also
confirmed to relate to Chinese working hours. Wang
et al.’s report is reminiscent of the ‘A Study in
Empire’ made by opportunist scholars being
obsequent to Nazi imperialism (Monmonier 1991). It
is also possible to look at these logs on SNSs from the
viewpoint of historical material criticism.
In the French case I mentioned earlier, the hashtag
‘#JeNeSuisPasUnVirus’ was also spread in response
to hate speeches against Chinese people. Social
networking is only a tool, and it is people who use it.
However, among research fields dealing with
geographic information, limited research relating to
information ethics on the user side has been
conducted. At present, VGI, where engineers build
the platform, has only been minimally affected by
unethical behaviour that frequently occurs on SNSs.
However, it is also true that VGI, which leverages the
same collective knowledge as Wikipedia, is
constantly exposed to the risk of vandalism,
destruction, and data inaccuracy (Viégas et al. 2004).
4 REMARKS
In 100 years from now, when people recall the
COVID-19 pandemic, it will be apparent that for the
first time in human history, ordinary citizens assisted
in fighting the spread of disease by visualising
geographical information.
In addition, this disease has spread (via SNSs)
hate speech, propaganda, and rumours, and exposed
the dark side of humanity. In this age of readily
available pandemic information and the presence of
COVID-19, people are getting more capable of
delivering geographic information. In this age of
rapid spread of geographic information through
citizen participation, we thus need to also focus on the
associated ambivalent aspects.
ACKNOWLEDGEMENTS
This study was supported by grants from KAKENHI
(Grant number 20K01173). I would like to express
my gratitude to Koji Ohnishi, Professor at the
University of Toyama, for his advice while preparing
the earlier draft. This paper was conceived based on
the content of a presentation given at the University
of Toyama's Collegium for the Humanities held on 16
December 2020.
REFERENCES
Abbate, J.E., 1994. From ARPANET to INTERNET: A
history of ARPA-sponsored computer networks, 1966–
1988. https://repository.upenn.edu/dissertations/AAI9
503730.
Baxter, R.D., 1866. Railway extension and its results.
Journal of the Statistical Society of London, 29(4), 549–
595.
Code for Tokushima, 2015. Bikori! Multi-purpose beacon
reader checking the location of a Ren, Awaodori.
https://ziyudom.com/awaodori-beacon/. (Accessed:
2020.12.30)
GISTAM 2021 - 7th International Conference on Geographical Information Systems Theory, Applications and Management
220

Daly, P., 1993. Navstar GPS and GLONASS: Global
satellite navigation systems. Electronics and
Communications Engineering Journal, 5(6), 349–358.
Dekker, P., 2008. Voluntary associations, volunteering and
the ideals of civil society. Boletin CIES, 59, 1–18.
Ebeling, K., 2005. High-speed railways in Germany. Japan
Railway and Transport Review, 40, 36–45.
Fan, L., Yu, H. and Yin, Z., 2020. Stigmatization in social
media: Documenting and analyzing hate speech for
COVID-19 on Twitter. Proceedings of the Association
for Information Science and Technology, 57(1), e313.
Gallego, V., Nishiura, H., Sah, R. and Rodriguez-Morales,
A.J., 2020. The COVID-19 outbreak and implications
for the Tokyo 2020 Summer Olympic Games. Travel
Medicine and Infectious Disease, 34, 101604. Crossref.
Goodchild, M.F., 2007. Citizens as sensors. GeoJournal,
69(4), 211–221.
Jeung, R. and Nham, K., 2020. Incidents of coronavirus-
related discrimination. A report for A3PCON and
CAA, April 23, 2020.
Kobayashi, I. and Cotte, M., 1997. The locomotives of the
Saint-Étienne & Lyon railway. Historical Studies in
Civil Engineering, 17, 101–110.
Mainichi Shimbun., 2020. Covid-19 website visualizing
hospital bed utilization rate gets over 1 million hits,
nationwide status at a glance. (Accessed: 2021.03.04)
Monmonier, M., 1991. How to lie with maps, University of
Chicago Press.
Monmonier, M., 2002a. Spying with maps, University of
Chicago Press.
Monmonier, M., 2002b. Aerial photography at the
Agricultural Adjustment Administration.
Photogrammetric Engineering and Remote Sensing,
68(12), 1257–1261.
Musil, S., 2020. Trump threatens veto of defense bill unless
Congress nixes. https://www.cnet.com/news/trump-
threatens-veto-of-defense-bill-unless-congress-nixes-
section-230/. (Accessed: 2020.12.12)
Pyle, G.F., 1986. The diffusion of influenza, Rowman and
Littlefield.
Putnam, R.D., Leonardi, R. and Nanetti, R.Y., 1993.
Making democracy work, Princeton University Press.
Sato, H.P. and Une, H., 2020. Relation between horizontal
direction of crustal deformation surveyed on the control
points and area ratio of the slope failures triggered by
the 2016 Kumamoto earthquake (M j 7.3). In: Arbanas,
Ž., Bobrowsky, P.T., Konagai, K., Sassa, K., and
Takara, K., eds. Understanding and reducing landslide
disaster risk: 6 Specific Topics in Landslide Science and
Applications, pp: 45–54. Springer Nature Switzerland
AG.
Seki, H., 2011. Higashinihon-daishinsai fukkō shien
purattofōmu sinsai.info no naritachi to kongo no kadai.
(The establishment of sinsai. Info, the Great East Japan
Earthquake reconstruction support platform and future
issues). Digital Practice, 2(4), 237–241.
Seto, T., 2011. Saigai taiō ni okeru borantarīna chiri kūkan
jōhō no toki kūkan-teki suii (Spatiotemporal transition
of volunteered geographic information as a response to
crisis: A case study of the crisis mapping project at the
time of Great East Japan Earthquake). Proceedings of
the geographic information systems society of Japan,
20, B-2–4.
Shigemura, J., Ursano, R.J., Morganstein, J.C., Kurosawa,
M. and Benedek, D.M., 2020. Public responses to the
novel 2019 coronavirus (2019-nCoV) in Japan.
Psychiatry and Clinical Neurosciences, 74(4), 281–
282.
Sink, J., Egkolfopoulou, M. and Fabian, J., 2020. Twitter-
Trump clash escalates after he signs social media order.
https://www.bloomberg.com/news/articles/2020-05-
28/trump-says-he-ll-sign-order-to-limit-twitter-s-legal-
protections. (Accessed: 2020.12.12).
Suler, J., 2004. The online disinhibition effect.
Cyberpsychology and Behavior, Multimedia and
Virtual Reality on Behavior and Society, 7(3), 321–326.
Suzuki, K., 2021. #Purge: Geovigilantism and geographic
information ethics for connective action. GeoJournal,
86. https://doi.org/10.1007/s10708-019-10081-7
Takeda, M., 2014. Developing regional information
systems by civic activity. Annual Conference of Japan
Society for Management Information: 2014(autumn):
B2–2. doi: 10.11497/jasmin.2014f.0_149
Taubenberger, J.K. and Morens, D.M., 2006. 1918
Influenza. Emerging Infectious Diseases, 12(1), 15–22.
The Cube, 2020. ‘We need to go a step further’: French MP
Laetitia Avia says more action is needed on online hate.
https://www.euronews.com/2020/10/23/we-need-to-
go-a-step-further-french-mp-laetitia-avia-says-more-
action-is-needed-on-online- (Accessed: 2020.12.12).
United Nations, 2020. Sustainable development goals: Goal
16. https://www.un.org/sustainabledevelopment/peace-
justice/. (Accessed: 2020.12.30).
United States Army Air Forces, 1944. Records of the U.S.
strategic bombing survey, entry 48 No.90, security-
classified air objective folders, 1942-1944, Maryland,
National Archives and Records Administration.
Velásquez, N., Leahy, R., Restrepo, N.J., Lupu, Y., Sear,
R., Gabriel, N., Jha, O., Goldberg, B. and Johnson,
N.F., 2020. Hate multiverse spreads malicious COVID-
19 content online beyond individual platform control.
arXiv:2004.00673v2.
Viégas, F.B., Wattenberg, M. and Dave, K., 2004. Studying
cooperation and conflict between authors with history
flow visualizations. Proceedings of the SIGCHI
conference on Human Factors in Computing Systems,
6(1), 575–582.
Wang, A.H., Lee, M.C., Wu, M.H. and Shen, P.Horng-E.,
2020. Influencing overseas Chinese by tweets.
Journal of Computational Social Science.
https://doi.org/10.1007/s42001-020-00091-8
Zhou, C., Su, F., Pei, T., Zhang, A., Du, Y., Luo, B., Cao,
Z., Wang, J., Yuan, W., Zhu, Y., Song, C., Chen, J., Xu,
J., Li, F., Ma, T., Jiang, L., Yan, F., Yi, J., Hu, Y., Liao,
Y. and Xiao, H., 2020. COVID-19: Challenges to GIS
with Big Data. Geography and Sustainability, 1(1), 77–
87.
Civic-Tech and Volunteered Geographic Information under the COVID-19 Pandemic: A Japanese Case Study
221
