Modeling Normal and Extreme Wave Conditions in Callao Bay,
Peru using Reanalysis Data
Rafael Pimentel
a
, Emanuel Guzman
b
and Carmela Ramos
c
Facultad y Escuela de Ingeniería Civil, Universidad Peruana de Ciencias Aplicadas, Av. Prolongación Primavera 2390,
Santiago de Surco, Lima, Peru
Keywords: Numerical Wave Modelling, Callao Bay.
Abstract: Numerical simulations of wave conditions in Callao bay in normal and extreme conditions were carried out
to characterize the wave dynamics in the bay. Bathymetry data from the navigation charts to represent bottom
depth were used. Waves in deep waters from numerical reanalysis were calibrated with satellite data that have
allowed define scenarios of wave propagation to shallow water in normal and extreme conditions. Model
results were compared with in situ wave data obtaining good approximation between modeling and observed
waves. Results indicates that waves coming from Southwest and South-Southwest, which is the most
predominant waves in deep waters, due to the diffraction effects caused by San Lorenzo Island generate two
areas with different wave height conditions, in this way in the area affected by diffraction wave reach height
between 0.5 to 1m, while area unaffected by diffraction effects wave reach heigh between 2 to 5m. Waves
coming from Northwest has more influence in the bay, due to diffraction effects are neglected and in general
terms all the bay increase the wave height around to 2 to 5m.
1 INTRODUCTION
The study and knowledge of waves in coastal areas
are important due to the impacts that can occur in
them, such as coastal flooding and the erosion and
sedimentation processes in coastlines. Some
numerical Simulation Investigations performed
Along the North Coast of the United States projected
an increase in wave height (Erikson et.al, 2015),
which may have an impact on the increase in sea level
on flooded shores (Ruggiero, 2013). Numerical
simulations of coastal flooding carried out in
California and other coastal areas of the USA indicate
that there would be a loss of 150 billion dollars due to
coastal inundation by waves an sea level (Barnard
et.al, 2019), Gainza et.al 2018 applied a numerical
modeling of tidal and wave factors to predict the
advance of the sea in the territory of Gold Coast,
Australia.
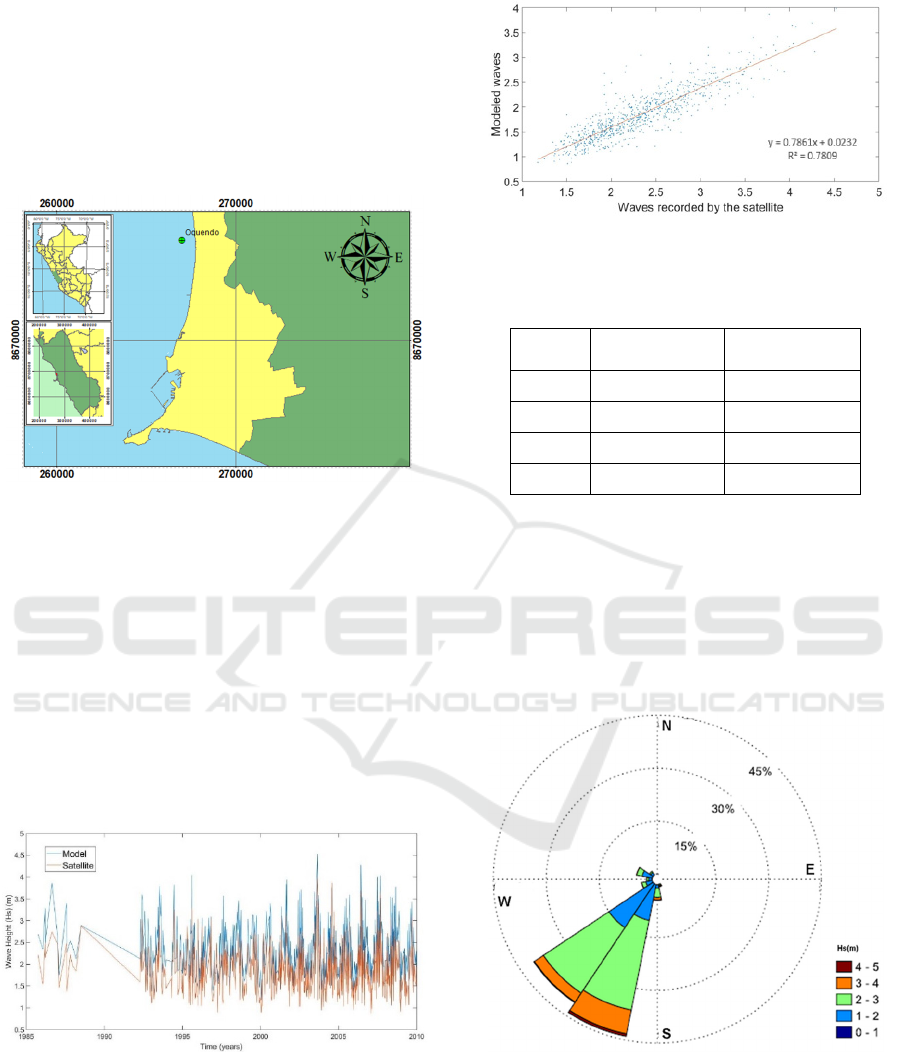
The study area is located in central part of Peru in
the Constitutional Province of Callao (Figure 1), and
currently is the third most populated province in Peru
a
https://orcid.org/0000-0002-4155-3563
b
https://orcid.org/0000-0001-8381-4509
c
https://orcid.org/0000-0002-4269-2944
with an annual growth population rate of 1.3%, (INEI,
2018).
Figure 1: Location of the study area.
Likewise, the study area is considered as a tourist
place due to its beaches like Chucuito, and Cantolao
beaches, gastronomy, and architecture like Real Felipe
Castle. Another important aspect is that Callao Port,
Pimentel, R., Guzman, E. and Ramos, C.
Modeling Normal and Extreme Wave Conditions in Callao Bay, Peru using Reanalysis Data.
DOI: 10.5220/0010458901950202
In Proceedings of the 7th International Conference on Geographical Information Systems Theory, Applications and Management (GISTAM 2021), pages 195-202
ISBN: 978-989-758-503-6
Copyright
c
2021 by SCITEPRESS – Science and Technology Publications, Lda. All rights reserved
195
which is the most important Peruvian port and carries
out industrial trade activities (Guzman et al, 2020).
In some seasons, especially in summer (January
February and March), Callao bay is affected by
irregular or unusual wave dynamics, for example in
2015, the bay was affected by irregular wave events
that affect the coast and alert to population, due to the
probability of flooding (Lainez, 2015). Similar
situation occurred in 2016, in which wave attack was
so aggressive that it could drag large stones to the
squares (Figure 2) (Perú21, 2016).
Figure 2: Flooding due to waves in the Callao bay. Source:
Peru21, 2016.
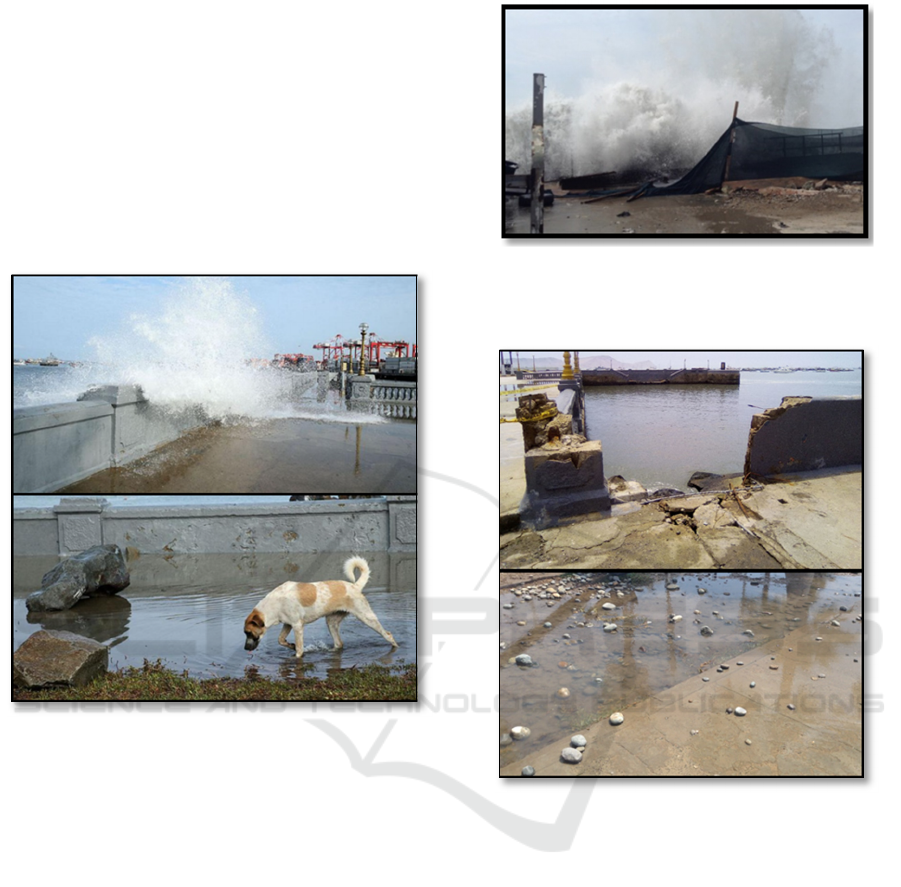
The last event similar to the events of 2015 and
2016 occurred in January 2011, when there was a rise
in the tide and anomalous waves coming from the
Northwest (Figure 3), causing serious damage to
infrastructures, flooding and again putting in danger
to the population, because the force of the waves was
so great that they knocked down in Plaza Grau
(Figure 4) and dragged a large amount of stones,
likewise, the waves caused damage to a museum that
was below ground level.
Although Callao Bay has many coastal
structures such as protection walls and breakwaters of
1.3 km long to prevent the waves from exceeding and
reaching the population, these were not enough to
stop the advance of the waves. Therefore, analyzing
the conditions of normal and extreme waves is of
great importance, since depending on the
characteristics of the waves, it could flood the coastal
strip and damage nearby infrastructures and even
against the life of those who live in the area.
Figure 3: Aggressive waves coming from the northwest.
Source: The photograph was taken by the authors in
January 8, 2021.
Figure 4: Collapse of the walls of Plaza Grau and stones
washed away by the waves. Source: The photograph was
taken by the authors in January 24, 2021.
2 METHODOLOGY
2.1 Data Used
To make numerical simulation oceanographic data
were used from global databases and in situ data.
Bathymetric data were used from available
navigation charts for Callao Bay, sea level data
available from University Hawaii Sea Level Center
(UHSLC) (Cadwell et al, 2015) has been used, which
collects the sea level data from tide-gauge stations in
the world and for our case, data from Callao station
recorded from 1970 to 2019 was used. In the case of
waves in deep waters, the wave reanalysis data from
GISTAM 2021 - 7th International Conference on Geographical Information Systems Theory, Applications and Management
196
the NOAA (National Oceanic Atmospheric
Administration) from 1979 to 2019 with 3 hours of
temporal resolution. These data were complemented
with satellite data for a point located on 78°W and
12.5°S. Data has also been collected in shallow
waters off the Callao bay at a depth of 10m (Figure
5), to validate the results obtained in the numerical
wave modeling.
Figure 5: Location of wave data collection in shallow water.
2.2 Wave Climate in Deep Waters
Wave reanalysis data in deep waters have been
compared with the satellite data to calibrate numerical
reanalysis. The uncalibrated reanalysis data shows
good trend and correlation between the wave height
of the model and the satellite (Figure 6 and 7)
obtaining acceptable statistical indicators between the
data of the uncalibrated model and satellite. (Table 1).
When model was calibrated, the indicators regarding
the data observed by the satellite improve
significantly (Table 1).
Figure 6: Time series of wave height comparison between
Waves reanalysis and Satellite data at location 78°W,
12.5°S.
Figure 7: Waves satellite data and wave reanalysis
dispersion at point 78°W, 12.5°S.
Table 1: Wave model calibration.
Indices
Uncalibrated
model
Calibrated
model
BIAS 0.4732 0.1732
RMSE 0.5423 0.3164
SI 0.2934 0.1712
IOA 0.7268 0.907
With the calibrated deep water model, the general
characteristics in deep water are established, and
wave height (Figure 8) and wave period (Figure 9),
observing that there is a predominant swell from the
southwest with wave height between 2 to 3m,
reaching maximum heights of 4m (Figure 8) and
predominant periods of 12 to 14s, with maximum
periods of 22s (Figure 9).
Figure 8: wave height rose in deep waters (78°W, 12.5°S).
Modeling Normal and Extreme Wave Conditions in Callao Bay, Peru using Reanalysis Data
197
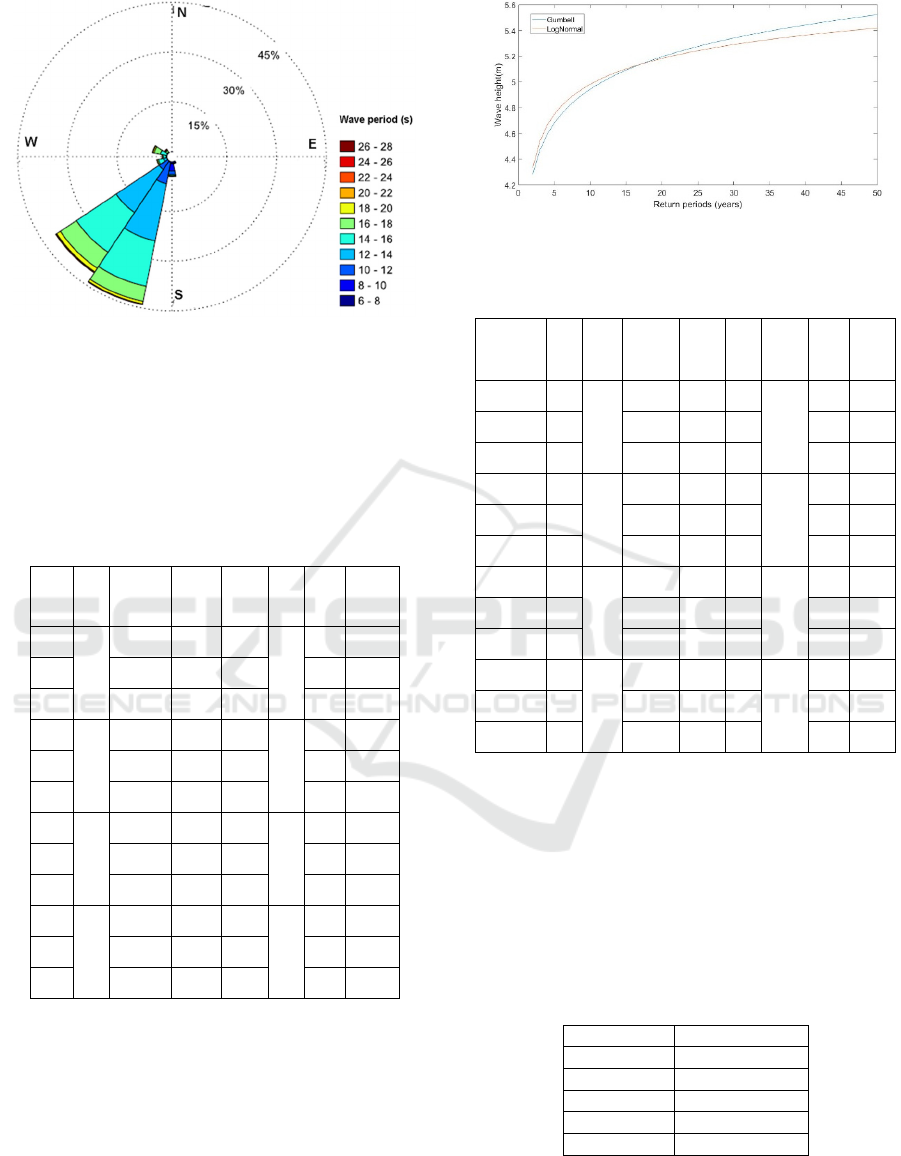
Figure 9: wave period rose in deep waters (78°W, 12.5°S).
After calibrating the model in deep waters, a table
has been prepared with the main cases of wave
propagation (Table 2), where the average, 90
percentile and maximum are shown in each wave
direction.
Table 2: Mean regime cases for each wave direction in deep
waters.
Case
Dir
Hs
(m)
Tp
(s)
Case
Dir
Hs
(m)
Tp
(s)
1
SSE
2.9 7.7 13
WSW
2 14.6
2 3.7 8.7 14 2.4 16.5
3 4.9 9.9 15 3.8 20.2
4
S
2.5 10 16
W
1.9 15.2
5 3.3 13.2 17 2.4 16.7
6 4.9 20 18 3.4 20.3
7
SSW
2.4 13.9 19
WNW
1.9 16.3
8 3.3 13.2 20 2.4 18.7
9 5.3 23.2 21 3.3 21.9
10
SW
2.2 14.4 22
NW
1.9 17.6
11 2.9 16.9 23 2.3 20.2
12 4.8 23.5 24 2.8 24.9
The extreme regimes consist in establish the most
unusual wave cases that have occurred in deep water
close to study area (Kim & Suh, 2018). The
LogNormal and Gumbell criteria will be used (Frihy
et al, 2010) to calculate wave height over 10, 30 and
50-year return period (Figure 10 and Table 3). Table
3 shows in general terms that wave coming from SW
and SSW have the greatest heights comparing with
other directions.
Figure 10: Extreme wave height regime in deep waters
(78°W, 12.5°S).
Table 3: Extreme regime cases obtained in deep waters.
Return
Period
(y
ears
)
Case
Dir
Hs
(m)
Tp
(s)
Case
Dir
Hs
(m)
Tp
(s)
10 1
SSE
4.3 8.7 13
WSW
3.2 16.5
30 2 4.7 8.7 14 3.5 16.5
50 3 5.2 8.7 15 3.7 16.5
10 4
S
4.4 13.2 16
W
3.0 16.8
30 5 4.9 13.2 17 3.3 16.8
50 6 5.1 13.2 18 3.4 16.8
10 7
SSW
4.9 13.2 19
WNW
2.9 18.7
30 8 5.3 13.2 20 3.2 18.7
50 9 5.5 13.2 21 3.3 18.7
10 10
SW
4.6 16.9 22
NW
2.5 20.2
30 11 5.0 16.9 23 2.7 20.2
50 12 5.1 16.9 24 2.9 20.2
3 SEA LEVEL
Data from UHSLC sea level were grouped in 5
decades to calculated mean sea level (MSL) over each
decade (Table 4) and shows an oscillatory trends of
MSL from 1970 to 2019.
Table 4: Mean sea level in Callao Bay station calculated by
decade.
Decade Mean sea level
1970
–
1979 1097 mm
1980
–
1989 1125 mm
1990
–
1999 1110 mm
2000
–
2009 1071 mm
2010 - 2019 1096 mm
GISTAM 2021 - 7th International Conference on Geographical Information Systems Theory, Applications and Management
198
4 NUMERICAL MODELING
Numerical modeling consists of performing the wave
propagation method from deep waters to several
locations in shallow water of study area to stablish the
climate wave (Yuk, Park & Joh, 2018).
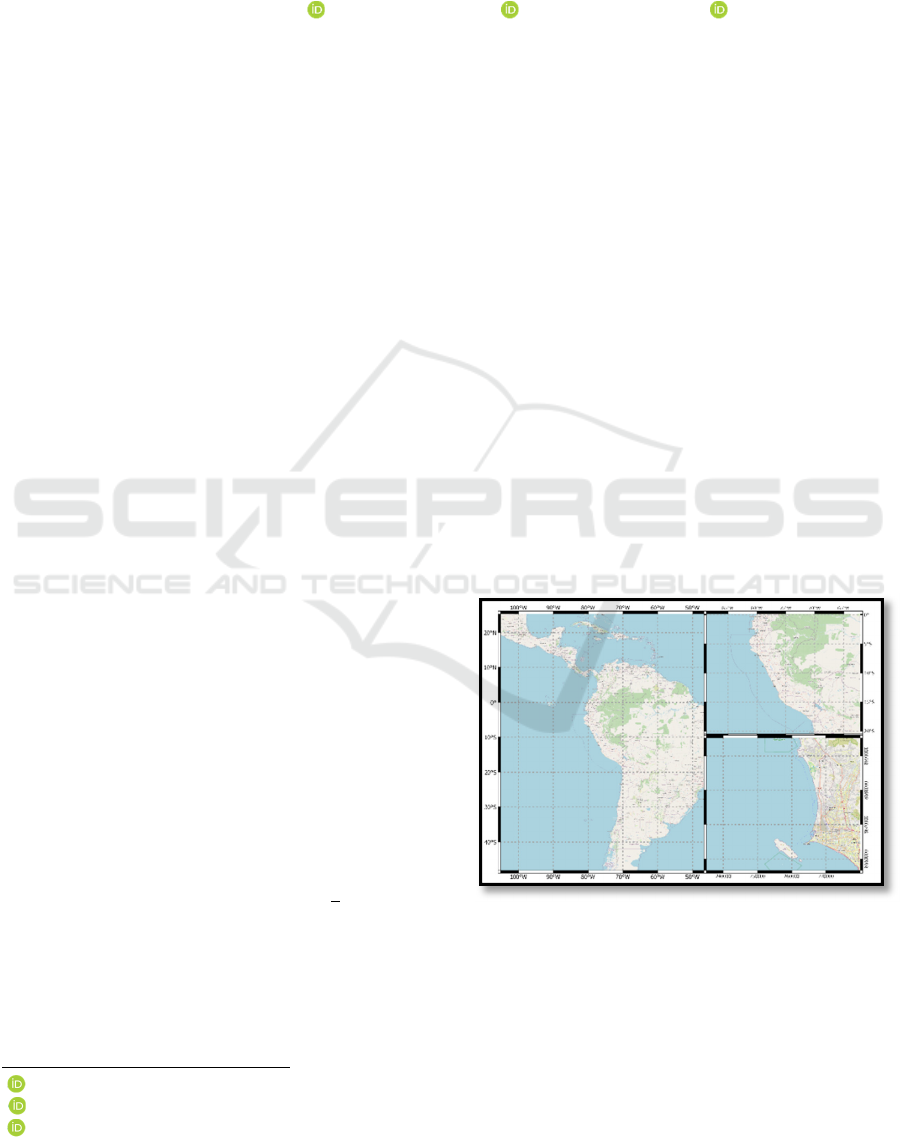
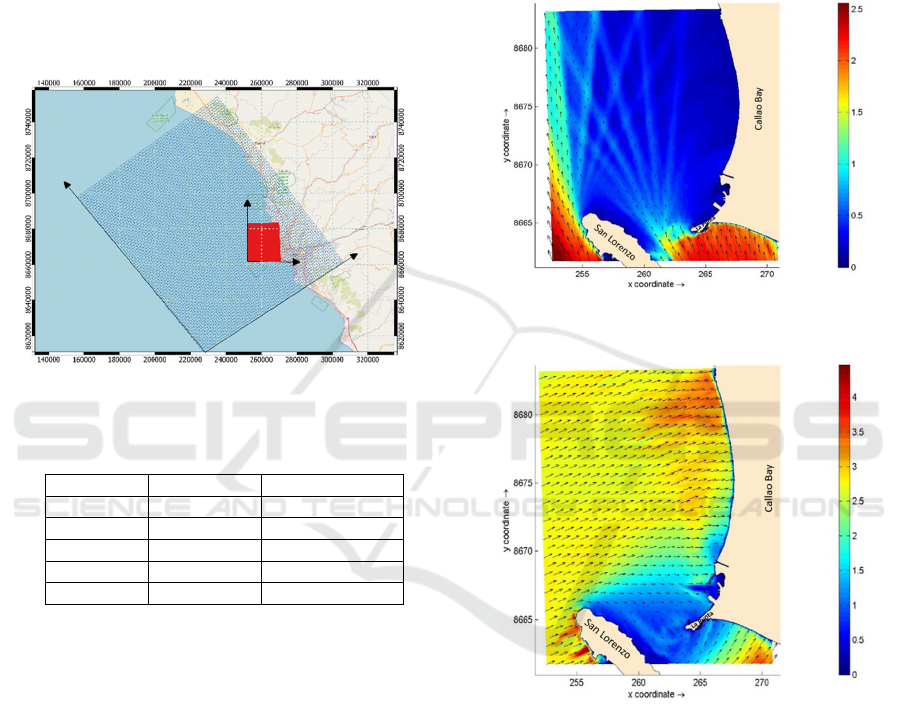
A nested grid to propagate deep water waves were
used (Figure 11), with a coarse grid with 30° rotation
for coarse grid while for shallow water a grid oriented
with x-axis were defined. The main characteristics of
each grid is showed in Table 5.
Figure 11: Wave grid in intermediate and shallow waters.
Table 5: Characteristics of the grids used in numerical wave
modeling.
Grid Deep water Shallow waters
Long 93km 18.3km
Width 113km 21.7km
dx 1158m 77m
d
y
1398m 91m
Orientation 30° 0°
The Delft3D-wave model (DELTARES, 2014)
were used to propagate each scenario defined in deep
water to shallow waters. Model was configurated to
propagate waves in stationary mode.
5 RESULTS AND DISCUSSIONS
5.1 Modeling of the Medium Regime
Results of wave modeling of mean regime shows that
waves coming from the south-southeast direction
does not affect La Punta and La Perla districts,
because the maximum wave height reached is less
than 0.5m (Figure 12). For waves coming from
southwest (Figure 13) wave heights in the northern
area of the bay reach 3 to 3.5 m, but in the La Punta
the wave heights are around 1m and in La Perla near
the coast the heights are around 0.5m.
Finally waves coming from northwest are
presented in Figure 14, where the highest wave heights
are 2.5m and are mostly throughout the northern part
of the study area, and the district of La Punta has
nearby waves of heights close to 2 m, but the district of
La Perla has waves less than or equal to 1 m.
Figure 12: Wave modeling for SSE direction. Case 01:
Wave period: 7.7 s, wave height: 4.3 m.
Figure 13: Wave modeling for WSW direction. Case 15:
Wave period: 20.2 s, wave height: 3.8 m.
5.2 Modeling of the Extreme Regime
In general terms, waves coming from Northwest
(Figure 15) shows wave height between 1.5 to 2m in
all the study area, and the northern part of study area
is most affected by waves. Figure 16 shows that wave
coming from Southwest generate two defined wave
areas. The first area correspond to northern part of the
bay, which wave heights reach values between 2 and
5m, and the second area is protected by San Lorenzo
Island which cause the diffraction and wave heights
reached is less than 2m.
Modeling Normal and Extreme Wave Conditions in Callao Bay, Peru using Reanalysis Data
199
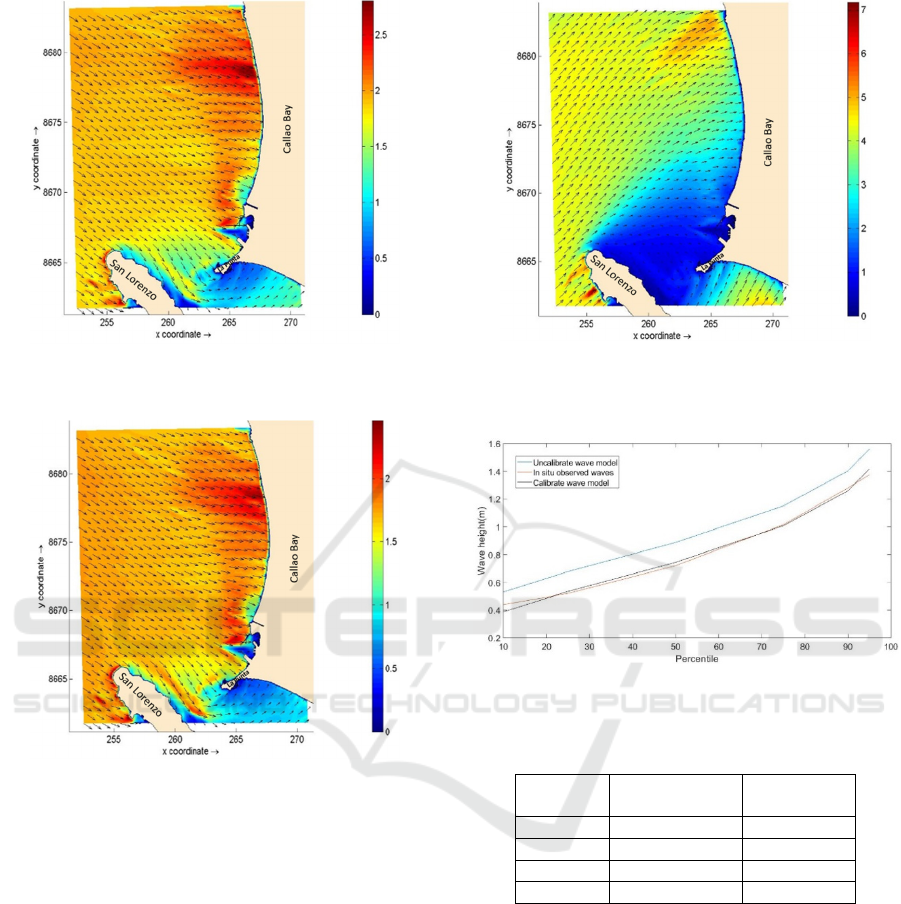
Figure 14: Wave modeling for WNW direction. Case 21:
Wave period: 21.9 s, wave height: 3.3 m.
Figure 15: Wave modeling for NW direction. Case 22:
Return Period: 10 years, Wave period: 20.2 s, wave height:
2.5 m.
6 MODEL VALIDATION IN
STUDY AREA
Likewise, Figure 17 shows the comparison of
percentiles of uncalibrated modeled waves, calibrated
model with in situ data. It is observed that
uncalibrated model has the same trends with in situ
date, however model is overestimate 0.20m
approximately, for this reason modeled wave were
calibrated to obtain better index of comparison (
Table
6
). Consequently, the numerical modeling with
Delft3D program is acceptable for the purposes of
this research.
Figure 16: Wave modeling for SW direction. Case 11:
Return Period: 30 years, Wave period: 16.9 s, wave height:
5 m.
Figure 17: Trend of the percentiles of registered and
modeled wave heights.
Table 6: Wave modelling validation in shallow waters.
Indices
Uncalibrated
Model
Calibrated
Model
BIAS 0.043 0
RMSE 0.053 0.031
SI 0.060 0.035
IOA 0.995 0.998
The events that affected to the bay during January
2021 (Figure 18 and 19) were represented in
numerical modeling as wave from Northwest (Figure
15), in this case ins observed how the wave inside
directly to Callao bay without influence of diffraction
effects from San Lorenzo Island.
GISTAM 2021 - 7th International Conference on Geographical Information Systems Theory, Applications and Management
200
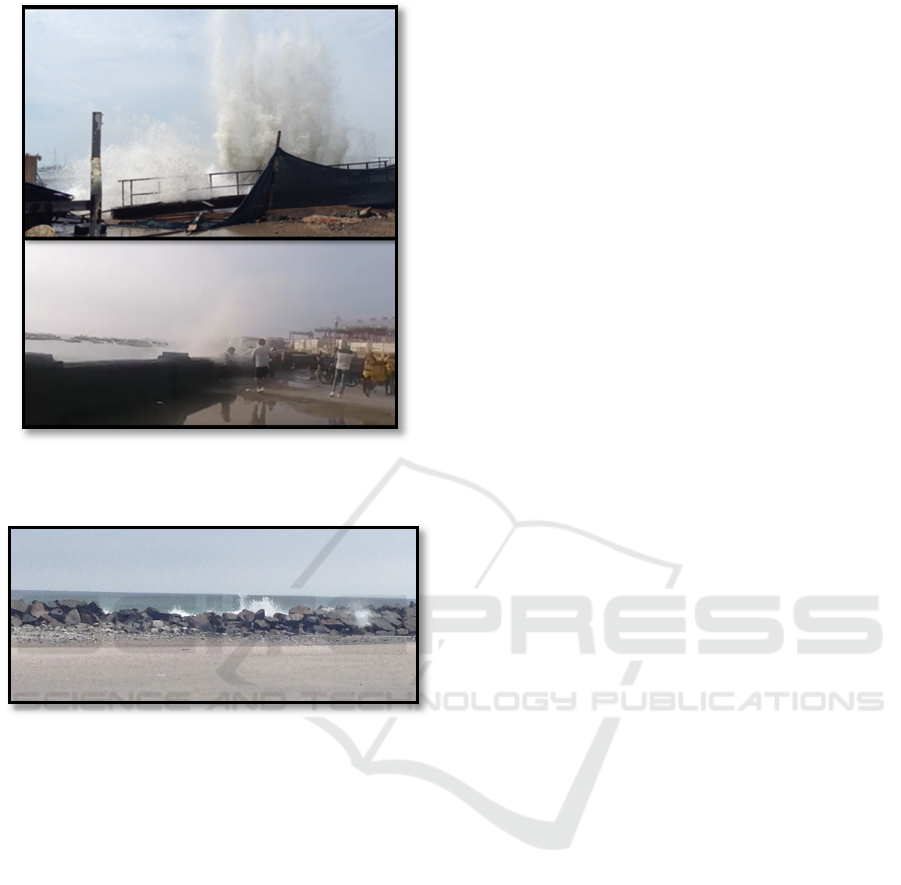
Figure 18: Waves that were presented in Plaza Grau and La
Punta. Source: Martínez, 2021.
Figure 19: Waves that were stopped by the La Arenilla
breakwater. The photograph was taken by the authors in
January 8, 2021.
7 CONCLUSIONS
The numerical modeling presents the possible wave
scenarios in the study area in specific wave situations,
but these scenarios must be validated with data
dispersion criteria. The direction of the waves is an
important variable since it serves as an indicator of
the areas where the waves will be aggressive and
would cause damage to structures and put the
population on alert. Usually, the waves between the
south and southeast directions generate waves less
than 0.5m close to the southern zone of the La Punta
district and the La Perla district. However waves
coming from northwest directions generate waves
with 2m of height close to the north of Callao bay. In
the case of extreme wave events, the lowest wave
height that can occur on the coast has a magnitude of
around 2m, which may vary due to the shape of the
coastline and coastal structures. Likewise, the most
dangerous wave direction is the West-Northwest
since the modeled scenarios show that both in the
medium and extreme regime the wave heights are
significant. In normal conditions the waves coming
from the west southwest can reach heights of around
2m near the coast, but in extreme conditions these
could reach 3m or more. It has been observed that San
Lorenzo Island protect to study area from waves
especially when it is coming from South and South-
west directions.
Finally, the porpoise of this paper was
characterizing the mean and extreme regime of wave
in Callao bay to provide a tools of decision makers to
prevent future events of flooding by waves.
REFERENCES
Erikson, L., Hegermiller, C., Ruggiero, P., & VanOrmondt.
(2015). Projected wave conditions in the Eastern North
Pacific under the influence of two CMIP5 climate
scenarios. Ocean Modelling, 171-185.
doi:http://dx.doi.org/10.1016/j.ocemod.2015.07.004.
Ruggiero, P. (2013). Is the intensifying wave climate of the
US Pacific Northwest increasing flooding and erosion
risk faster than sealevel rise? Journal of Waterway Port
Coastal and Ocean Engineering, 88-97.
doi:10.1061/(Asce)Ww.1943-5460.0000172.
Barnard, P. L., Erikson, L. H., Foxgrover, A. C., Hart, J. A.
F., Limber, P., O’Neill, A. C., … Jones, J. M. (2019).
Dynamic flood modeling essential to assess the coastal
impacts of climate change. Scientific Reports, 9(1), 1–
13. https://doi.org/10.1038/s41598-019-40742-z
Gainza, J., Rueda, A., Camus, P., Tomás, A., Méndez, F. J.,
Sano, M., & Tomlinson, R. (2018). A Meta-Modelling
Approach for Estimating Long-Term Wave Run-Up
and Total Water Level on Beaches. Journal of Coastal
Research, 342(2), 475–489. https://doi.org/10.2112/
jcoastres-d-16-00198.1
INEI (2018) Población del Perú totalizó 31 millones 237
mil 385 personas al 2017.INEI Instituto Nacional de
Estadística e Informática. Recuperado de:
https://www.inei.gob.pe/
Guzman, E., Ramos, C., & Dastgheib, A. (2020). Influence
of the el nino phenomenon on shoreline evolution. Case
study: Callao bay, Peru. Journal of Marine Science and
Engineering, 8(2). https://doi.org/10.3390/jmse8020090
Lainez Yonce, A. (1 de Mayo del 2015) Oleaje: alerta en el
Callao y Costa Verde por inundaciones. Crónica Viva.
Recuperado de: http://www.cronicaviva.com.pe/oleaje-
alerta-en-el-callao-y-costa-verde-por-inundaciones/
Perú 21 (4 de Febrero del 2016) Callao sigue afectado por
fuerte oleaje [Fotos y video]. Perú 21. Recuperado de:
https://peru21.pe/lima/callao-sigue-afectado-fuerte-
oleaje-fotos-video-210087-noticia/?ref=p21r
Modeling Normal and Extreme Wave Conditions in Callao Bay, Peru using Reanalysis Data
201

Caldwell, P. C., M. A. Merrifield, P. R. Thompson (2015),
Sea level measured by tide gauges from global oceans
— the Joint Archive for Sea Level holdings (NCEI
Accession 0019568), Version 5.5, NOAA National
Centers for Environmental Information, Dataset,
doi:10.7289/V5V40S7W.
National Oceanic and Atmospheric Administration (w.d.)
Wavewatch III Hindcast and reanalysis archives.
Environmental Modeling Center NOAA NWS National
Centers FOR Environmental Prediction. Recuperado el
27 de Agosto del 2020. https://polar.ncep.noaa.gov/
waves/hindcasts/
Chen, Y., Xie, D., Zhang, C., & Qian, X. (2013). Estimation
of long-term wave statistics in the East China Sea.
Journal of Coastal Research, 65, 177–182.
https://doi.org/10.2112/si65-031.1
Kim, I. C., & Suh, K. D. (2018). Effect of Sea Level Rise
and Offshore Wave Height Change on Nearshore
Waves and Coastal Structures. Journal of Marine
Science and Application, 17(2), 192–207.
https://doi.org/10.1007/s11804-018-0022-8
Frihy, O. E., Deabes, E. A., & El Gindy, A. A. (2010).
Wave climate and nearshore processes on the
mediterranean coast of Egypt. Journal of Coastal
Research, 26(1), 103–112. https://doi.org/10.2112/08-
1020.1
Yuk, J.-H., Park, J., & Joh, M. (2018). Modelling of Storm-
induced Seawater Flooding in the Suyeong River Area,
South Korea: A Case Study due to the Storm Surge and
Waves during Typhoon Sanba. Journal of Coastal
Research, 85, 746–750. https://doi.org/10.2112/si85-
150.1
DELTARES (2014) Delft3D-WAVE, User Manual. The
Netherlands. Deltares.
Hamza, W., Lusito, L., Ligorio, F., Tomasicchio, G. R., &
D’Alessandro, F. (2018). Wave climate at
shallowwaters along the Abu Dhabi coast. Water
(Switzerland), 10(8), 1–19. https://doi.org/10.3390/
w10080985
Martínez Moreno, Xenia (23 de Enero del 2021) Callao:
Oleaje anómalo se registra en Callao. RPP Noticias.
Recuperado de: https://rpp.pe/peru/callao/callao-
oleaje-anomalo-se-registra-en-la-punta-video-noticia-
1316800?ref=rpp
GISTAM 2021 - 7th International Conference on Geographical Information Systems Theory, Applications and Management
202
