
A Multi-Scale, Web-based Application for Strategic Assessment of PV
Potentials in City Quarters
Sally Köhler
1a
, Rosanny Sihombing
2b
, Eric Duminil
1
, Volker Coors
2c
and Bastian Schröter
1d
1
Center for Sustainable Energy Technology, Hochschule für Technik Stuttgart, Schellingstraße 24, Stuttgart, Germany
2
Center for Geodesy and Geoinformatics, Hochschule für Technik Stuttgart, Schellingstraße 24, Stuttgart, Germany
Keywords: Energy Simulation Tool, Urban Modeling Usability, Web-based Application for Energy Concepts, Feasibility
and Efficiency of PV Systems, Neighborhood Strategies, Stepless Scalability.
Abstract: This paper introduces a web-based application that visualizes building specific simulation results regarding
renewable potentials and economics for entire city quarters. Focusing on the building stock, this application
enables decision-makers to consider energy related aspects in early-stage city quarter planning. The applica-
tion builds on the existing energy simulation platform, SimStadt, which allows the detailed assessment of
buildings’ energetic performance or photovoltaic rooftop potentials based on 3D CityGML models. A new,
user-friendly and browser-based graphical user interface (GUI) makes energetic modeling more accessible
and independent of a user’s operating system. Furthermore, a customizable economic analysis was added to
the pre-existing workflow to calculate rooftop PV potentials, allowing the evaluation of renewable energy
potentials with their associated total investments or levelized cost of electricity (LCOE) at building level.
Combined, these improvements create new use cases for modeling environments previously reserved for re-
searchers, such as enabling utilities and their house-owning customers to identify PV potentials and costs, or
PV project developers to more easily and accurately locate neighborhoods with high potential. Further func-
tionalities such as building heating and cooling demand assessment will be included in a next step to extend
the scope of this application towards a versatile urban energy system simulation platform.
1 INTRODUCTION
The European Commission’s plan for a Green New
Deal proposes raising its greenhouse gas (GHG)
emissions reduction target for 2030 from 40% to 55%
compared to 1990 levels (European Commission,
2020). As buildings are responsible for about 40% of
energy consumption and 36% of CO
2
emissions in the
EU and are by this the single largest energy consumer
in Europe (European Commission, 2020), any reduc-
tion in GHG emissions must focus on cities, where
the use of renewable energy technologies, particularly
in the building stock, needs to be increased.
Hence, approaches and tools that simplify the en-
ergetic assessment of the building stock and that pro-
pose technologically and financially feasible options
towards sustainable city quarter planning are needed.
a
https://orcid.org/0000-0002-6377-9221
b
https://orcid.org/0000-0001-7447-5760
c
https://orcid.org/0000-0002-0413-8977
d
https://orcid.org/0000-0002-7915-1471
Such tools should feature a high level of detail regard-
ing spatial and/or temporal resolution in order to pro-
vide meaningful information for key stakeholders
such as city officials or project developers to act
upon.
A review of existing modeling approaches and
tools for energy system simulation on the scale of city
quarters are presented in (Allegrini et al., 2015), un-
derlining the challenges that arise, such as the provi-
sion of an intuitive tool capable of supporting deci-
sion-makers at an early stage in the planning process
or the need for tools that can perform parametric anal-
yses at neighborhood level, taking into account eco-
nomic and environmental parameters. This is sup-
ported by (Meskel & Weber, 2017), while reviewing
seven European cities and their tools for energy and
urban planning, finding a lack of adequate instru-
ments for energy planning at urban scale as well as
110
Köhler, S., Sihombing, R., Duminil, E., Coors, V. and Schröter, B.
A Multi-Scale, Web-based Application for Strategic Assessment of PV Potentials in City Quarters.
DOI: 10.5220/0010406201100117
In Proceedings of the 10th International Conference on Smart Cities and Green ICT Systems (SMARTGREENS 2021), pages 110-117
ISBN: 978-989-758-512-8
Copyright
c
2021 by SCITEPRESS – Science and Technology Publications, Lda. All rights reserved

the need for improvement of diagnosis tools to sup-
port early-stage decision-making. In addition,
(Mavromatidis et al., 2019) concludes that any energy
modeling and simulation application on city-quarter
scale should be user-friendly, meet the industry´s
needs and be available either commercially or as open
source. Lastly, (Schoof et al., 2013) shows that tools
that assess for example solar potentials based on Ge-
ographic Information Systems (GIS) allow to im-
prove interactions between key stakeholders, such as
communal planners and energy producers.
Using 3D building stock models allows to process
exact building volumes, surfaces, roof shapes etc.,
whereas 2D data can lead to inaccurate information in
particular regarding PV potentials, if roof geometries
or shadowing effects cannot be assessed properly.
Well-developed tools for energy system analyses
like TRNSYS (Thermal Energy System Specialists,
LLC, 2020) or EnergyPlus (U.S. Department of En-
ergy’s Building Technologies Office, 1996-2019) in
combination with the graphical interface of OpenStu-
dio (Brackney et al., 2018) simulate energy demands,
peak loads and consider a wide range of technologies.
These tools feature user-friendly interfaces and oper-
ate on 3D building information. However, since they
need detailed inputs for each building, they are not
applicable to city quarters, in particular in early plan-
ning stages. In contrast, urban information platforms
such as Solarpotenzial 3D-Stadtvermessung Wien
use large scale 3D data as input and focus on the sim-
ulation of solar potentials, but does not take other
technologies into account. (Stadt Wien, 2018)
(Alhamwi et al., 2019) gives an overview of cur-
rent GIS-based urban energy system models, like
City-Sim, DUE-S and others, introducing the plat-
form FlexiGIS. FlexiGIS uses 2D GIS data as input
and the open-source toolbox urbs, which is an extend-
able tool for the investigation of energy scenarios at
urban scale, considering PV, solar, wind, biomass and
hydropower (Alhamwi et al., 2018). As a case study
the city Oldenburg, Germany was assessed, but not
on a single-building basis (Alhamwi et al., 2019).
Re3ason is another platform that analyzes energy
demands, renewable energy as well as technology po-
tentials (wind, photovoltaics, biomass), and adds a
techno-economical optimization for the energy sys-
tem on top. However, the 2D spatial resolution is re-
stricted to municipal boundaries. (Mainzer, 2019)
This work introduces a web-based tool that on the
one hand handles the complexity of calculating en-
ergy demands, evaluating and dimensioning possible
renewable energy supply systems scenarios with a
solid understanding of the associated potentials at a
detailed, sub-city level. On the other hand, it provides
a clear, user-friendly 3D visualization, which enables
the assessment of a quantitative and technology-neu-
tral verification of the technical and financial feasibil-
ity as well as the efficiency of neighborhood strate-
gies and local energy concepts on a granular level in
real time. The work is presented in five chapters. Fol-
lowing the introduction, the methodology is ex-
plained in Chapter 2. Chapter 3 summarizes the re-
sults and gives a case study demonstration, followed
by a discussion in Chapter 4 and a conclusion in
Chapter 5.
2 METHODOLOGY
The proposed tool enhances the already established
energy simulation platform SimStadt. SimStadt uses
the open data model City Geography Mark-up Lan-
guage (CityGML) (Coors et al., 2016), i.e. 3D build-
ing models, as principal source of input. SimStadt has
a range of databases and calculation routines, e.g.,
photovoltaic rooftop potentials (Nouvel et al., 2017),
building heating/cooling (Eicker et al., 2018) or water
demands (Bao et al., 2020b) implemented and vali-
dated. It utilizes the dynamic energy simulation en-
gine INSEL (Schumacher, 2020) and is structured
along modular workflows that allow its users to eval-
uate different energy technologies, making it easier to
compare different technologies and create combined
scenarios. The simulation within SimStadt can be per-
formed on user-defined areas, as long as a CityGML
file is available, enabling the simulation of both a few
individual houses and entire cities. Provided its base
of 3D city models is geometrically correct, SimStadt
can assess building energy and water demands, refur-
bishment measures, and the integration of renewable
energy systems (PV, solar thermal, biomass) with
high accuracy, and offers the option of 2D visualiza-
tion and results in csv-format (Bao et al., 2020a;
Braun et al., 2018). SimStadt has been successfully
applied to inner-city quarters (Dochev et al., 2020),
quarters dominated by single-family houses (Weiler
et al., 2019) with hundreds of buildings as well as to
larger ensembles such as Brooklyn, a district of New
York (Eicker et al., 2020), featuring thousands of
buildings.
The present work enhances the existing tool by
adding a method for assessing key financial metrics
to the preexisting workflow calculating rooftop PV
potentials and establishes a web based user-friendly
GUI.
A Multi-Scale, Web-based Application for Strategic Assessment of PV Potentials in City Quarters
111

2.1 3D User Interface
In the context of smart cities, geovisualization and
visual analysis are applied to better understand under-
lying data and identify trends, patterns and contexts,
making a city's economy, mobility, environment,
people and management smarter (Harbola & Coors,
2018). Compared to 2D, a 3D geovisualization offers
a more realistic (over-)view and can include detailed
features, such as building specifications and physical
representations, that provide better understanding of
the urban environment (Esri, 2014). With regards to
3D urban visualization options, the Web Graphics Li-
brary (WebGL) (Khronos Group, 2020) is a cross-
platform web standard for rendering interactive 2D
and 3D graphics in a compatible web browser without
requiring plug-ins (Evans et al., 2014).
A study comparing X3DOM (ICG, 2020), three.js
(Three.Js, 2020) and CesiumJS (CesiumJS
contributors, 2020) as an open-source WebGL frame-
work in web-based geospatial applications is pre-
sented in (Krämer & Gutbell, 2015). The study re-
veals that it is possible to develop a geospatial appli-
cation using three.js or X3DOM, even though, unlike
CesiumJS, these two frameworks do not explicitly
support the geospatial reference system. In conclu-
sion, the study reveals that the investigated frame-
works were developed from different approaches and
goals, e.g., aiming at geospatial or non-geospatial ap-
plications, and that the selection of the right frame-
work depends on the use case.
While the intention of CityGML is per se not to
visualize 3D buildings in a web-browser, it can be
converted into 3D Tiles format, applying CesiumGS
(CesiumGS contributors, 2020), without losing sub-
stantial properties, such as building or surface IDs.
3D Tiles is an open specification for streaming mas-
sive heterogeneous 3D geospatial datasets across
desktop, web, and mobile applications.
The realization of a browser-based visualization
in the front-end, based on CesiumJS and 3D Tiles, al-
lows users to interact with SimStadt, INSEL and other
data sources running in the back-end, without in-
stalling new software. For technical and financial as-
sessments, users can submit their input data and pa-
rameters to SimStadt in the back-end via the web-
based GUI. After calculation, the result is sent back
to the front-end and visualized in 3D in the web-
browser. The visualization is carried out by mapping
the result data to 3D Tiles, which holds the building
and surface IDs from the CityGML file used in the
analysis process. Additionally, the CesiumJS-based
browser can be underpinned with OpenStreetMap sat-
ellite image (OpenStreetMap contributors, 2020).
To evaluate the usability of the new web-based
application, a survey and a structured interview was
conducted with five users. Participant A is the head
of climate department of a mid-sized German city,
while participants B to E are computer sciences grad-
uate students at University of Applied Sciences
Stuttgart. While the interview with participant A
aimed at evaluating the usability of the new applica-
tion for strategic energy planning at city level, partic-
ipants B to E were expected to provide more general
feedback on the technical implementation and poten-
tial improvements of the GUI and background pro-
cesses. Participant A did the following tasks under su-
pervision:
Find the address in an urban area that is sought
in the task.
Run the newly implemented PV potential and
financial analysis workflow within the web-
based GUI and assess its results (with the de-
fault input values and participant-defined input
values).
After these tasks were finished, the participant
gave feedback on the 3D visualization and the user-
friendliness of the application. The evaluation with
participants B to E aimed at assessing the applica-
tion’s usability for persons with less knowledge of the
energy sector. Without assistance, the participants
were asked to do the following tasks:
Find a specific house by the address in the tar-
get urban area.
Run the PV potential and financial analysis
with default input parameters.
While working on the tasks, measurable indicators
were recorded, such as the number of clicks or the time
taken for above-mentioned tasks. Furthermore, the tar-
geting of participants’ clicks or whether participants
encountered problems was assessed and rated from 1
to 5, with 1 being the best and 5 worst score.
2.2 Dynamic Cost Analysis of PV
Rooftop Installations
To assess the financial feasibility of a given technol-
ogy, a flexible economic analysis was established us-
ing the example of the workflow that calculates roof-
top photovoltaic potentials within SimStadt (Eicker et
al., 2018). Based on data from the CityGML file
(building geometries and orientation), the pre-exist-
ing PV workflow calculates physical parameters, rel-
evant for assessing installation cost or LCOE, in par-
ticular the installed power in kW
p
, annual yield in
kWh/a and specific yield in kWh/(kW
p
a) on a single-
building level.
SMARTGREENS 2021 - 10th International Conference on Smart Cities and Green ICT Systems
112
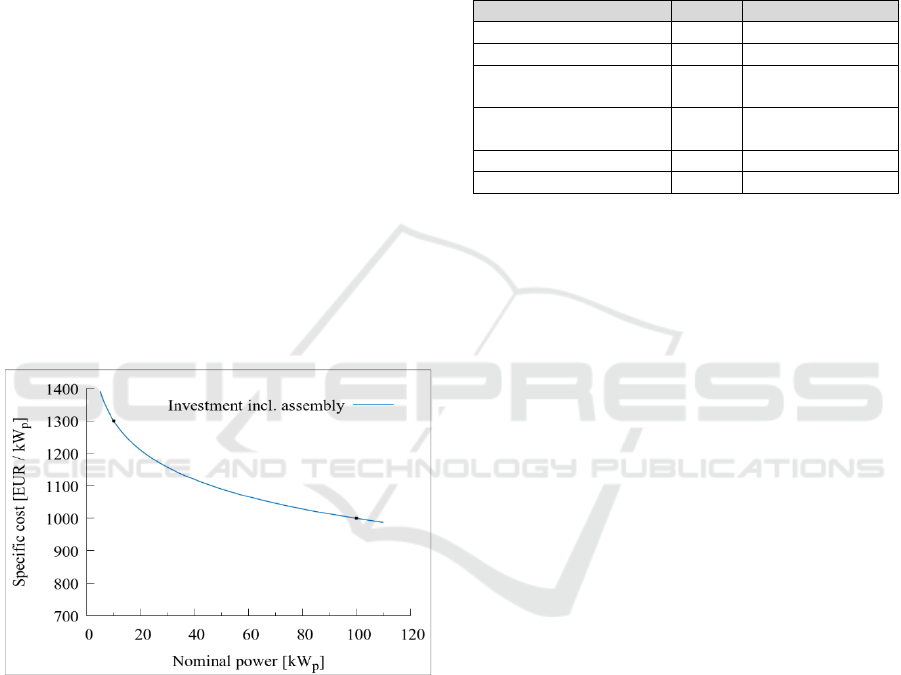
Since installation cost are subject to economies of
scale, i.e., specific cost for larger installations are
lower than for smaller ones, all else being equal, dy-
namic cost functions are established. The cost func-
tion is determined by two customizable data points
(S1 and S2), which represent the installation cost in
EUR/kW
p
for a small system (S1), e.g., 10kW
p
, and a
larger rooftop PV system (S2), e.g., 100kW
p
. A loga-
rithmic fit function through S1 and S2 establishes the
dynamic cost function (1) as:
C
i
= A - B* log(P
n
/ 1kW
p
) (1)
With:
C
i
= installation cost for a PV system of a given
size [EUR/kW
p
]
A = installation cost for a PV system with 1kW
p
[EUR/kW
p
]
B = cost digression factor [EUR/kW
p
]
P
n
= nominal power [kWp]
Figure 1 shows a graph of a potential cost func-
tion, with S1 defined as (10kW
p
| 1,300EUR/kW
p
)
and S2 as (100kW
p
| 1,000EUR/kW
p
), based on
(Fraunhofer ISE, 2020). In that case, specific installa-
tion cost decrease by -23% from 10kW
p
to 100kW
p
.
Figure 1: Dynamic cost function (1), with data points
(10kWp | 1,300EUR/kWp) and (100kWp |
1,000EUR/kWp).
Further parameters that influence the economic at-
tractiveness of a PV system, namely cost of capital as
well as operating and maintenance cost as a percent-
age of installation cost, are also considered. To not
only calculate system LCOE but to rate the financial
attractiveness of a given system, information on local
electricity prices and potential feed-in tariffs needs to
be considered as well.
In all cases, users can either keep default values or
customize parameters in the web-based GUI, allow-
ing to conduct parameter studies and the creation of
simple scenarios in real-time. Table 1 shows the pa-
rameters and their default value setting.
Table 1: Default financial parameters for PV rooftop system
assessment, 1: (Fraunhofer ISE, 2020) p.24,71,8; 2: (Statis-
tisches Bundesamt [Destatis], 2020) p.48; 3: (Bundesnet-
zagentur, 2020); 4: (KPMG International, 2020).
Parameter Value Unit
Asset life time
1
20 year
Self-consumption rate
1
30 %
Operating cost as share
of installation cost
1
1.0 %
Electricity cost
(Germany)
2
30.0 EURct per kWh
Feed-in tariff
3
8 EURct per kWh
Cost of capital
4
2 %
Results of the financial assessment of rooftop PV
systems include total investment cost in EUR, operat-
ing and maintenance costs in EUR/a, LCOE in
EURct/kWh, net present value (NPV) in EUR, inter-
nal rate of return (IRR) in %, the asset’s (discounted)
payback period in years as well as a statement on fi-
nancial feasibility (yes/no) for each roof, assumed
“yes” if the payback period is less than 20 years.
3 RESULTS
3.1 Visualization and Usability
The web-based user interface is split in two main
parts, a menu window on the left, and a 3D visualiza-
tion window on the right part of the screen. Figure 2
displays the GUI after starting the application and
highlights four options a user can use to adjust the
visualization window: No.1 defines the menu where
the user choses the geographical location and technol-
ogy to be assessed, and where parameters are custom-
ized. Furthermore, result graphs are shown therein.
With No. 2, the user can set time, date and the rate at
which time advances for visualizing shadowing ef-
fects, which are important for understanding inner
city rooftop PV potentials. In the top right corner, No.
3 offers the option to search for an address, help nav-
igating the map or running simulations. Lastly, No. 4
is an information window indicating specific building
information, such as building ID and the year of con-
struction, when moving the cursor over a particular
building.
A Multi-Scale, Web-based Application for Strategic Assessment of PV Potentials in City Quarters
113

Figure 2: Screenshot of the web-based user interface, with
four call-outs. 1: main menu, 2: time and date setter, 3:
search and help options, 4: information pop-up for particu-
lar buildings.
When conducting the usability study with the cli-
mate protection manager (participant A) the given
tasks were handled effortlessly. The feedback con-
tained remarks such that the 3D map is intuitive, the
3D visualization as well as the summarized results in
pie chart format are comprehensible, and the custom-
izable parameters are beneficial for creating scenar-
ios. Suggestions for further improvement included the
need for pop-up information buttons explaining input
parameters. Additionally, participant A asked for a
more detailed coloring of the results and the possibil-
ity for a multidimensional result graphics e.g., plot-
ting the total nominal power in kW
p
of a whole urban
area under a particular total investment in EUR value.
Participants B to E solved the given tasks in on
average about three minutes. The majority of this time
was related to the processing time of the application,
i.e. the data flows to and from SimStadt as well as the
simulation’s calculation time. Of the four partici-
pants, one (D) was not able to find the target address
and the survey was terminated after 4m15s. All re-
sults from this survey are summarized in Table 2.
In general, the participants found the 3D map to
be intuitive. As potentials improvements, a more de-
tailed interpretation of the analysis results was sug-
gested, particularly when looking at the results of an
individual building as opposed to a city quarter. Also,
the menu options were considered as too complex.
Based on that feedback, this feature was revised. As
described in chapter 2, an expert user now choses two
values for installation costs for PV rooftop systems of
two sizes, as well as other parameters. This can either
be done by moving slide bars or setting the parameter
value in specified text boxes. The slide bars with pre-
defined ranges were established in order give the us-
ers orientation about realistic price ranges, e.g. in
terms of installation cost per kW
P
. Additionally, fur-
ther tooltips and user instructions have been imple-
mented, in particular instructional videos that explain
the most relevant steps and features.
3.2 Case Study Demonstration
To demonstrate the potential of the enhanced tool and
GUI, a part of the inner-city quarter of Stöckach in
central Stuttgart was assessed in detail. The CityGML
file of Stöckach contains 187 buildings, of which 106
are residential. The year of construction of the build-
ings varies from 1934 to 2015. Furthermore, the total
roof area is 29,901m², of which 25,151m² are as-
sessed as in principle suitable for PV systems, as ar-
eas under 20m² are not considered for reasons of prac-
ticability. It is assumed that 30% of the area of flat
roofs and 40% of the area of tilted roofs can effec-
tively be covered with PV modules, taking the eleva-
tion and shading of the modules as well as roof edges
and further rooftop installations, e.g. HVAC systems,
into account. (Bergner et al., 2018).
A minimum insolation of 950kWh/(m² a) is set as
threshold for installing financially feasible PV sys-
tems in Germany today (Fraunhofer ISE, 2020), ef-
fectively excluding north-facing areas or shadowed
roofs. Taken these restrictions into account, Sim-
Stadt’s rooftop PV workflow operating in the back-
end calculates the available effective roof area for PV
with 8,974m², a total nominal power potential of
1,155kW
p
with a potential yield of 1,187MWh/a.
Table 2: Results of usability study with participants B to E. Row 1 to 3 are measurable indicators, row 4 to 7 are observation
indicators. For line 4 and 5, a rating was given based on participants performance, with 1 being best and 5 being worst.
Participant B Participant C Participant D Participant E
1. No. of clicks 7 20 26 5
2. Handling time 3 Min 23 Sec 2 Min 5 Sec 4 Min 15 Sec 2 Min 35 Sec
3. Finished task successfully? Yes Yes No Yes
4. Have first clicks been target orientated? 1 1,5 1 1.5
5. Did participant run into problems? 2.5 2.0 3.5 1.5
6. Most helpful feature Intuitive map - Intuitive map -
7. Feature that can be improved Expert mode Expert mode Search for address -
SMARTGREENS 2021 - 10th International Conference on Smart Cities and Green ICT Systems
114
After running the analysis, a dropdown menu al-
lows the user to choose which parameters is visual-
ized, color coding all buildings of the chosen area.
Moreover, pie charts evaluate the parameter of choice
on an aggregated level. Parameters that can be chosen
are: potential yield, specific yield, LCOE, total in-
vestment, discounted payback period, and financial
feasibility.
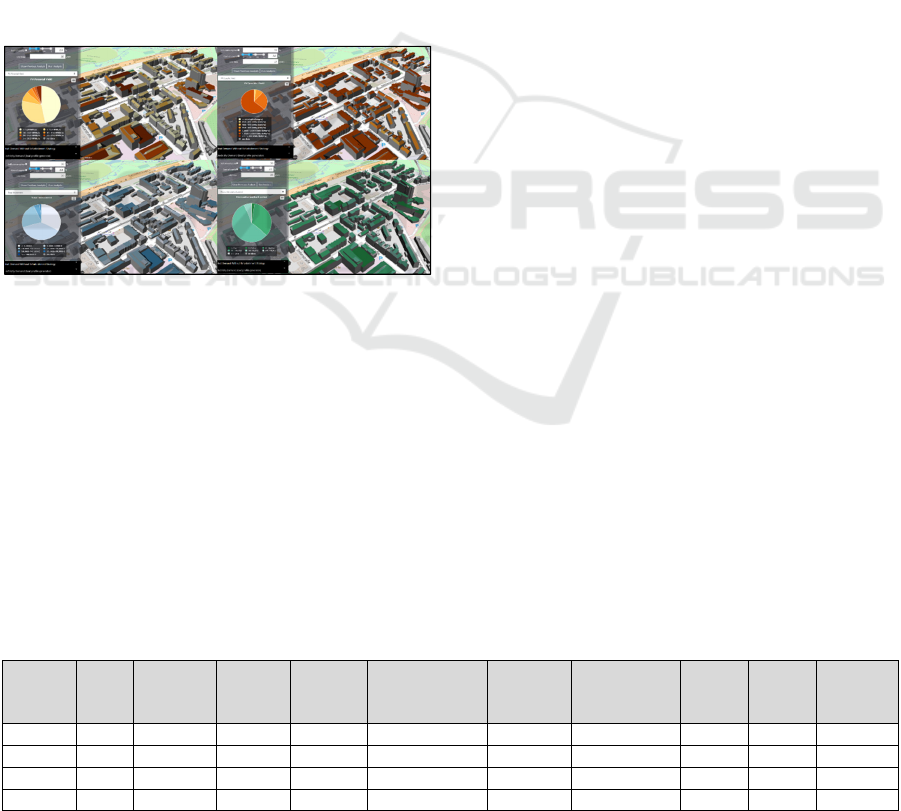
Figure 3 summarizes some output options of the
web-based application the case study of Stöckach.
Photovoltaic yields in MWh/a per roof are colored in
dark red to light yellow shades (top left). The specific
yield in kWh/(m²a), in the top right corner, helps to
identify roofs that are particularly attractive. Dark
colors indicate higher (specific) yields. The bottom
left corner shows the total investment per roof (dark
blue shades represent higher investments), while the
bottom right section marks the discounted payback
period in green. The darker the shade the smaller the
value for the discounted payback period.
Figure 3: Visualization of PV potentials and economics;
Top left: PV yield in MWh/a; Top right: LCOE in
EURct/kWh; Bottom left: total investment in EUR; Bottom
right: discounted payback period in years.
By clicking on individual roofs, detailed results
are displayed in a pop-up table in the upper right cor-
ner, providing an individual evaluation. All results
can be downloaded as *.csv-files or in *.png/ jpeg-
format. In addition to the 3D visualization, all result
values can be exported in text or table format.
Table 3 shows an excerpt of the information that
can be exported, with a focus on the newly added fi-
nancial parameters.
Key results for the case study Stöckach include:
Total investments per roof range from
1,550EUR to 42,890EUR
LCOE ranges from 6.4 EURct/kWh to 13.5
EURct/kWh, comparable with (Fraunhofer
ISE, 2020), where the LCOE ranges from 8 to
14EURct/kWh
Discounted payback periods range from 7.1
years to 17.9 years
4 DISCUSSION
A server-oriented software architecture for urban
simulations, based on standard interfaces (simulation
as a service) and generally available data, with data
integration via a 3D city model in a web browser, cre-
ates a tool that can reach a wide range of users. By
enhancing the SimStadt energy simulation platform
through linking it with a web-based interface and add-
ing an economic analysis to a pilot workflow, such a
tool was established. The tool´s usability has been
tested with energy experts and non-experts, and their
feedback was implemented. There is awareness that
number of participants for the usability study was too
very small to draw final conclusions, nonetheless the
feedback was very valuable for the development of
prototype layout of the GUI. More comprehensive us-
ability studies with the revised tool are planned.
The tool in its current state allows users to calcu-
late detailed photovoltaic potential in real-time; with
this information, installation schedules can be devised
that prioritize buildings based on amortization peri-
ods, or advertising campaigns that target neighbor-
hoods with high PV yields first.
The simulation of the case study illustrates under
which framework conditions the installation of inner-
city PV systems is profitable. Since this kind of sim-
ulation depends on many factors such as local
weather, costs or a given regulatory circumstances, it
is important to be able to run multiple scenarios in
real-time. In this respect, the presented tool provides
the user with these options with a low entry barrier
thanks to its browser-based GUI.
Table 3: Excerpt from the PV potential simulation and feasibility calculation of Stöckach for a selection of roof surfaces.
Building
ID
Area Irradiance Nominal
power
Yield PV specific
yield
Total
investment
LCOE Net
present
value
Internal
rate of
return
Financial
feasibility
[-] [m²] [W/m²] [kW
p
] [MWh/a] [kWh/ (kW
p
a)] [EUR] [EURct/ kWh] [EUR] [%] [-]
0006b63 103.7 140.8 6 6.29 1,049 9,132 10.33 4,394 6.48 yes
0038d34 990.7 145.0 44 47.50 1,080 46,028 6.89 59,849 12.80 yes
001b05b 32.0 109.6 1 0.82 816 1,950 17.00 -320 0.21 no
A Multi-Scale, Web-based Application for Strategic Assessment of PV Potentials in City Quarters
115

5 CONCLUSION
The presented tool offers municipalities, urban plan-
ners, project developers or utilities the possibility to
model costs and potentials of a renewable energy
technology for areas comprising a few buildings up to
an entire city, without sacrificing calculation accu-
racy. The browser-based architecture and GUI render
the application accessible and intuitive, requiring no
prior installation of software.
Applying the tool to a case study showed that the
technical and financial results were consistent with
other recent studies, both for the entire quarter as well
as at individual building level. The fact that partici-
pant A in his function as climate protection manager
applies the current version of the tool frequently to
discuss potential PV locations with local businesses
and the city council gives (anecdotal) evidence of its
usefulness.
The advantage of the presented approach resides
in the scalability of the application, which utilizes
typically available 3D CityGML models as a founda-
tion, which means that (i) spatial resolutions from sin-
gle house perspective to whole cities are possible and
(ii) further workflows, e.g. on building heating and
cooling demands or refurbishment potentials, may be
added with reasonable effort.
Since the methods presented here are generic, they
will be transferred to other energy technologies that
are already implemented in the desktop version of
SimStadt, but also to new workflows, e.g., on socio-
economic parameters such as income levels are rates
of house ownership on district level. Such a tool can
be an innovative, integral instrument enabling a more
holistic planning of energy concepts at regional, city
or neighborhood level early on in the decision-mak-
ing process, as it integrates technical potentials, cost
parameters and other decisive factors, such as rates of
house ownership in a district, which is a relevant fac-
tor in decision making, e.g. with regards to building
renovation or PV installations. Given its technology
and manufacturer independent approach, such a tool
would also create the necessary levels of transparency
and trust in its results for decision makers to act upon.
ACKNOWLEDGEMENTS
The financial support provided by the Federal Minis-
try of Education and Research (BMBF) under the pro-
motion and supervised by the project executing or-
ganization VDI Technologiezentrum GmbH for the
project i_city is gratefully acknowledged. Further-
more, we like to thank Alexandra Mittelstädt and
Chris Kesnar, which contributed also to the project.
REFERENCES
Alhamwi, A., Medjroubi, W., Vogt, T. & Agert, C. (2018).
Flexigis: An Open Source GIS-based Platform for the
Optimisation of Flexibility Options in Urban Energy
Systems. Energy Procedia, 152, 941–946.
https://doi.org/10.1016/j.egypro.2018.09.097
Alhamwi, A., Medjroubi, W., Vogt, T. & Agert, C. (2019).
Development of a GIS-based platform for the allocation
and optimisation of distributed storage in urban energy
systems. Applied Energy, 251(113360).
https://elib.dlr.de/128434/
Allegrini, J., Orehounig, K., Mavromatidis, G., Ruesch, F.,
Dorer, V. & Evins, R. (2015). A review of modelling
approaches and tools for the simulation of district-scale
energy systems. Renewable and Sustainable Energy
Reviews, 52, 1391–1404. https://doi.org/10.1016/
j.rser.2015.07.123
Bao, K., Padsala, R., Coors, V., Thrän, D. & Schröter, B.
(2020a). GIS-based Assessment of Regional Biomass
Potentials at the Example of two Counties in Germany.
Conference: 28th European Biomass Conference and
Exhibition.
Bao, K., Padsala, R., Thrän, D. & Schröter, B. (2020b). Ur-
ban Water Demand Simulation in Residential and Non-
Residential Buildings Based on a CityGML Data Model.
ISPRS International Journal of Geo-Information, 9(11),
642. https://doi.org/10.3390/ijgi9110642
Bergner, J., Siegel, B., Mainzer, K [Kai] & McKenna, R.
(Hg.) (2018). Städtische Solarpotenzial-Karten im
Vergleich.
Brackney, L., Parker, A., Macumber, D. & Benne, K.
(2018). Building Energy Modeling with OpenStudio: A
Practical Guide for Students and Professionals.
Springer. https://doi.org/10.1007/978-3-319-77809-9
Braun, R., Weiler, V., Zirak, M., Dobisch, L., Coors, V. &
Eicker, U. (2018). Using 3D CityGML Models for
Building Simulation Applications at District Level.
Vorab-Onlinepublikation.
https://doi.org/10.1109/ICE.2018.8436355
Bundesnetzagentur. (27. Oktober 2020). Anzulegende
Werte für Solaranlagen in Cent/kWh bei
Inbetriebnahme nach dem 31.12.2018.
CesiumGS contributors. (2020). CesiumGS 3D Tiles.
https://github.com/CesiumGS/3d-tiles
CesiumJS contributors. (2020). CesiumJS. https://ce-
sium.com/cesiumjs/
Coors, V., Andrae, C. & Böhm, K.‑H. (2016). 3D-
Stadtmodelle: Konzepte und Anwendungen mit
CityGML. Wichmann.
Dochev, I., Gorzalka, P., Weiler, V., Schmiedt, J. E.,
Linkiewicz, M., Eicker, U., Hoffschmidt, B., Peters, I.
& Schröter, B. (2020). Calculating urban heat demands:
An analysis of two modelling approaches and remote
SMARTGREENS 2021 - 10th International Conference on Smart Cities and Green ICT Systems
116

sensing for input data and validation. Energy and Build-
ings, 226, 110378. https://doi.org/10.1016/
j.enbuild.2020.110378
Eicker, U., Weiler, V., Schumacher, J. & Braun, R. (2020).
On the design of an urban data and modeling platform
and its application to urban district analyses. Energy
and Buildings, 217, 109954. https://doi.org/10.1016/
j.enbuild.2020.109954
Eicker, U., Zirak, M., Bartke, N., Romero Rodriguez., L. &
Coors, V. (2018). New 3D model based urban energy
simulation for climate protection concepts. Energy and
Buildings, 163, 79–91. https://doi.org/10.1016/
j.enbuild.2017.12.019
Esri (2014). 3D Urban Mapping: From Pretty Pictures to
3D GIS (An Esri White Paper).
European Commission (Hg.). (2020). 2030 climate & en-
ergy framework. https://ec.europa.eu/clima/policies/
strategies/2030_en
Evans, A., Romeo, M., Bahrehmand, A., Agenjo, J. & Blat,
J. (2014). 3D graphics on the web: A survey. Comput-
ers & Graphics, 41, 43–61. https://doi.org/
10.1016/j.cag.2014.02.002
Fraunhofer ISE (2020). Aktuelle Fakten zur Photovoltaik in
Deutschland, 24;71;48;8. https://www.ise.fraunhofer.
de/content/dam/ise/de/documents/publications/studies/
aktuelle-fakten-zur-photovoltaik-in-deutschland.pdf
Harbola, S. & Coors, V. (2018). Geo-Visualisation and Vis-
ual Analytics for Smart Cities: A Survey. ISPRS - In-
ternational Archives of the Photogrammetry, Remote
Sensing and Spatial Information Sciences, XLII-4/W11,
11–18. https://doi.org/10.5194/isprs-archives-XLII-4-
W11-11-2018
ICG. (2020). x3dom: Instant 3D the HTML way. Fraunhofer
Institute for Computer Graphics Research.
https://www.x3dom.org/legals/
Khronos Group. (2020). Khronos: Connecting Software to
Silicon. https://www.khronos.org/webgl/
KPMG International. (28. Oktober 2020).
Kapitalkostenstudie 2020. https://home.kpmg/de/de/
blogs/home/posts/2020/10/kapitalkostenstudie-
2020.html
Krämer, M. & Gutbell, R. (2015). A case study on 3D geo-
spatial applications in the web using state-of-the-art
WebGL frameworks. In J. Jia, F. Hamza-Lup & T.
Schreck (Hg.), Proceedings of the 20th International
Conference on 3D Web Technology - Web3D '15 (S.
189–197). ACM Press. https://doi.org/10.1145/
2775292.2775303
Mainzer, K [K.]. (2019). Analyse und Optimierung urbaner
Energiesysteme - Entwicklung und Anwendung eines
übertragbaren Modellierungswerkzeugs zur
nachhaltigen Systemgestaltung. Karlsruhe.
https://doi.org/10.5445/IR/1000092481
Mavromatidis, G., Orehounig, K., Bollinger, L. A.,
Hohmann, M., Marquant, J. F., Miglani, S., Morvaj, B.,
Murray, P., Waibel, C., Wang, D. & Carmeliet, J.
(2019). Ten questions concerning modeling of distrib-
uted multi-energy systems. Building and Environment,
165, 106372. https://doi.org/10.1016/ j.build-
env.2019.106372
Meskel, E. & Weber, P. (2017). Review of instruments and
tools used for energy and urban planning in Amster-
dam/Zaanstad, Berlin, Paris, Stockholm, Vienna, War-
saw and Zagreb: Instruments and tools under scrutiny,
13–15.
Nouvel, R., Zirak, M., Coors, V. & Eicker, U. (2017). The
influence of data quality on urban heating demand mod-
eling using 3D city models. Computers, Environment
and Urban Systems, 64, 68–80.
https://doi.org/10.1016/j.compenvurbsys.2016.12.005
OpenStreetMap contributors. (2020). Open Street Map.
https://www.openstreetmap.de/
Schoof, M., Resch, B. & Ludwig, D. (2013). A GIS-based
Concept for Solar Energetic Examination of New
Building Projects.
Schumacher, J. (2020). INSEL. https://www.insel.eu/de/
was-ist-insel.html
Stadt Wien. (2018). Solarpotenzial3D. https://www.
wien.gv.at/stadtentwicklung/stadtvermessung/geodate
n/viewer/solarpotenzial3d/
Statistisches Bundesamt. (28. Oktober 2020). Preise: Daten
zur Energiepreisentwicklung. https://www.destatis.de/
DE/Themen/Wirtschaft/Preise/Publikationen/Energiep
reise/energiepreisentwicklung-pdf-5619001.pdf
Thermal Energy System Specialists, LLC. (17. November
2020). TRNSYS Webstite. http://www.trnsys.com/
features/index.html
three.js. (2020). https://threejs.org/
U.S. Department of Energy’s Building Technologies Office.
(1996-2019). EnergyPlusTM. https://energyplus.net/
Weiler, V., Stave, J. & Eicker, U. (2019). Renewable En-
ergy Generation Scenarios Using 3D Urban Modeling
Tools—Methodology for Heat Pump and Co-Genera-
tion Systems with Case Study Application †. Energies,
12(3), 403. https://doi.org/10.3390/ en12030403
A Multi-Scale, Web-based Application for Strategic Assessment of PV Potentials in City Quarters
117
