
A Neural Network Modelling and Prediction of Students’ Progression in
Learning: A Hybrid Pedagogic Method
Ethan Lau, Kok Keong Chai, Gokop Longinus Goteng and Vindya Wijeratne
School of Electronic Engineering and Computer Science, Queen Mary University of London,
10 Godward Square, Mile End Rd., Mile End, London E1 4FZ, U.K.
Keywords:
Pedagogic Approach, Blended Learning, Statistical Evaluations, Neural Network.
Abstract:
The COVID-19 pandemic has changed dramatically the way how universities ensure the continuous and sus-
tainable way of educating students. This paper presents the neural network (NN) modelling and predicting
students’ progression in learning through a hybrid pedagogic method. The hybrid pedagogic approach is
based on the revised Bloom’s taxonomy in combination with the flipped classroom, asynchronous and cog-
nitive learning approach. To evaluate the effectiveness of the hybrid pedagogic approach and the students’
progression in learning, educational data is collected that comprises of labs and class test scores, as well as
students’ total engagement and attendance metrics for the programming module considered. Conventional
statistical evaluations are performed to evaluate students’ progression in learning. The NN is further modelled
with six input variables, two layers of hidden neurons, and one output layer. Levenberg-Marquardt algorithm
is employed as the back propagation training rule. The performance of neural network model is evaluated
through the error performance, regression and error histogram. The NN model has achieved a good prediction
accuracy along with limitations. Overall, the NN model presents how the hybrid pedagogic method in this
case has successfully quantified students’ progression in learning throughout the COVID-19 period.
1 INTRODUCTION
Over the past months, the daily-routine life for na-
tionals have been hugely affected by the coronavirus
COVID-19 crisis. Therefore, the worldwide edu-
cational sectors should focus on the long-term con-
tinuity of education deliveries to guarantee a re-
silient education for equitable and sustainable devel-
opment (United Nations, 2020). Consequently, many
universities around the world are shifted to virtual on-
line teaching, learning and assessments. However,
this requires collective efforts by leveraging the ped-
agogic approach to enhance the online learning plat-
forms while ensuring the vision and strategy of the
universities. Many pedagogic methods have been put
forward but the methodology to assess and predict
students’ progression of learning is extremely limited
at the present pandemic situations. The conventional
questionnaire and feedback surveys from students are
not sufficiently enough to evaluate and quantify stu-
dents’ overall learning progression and engagement.
For this reason, this paper presents the neural net-
work (NN) modelling and predicting students’ pro-
gression in learning through the hybrid pedagogic
method. We present how the computer software pro-
gramming module considered in this study have suc-
cessfully implemented the hybrid pedagogic method.
The hybrid pedagogic approach is based on the re-
vised Bloom’s taxonomy in combination with the
flipped classroom, asynchronous and cognitive learn-
ing, while maximising students’ learning experiences.
By effectively evaluating students’ engagement in the
online learning platform this will greatly help to as-
sess the effectiveness of the hybrid pedagogy ap-
proach. This is done by evaluating students learn-
ing behaviour through their level of engagements in
the module. The data information about students’ en-
gagement metrics are obtained through the the lecture
recording software. Apart from that, the assessments
such as the lab and the class test results are adopted
for statistical evaluations and the latter NN develop-
ment. This further presents an exploratory NN mod-
elling and analyses students’ progressing in learning
and serves as a dominant educational quality tool to
mitigate those disparities that hamper the education
quality.
The organisation of the paper is as follows: Sec-
tion 2 presents the reviews of pedagogic methods, the
84
Lau, E., Chai, K., Goteng, G. and Wijeratne, V.
A Neural Network Modelling and Prediction of Students’ Progression in Learning: A Hybrid Pedagogic Method.
DOI: 10.5220/0010405600840091
In Proceedings of the 13th International Conference on Computer Supported Education (CSEDU 2021) - Volume 1, pages 84-91
ISBN: 978-989-758-502-9
Copyright
c
2021 by SCITEPRESS – Science and Technology Publications, Lda. All rights reserved

NN and the summary, Section 3 presents the method-
ology of map the hybrid pedagogic approach into NN
modelling, Section 4 presents statistical evaluations,
NN configuration settings and the performance, Sec-
tion 5 concludes the findings.
2 OVERVIEW OF THE
PEDAGOGIC METHODS
The traditional pedagogic format includes the be-
haviourism, constructivism, social constructivism and
liberationism. Bloom’s taxonomy is one of the
most well-known hierarchical-based pedagogical tool
to complement the strategies of educational objec-
tives (Granello, 2001). Each of the hierarchy con-
tains a domain of intellectual behaviour that stratifies
teaching, learning and assessment activities. It has
been well used in software engineering and computer
science-specific learning domains (Fuller et al., 2007;
Britto and Usman, 2015; Peter et al., 2016) and also
has helped in improving the assessment methods in
the domain of science, technology, engineering and
mathematics (STEM).
Ever since the pandemic began, the pedagogy in
the educational field is changing rapidly, where face-
to-face delivery is no longer the best option to interact
with students. Therefore, there is a need to create a
balance of joint teaching elements in in-class and on-
line while meeting students’ learning outcomes. To-
gether with the evolvement of digital academics, uni-
versities are looking for the approach to ensure the
continuous engagement and active learning among
students. Several recent papers paid a huge empha-
sis on Bloom’s revised taxonomy to ensure adaptive
online-based learning module in responding to the
pandemic (Qadir and al-Furqaha, 2020; Sheth et al.,
2020). Therefore, to accommodate the needs of stu-
dents’ learning needs during and beyond COVID-19,
the revised Bloom’s taxonomy is proposed in this pa-
per that brings together the hybrid learning-based ap-
proach – flipped classroom, asynchronous and cogni-
tive learning.
The revised Bloom’s taxonomy is presented in
Figure 1 where the hybrid pedagogical approach is
implemented. This serves as a strategy to avoid just
having to deliver modules but being able to prepare
students to have conceptual understanding to solve
problems and represent situations (Joffrion, 2005).
The flipped classroom is a type of blended learning
where students at first are being introduced the con-
tent at off-campus (pre-classroom activities) and work
together with lecturers to solve the content during the
live lectures (virtual classroom activities). Existing
benefits of using flipped classroom have already been
established, where one of the example of case study
students with flipped classroom (N=24) outperformed
in exams compared with the traditional (N=19) (Pe-
terson, 2016).
Remembering
Understanding
Applying
Analysing
Evaluating
Creating
Flipped classroom
Cognitive &
Asynchronous
learning
Pre-classroom
activities
Virtual classroom
activities
Figure 1: The revised Bloom’s taxonomy.
In addition, the hybrid approach is part of the strat-
egy to activate students’ cognitive-based prior knowl-
edge. Activating prior cognitive knowledge brought
more beneficial effect on knowledge and compre-
hension understanding to enable students to learn
actively (Kostons and Werf, 2015), and thus facil-
itates the conceptual understanding of science and
engineering principles and increases students’ self-
regulated responsibility in participating the lecture.
Furthermore, the flipped classroom implemented with
cognitive-based learning could lead to increased aca-
demic performance (Foldnes, 2016).
Asynchronous learning is an another prevalent
pedagogical strategy where it is used in “Anytime,
Anywhere” basis that includes instructor-led online
face-to-face meetings and chats, recorded lectures,
and tutorials (Wu et al., 2008). Asynchronous learn-
ing method has been well received, where it cre-
ates a great potential for enhancing cognitive learn-
ing progress and the resultant academic performance
among students (Michalsky and Zion, 2007).
In summary, the hybrid pedagogical approach is
applied to improve the existing Bloom’s taxonomy in
responding to students’ learning needs. This is to en-
sure students students have more spaces for them to
elicit the conceptual information when watching the
recorded videos, and to further allow more space for
students’ talk time and understanding on the topic in
the virtual face-to-face meetings. Such mechanism
ensures more learning spaces for students and not
solely depending on the traditional lecturer-centred
rule.
2.1 Neural Network
With the expansion of the education system together
with the restriction in COVID-19, various pedagogy
methods are not being evaluated analytically that can
A Neural Network Modelling and Prediction of Students’ Progression in Learning: A Hybrid Pedagogic Method
85

actually be combined with machine learning tech-
niques for educational research purposes. Machine
learning techniques leverage the pedagogical methods
that detect at-risks students earlier and to further miti-
gate negative consequences from occurring (Macarini
et al., 2019). Additionally, machine learning tech-
niques improve the accuracy of prediction by collec-
tively classifying the low-engagement students, in-
tervening their learning behaviour and improve their
learning engagements (Hussain et al., 2018).
Therefore, this paper implements a neural net-
work (NN) model that is capable of machine learn-
ing by collecting students’ information and further
predicting students’ progression in learning based on
their learning engagements. NN is formed through a
collection of artificial neurons that resemble the con-
nection geometry of neurons in human brains in order
to execute a task with improved performance through
learning, training and continuous improvement (Van-
damme et al., 2007; Kardan et al., 2013). The most
common learning rule of NN is back-propagation
(BP), which is a supervised learning approach and can
be used for training the deep neural networks. BP ad-
justs the weights of neurons through the calculated er-
rors and enables the network to learn from the training
process.
Remarkably, NN approach has been receiving
wide attention for educational research purposes in
modelling modelling complex nonlinear functions. It
has been used to not only to accurately predict fi-
nal grades of students, but also to improve the better
understanding of the educational process and evalu-
ation (Kardan et al., 2013; Isljamovic and Suknovic,
2014; Okubo et al., 2017).
Overall, NN has the ability in performing the neu-
ral fitting and prediction, and the ability to classify
any data with arbitrary accuracy theoretically. This is
important to examine the significant factors that af-
fect the performance among students. The NN model
would serve as a framework and tool to predict the
future students’ academic performance, and to further
address those issues that hinder the success of student
learning and thus continually improving the pedagog-
ical approaches.
3 METHODOLOGY
This section presents the methodology of implement-
ing the hybrid pedagogic approach in the revised
Bloom’s taxonomy, acquiring educational data, statis-
tical testing for NN modelling, and the methodology
of evaluating the performance of modelled NN.
3.1 Overview of Module
The computer software programming module is con-
sidered in this study. The module aims to intro-
duce different software service platforms and how it
is used to enable heterogeneous systems to work to-
gether within a distributed cloud system. At the end
of this module, students will have acquired the knowl-
edge of the different types of software service plat-
forms available, design and implement client-server
or web-based applications. A total of 181 Year 3
undergraduate students are currently enrolled to the
module. Apart from the delivery of live and recorded
lectures (which will be explained in the next section)
as well as the tutorials, the module’s lab assessment is
based on four sessions of lab exercises (progressive-
based) covered by four lab sessions in 4
th
, 6
th
, 8
th
and 9
th
of the teaching weeks. Lab task difficulties
are increased when students progress themselves un-
til the final session of the labs. Students need to sub-
mit all the lab tasks through the online Moodle learn-
ing portal accordingly. After the completion of lab
exercises, students are then needed to take the class
test (Week 12
th
) that aims to evaluate students’ per-
formance throughout the module learning. All lab as-
sessments and class tests are performed online while
ensuring the important aspect of the UK Quality Code
for Higher Education in achieving the intended learn-
ing outcomes.
3.2 The Hybrid Pedagogic Approach
The revised Bloom’s taxonomy is proposed in this pa-
per which consists the hybrid pedagogical approach –
flipped classroom, asynchronous and cognitive learn-
ing. An example of asynchronous learning based
on anytime, anywhere basis is presented in Table 1,
where students are updated about the asynchronous
lecture time and information on the Moodle. This is to
avoid one way limited communication flow from the
existing Bloom’s taxonomy. It is important to note
that the hybrid strategy proposed in this paper does
not improve the Bloom’s taxonomy but takes students
to a higher cognitive level.
Microsoft Teams is the core lecturing and commu-
nication platform for both lectures and tutorials, apart
from the Moodle portal to enable students to access
the additional resources related. The module team
channel is created in Microsoft Teams to allow stu-
dents studying the computer software programming
module to post any questions related to their learn-
ings.
Flipped classroom, on the other hand, is imple-
mented as part of the blending learning approach that
CSEDU 2021 - 13th International Conference on Computer Supported Education
86

Table 1: Asynchronous learning timetable.
Session Week 1 Week 2 Week 4 Week 5
Thursday, 08:35 - 09:20 am Live Recorded Live Recorded
Thursday, 09:25 - 10:10 am Live Live Live Recorded
comes with pre-recorded video sessions. The tech-
nique allows pre-classroom activities where students
need to watch the pre-recorded video either on/off
campus, and then continuing the learning by attend-
ing the live lectures to solve the problems. This is
done via virtual face-to-face classroom activities.
To improve students’ learning and comprehen-
sion especially in dealing with the pandemic, all the
tutorials, online quizzes and lab tasks are carefully
constructed based on students’ previous knowledge
in fundamental programming concepts (e.g. Intro-
ductory Java Programming). Such serves as a pre-
requisite for students to undertake the computer soft-
ware programming module. Together with recorded-
video watching, this serves as a pre-cognitive domain
to activate students’ prior knowledge, and to further
apply the cognitive knowledge that facilitates the con-
ceptual understanding of the module during the live
lecture session. This intents to increase students’ self-
regulated responsibility in participating the lecture,
and thereby improving the interactions, engagements
and their resultant learning behaviour in the module.
3.3 Data Collection
No questionnaire or feedback surveys are conducted
in this case. Instead, the evaluations are performed
using the data analytics and are collected from the
lecture recording software, lab assessments ,and the
class test. Additionally, the assessments are per-
formed solely to the Year 3 cohort undertaking the
computer software programming module. In terms of
students’ behaviour and progression in learning, the
dataset information is available and extracted using
the Echo360 lecture recoding software. The Echo360
software provides the course analytics metrics (e.g.
engagement, slide views, video views, polling re-
sponses, attendances) that rolls up the data informa-
tion (Echo360, 2020) for each student enrolled in the
course. In this paper the metrics Total engagement
and Attendance are extracted as the metrics are the
important factors that influence students’ learning and
progression behaviour, and the resultant performance.
The Total Engagement in this case is the cumulative
total of data points such as Video Views, Q&A En-
tries, Polling Responses (polling questions that were
answered correctly), and Note Events (total number
of distinctive notes student have taken). Attendance
is where students entered the online classroom during
the class time.
3.4 Statistical Testing
Prior to the NN modelling, it is necessary to exam-
ine the relationship between the students’ progres-
sion and learning behaviour that further indicate the
level of engagement in the module, lab assessments
and their class test scores. Statistical testing is per-
formed initially in this study using multiple regres-
sion analysis. Multiple regression analysis is used to
evaluate whether a dependent variable could be pre-
dicted based on independent variables. The signifi-
cant difference is set at α = 0.05. Pearson correla-
tion coefficients are calculated to measure the linear
relationships of four lab assessment scores, the stu-
dents’ engagement metrics (Total engagement and At-
tendance), and the resultant class test score. Those
correlated variables are used further as input neurons
for the NN modelling.
3.5 Neural Network Modelling
The NN in this case is used for neural prediction
of students’ progression in learning and engagement
through input observations of lab assessments, the
metrics of students’ engagement and the class test
scores. Such scheme is performed based on the su-
pervised machine learning. The NN in this paper is
modelled following the earlier research works (Zhang
et al., 2003; Vandamme et al., 2007; Rashid and Ah-
mad, 2016; Lau et al., 2019). This paper does not
to compare the effectiveness of NN performance with
other machine learning techniques.
By conventional definition, the NN mathematical
model function can simply be formulated as:
˜
Y = f (
˜
X,
˜
W), (1)
where
˜
Y and
˜
X are the output and input vectors.
˜
W
is a vector of weight parameters representing the con-
nections within the NN.
The input layer gathers data with feature sets and
the input values are fed to the hidden layer. The output
values of jth neuron y
j
of vector
˜
Y are computed by
means of the weighted sum of input elements x and w,
where w is updated recursively.
y
j
= θ
N
i
∑
i=1
w
i j
x
i
!
. (2)
The θ is the activation function (transfer function),
N
i
is the total number of ith connection lines to the jth
neuron and x
i
is the output value from the previous
layer of ith neuron. The hyperbolic tangent function
is used as the activation function (θ) to transfer the
value of weighted sum of inputs to the output layer.
A Neural Network Modelling and Prediction of Students’ Progression in Learning: A Hybrid Pedagogic Method
87

The resultant activated node for the next input layer is
therefore:
x
j
= θ(y
j
). (3)
For training, the BP-based supervised learning ap-
proach is applied where both inputs and outputs pa-
rameters are supplied to the NN model. BP is used
as the learning rule for the NN model that adjusts the
weights of neurons w
i j
through the errors computed
recursively that further produces desired outputs. The
error function (E) is calculated as the sum of square
difference difference between the target values and
the desired outputs:
E =
1
2
N
j
∑
j
(y
j
−t
j
)
2
, (4)
where t
j
is the target value for neuron i in the output
layer and N
j
is the total number of output neurons.
The BP-based Levenberg-Marquardt optimisation
algorithm is applied in the NN training. It speeds up
the convergence to an optimal solution by effectively
solving the training algorithms for non-linear prob-
lems (Yu and Wilamowski, 2011; Wilson and Man-
tooth, 2013). The Levenberg-Marquardt is a hybrid-
based training method using the steepest descent (gra-
dient descent) and Gauss-Newton method. The al-
gorithm introduces another approach of approxima-
tion to Hessian Matrix, which is similar to the Gauss-
Netwon method (Yu and Wilamowski, 2011; Math-
Works, 2019):
w
i j+1
= w
i j
− [J
0
J + ζI]
−
1J
0
ω
k
, (5)
where J denotes the Jacobian matrix, ω
k
is the error
in the network (MathWorks, 2019), w
i j
is the current
weight and w
i j
is the updated weight, ζ is the damping
factor.
When ζ is small, the Levenberg-Marquardt train-
ing algorithm in Eq. 5 applies the Gauss-Newton
method, and in contrast, becomes gradient descent al-
gorithm when ζ is large. Therefore, ζ is adjusted at
every iteration in order to guide the optimisation pro-
cess and switched between those two algorithms as
the training model.
The number of neuron in the output layer is the
resultant decision prediction of the problem (
¨
Ozc¸elik
and Hardalac¸, 2011). The output layer consists collec-
tions of vector
˜
Y, which is the collection of predicted
class test.
3.6 NN Performance Evaluation
Criteria
In order to evaluate the NN performance, this paper
computes the Mean Square Error (MSE), regression
analysis, and error histogram that mitigates the aris-
ing of over-fitting issues to ensure the appropriateness
of NN performance. A well-trained NN model should
have low MSE value, which means that the predicted
outputs converge closely to the target outputs (t
i j
)
(provided that no over-fitting issues occurred). MSE
is calculated as:
MSE =
1
N
i
N
j
N
j
∑
j=1
N
i
∑
i=1
(y
i j
−t
i j
)
2
. (6)
As mentioned, over-fitting of the trained network
is possible if obtained MSE value is low. This fur-
ther indicates that NN only works well in the train-
ing stage, but not in validation and testing phase. To
mitigate this a regression is performed along with
computed R-value which demonstrates the goodness
of fitting between the predicted and the desired out-
puts. The plot is useful in examining the fitting perfor-
mance. If poor fitting (low R-value) is obtained, fur-
ther trainings are required with modification of hidden
layers and neurons.
Another way of measuring NN performance is to
tabulate the error histogram. The error histogram
demonstrates how the errors are distributed with most
errors are occurred near zero. The error is simply
the difference between the targeted outputs t
i j
and the
predicted outputs y
i j
.
4 RESULTS
This section presents the findings, the configuration of
NN, the prediction and the verification of NN perfor-
mance for 181 Year-3 undergraduate students. This is
based on the obtained datasets of lab assessments and
class test scores, as well as the information about stu-
dents’ engagement and the attendance metric from the
Echo360 software. In summary the average class test
score is 78.19±10.10 compared with 81.02±11.18
for the previous academic year, which stays fairly
consistent when the teaching model was very differ-
ent.
4.1 Statistical Evaluations
Multiple regression analysis is used to give a bet-
ter indication whether the Class Test (the dependent
variable) could be predicted based on the indepen-
dent variables – Lab scores, students’ Total Engage-
ment and the Attendance metrics. In this paper, we
are focusing on demonstrating the three main outputs
for the multiple regression analysis as such verifies
the need for latter NN model simulation and analysis.
CSEDU 2021 - 13th International Conference on Computer Supported Education
88

The outputs are the regression summary, Analysis of
Variance (ANOVA) and statistical significance analy-
sis of the independent variables.
Table 2 provides the R, R
2
, adjusted R
2
and the
standard error of the estimates. The results shows
a marginally good quality of the prediction R value
(the class test) of 0.621. Additionally, the adjusted
R
2
value of 0.569 indicates that independent variables
contribute to 56.9% of the variability of the dependent
variable.
Table 2: Regression model summary.
Multiple R 0.621
R
2
0.599
Adjusted R
2
0.569
Standard Error 7.132
The ANOVA tests the goodness of fits for the over-
all multiple regression analysis. The result is shown
in Table 3. As (α < 0.05), the model is a good fit of
the data for the NN model.
Table 3: ANOVA result.
Source Sum of square d.f. Mean square F-cal α
Regression 608.67 6 101.44 1.563 0.002
Residual 11422.4 176 64.90
Total 12030.87 182
The statistical significance for each of the inde-
pendent variables is shown Table 4. As α < 0.05, all
the independent variables are statistically significant
to the dependent variable (the class test).
Table 4: Statistical significance of the independent vari-
ables.
Model Coefficients Standard error t Stat α
(Intercept) 87.83 6.390 13.745 0.001
Lab 1 -0.243 0.075 -3.24 0.000
Lab 2 -0.198 0.052 -3.808 0.000
Lab 3 -0.423 0.032 13.218 0.001
Lab 4 -0.165 0.059 -2.796 0.004
Total Engagement -0.118 0.032 -3.667 0.000
Attendance 13.116 1.344 9.756 0.000
Pearson correlation coefficients are calculated to
examine the degree of closest relationship among the
four Lab scores, the students’ engagement metrics
(Total engagement and Attendance), and the resultant
class test score. The correlation coefficients between
lab scores, total engagement,attendance and the class
test score are shown in Table 5, with ascending order:
Total Engagement, Lab 1, Lab 2, Lab 3, Lab 4 and At-
tendance. These correlated variables are used further
as input neurons for the NN modelling.
For the Person Correlation test, surprisingly, it can
be seen that the correlation coefficient value increases
as students progress themselves from Lab 1 to Lab
4. Apart from that, the attendance metric is with the
highest relationship with the class test score. This
shows that attending the live and recorded lecture, as
well as completing the lab assessments are important
so as to score better in the class test. This is in line
with the explanation where students’ are able to solve
programming questions and perform well with cogni-
tive levels as high as application and analysis in online
learning activities (Othman and Zain, 2015).
4.2 NN Configuration Settings
The NN modelling and evaluations are performed us-
ing MathWorks MATLAB software. The input layer
consists of six variables containing all the four lab as-
sessment scores and the metrics include the total en-
gagement and and the attendance. The modelled NN
has two hidden layers, where each hidden layer con-
sists of 30 neurons as such configuration provides the
best outcome throughout several simulations with dif-
ferent hidden layer and neuron settings. Each hidden
layer with 30 neurons is fed into a single output neu-
ron that carries the decision of the variable, which is
the class test prediction.
The activation function of hyperbolic tangent is
used. Decisions must be taken to divide the dataset
into training, validation and test ratio. Data samples
of 181 students are randomly mixed and 0.7 of the
mixed samples are used for training, 0.15 used for val-
idation and the remaining 0.15 used for the testing.
During the training and learning phase,
Levenberg-Marquardt algorithm in Eq. 5 is used
to determine the optimal weights that are fed to
the next input layer. The damping factor ζ is set
to 0.001. The training epoch is set to 2,000. The
NN training performs continuously and terminates
when the validation error failed to decrease for six
iterations during the validation process. Typically,
the validation protects over-training of NN.
4.3 NN Simulation Results
After the NN training, the NN performance with
MSE ≈ 58.74 or 6.9% (<10%) indicates the suffi-
ciently good performance of NN in completing train-
ing training and validation runs.
Regression plots of NN performance are shown
in Figure 2. For a good data fitting, the data should
have the predicted outputs y
i j
lying closely with tar-
get outputs t
i j
. In this case, the resultant regression
plots achieve marginally good fits with an overall R-
value of 0.595.
The error histogram evaluates the error distribu-
tions based on the resultant NN predictions. The dis-
tribution of errors are shown in Figure 3. Most er-
A Neural Network Modelling and Prediction of Students’ Progression in Learning: A Hybrid Pedagogic Method
89
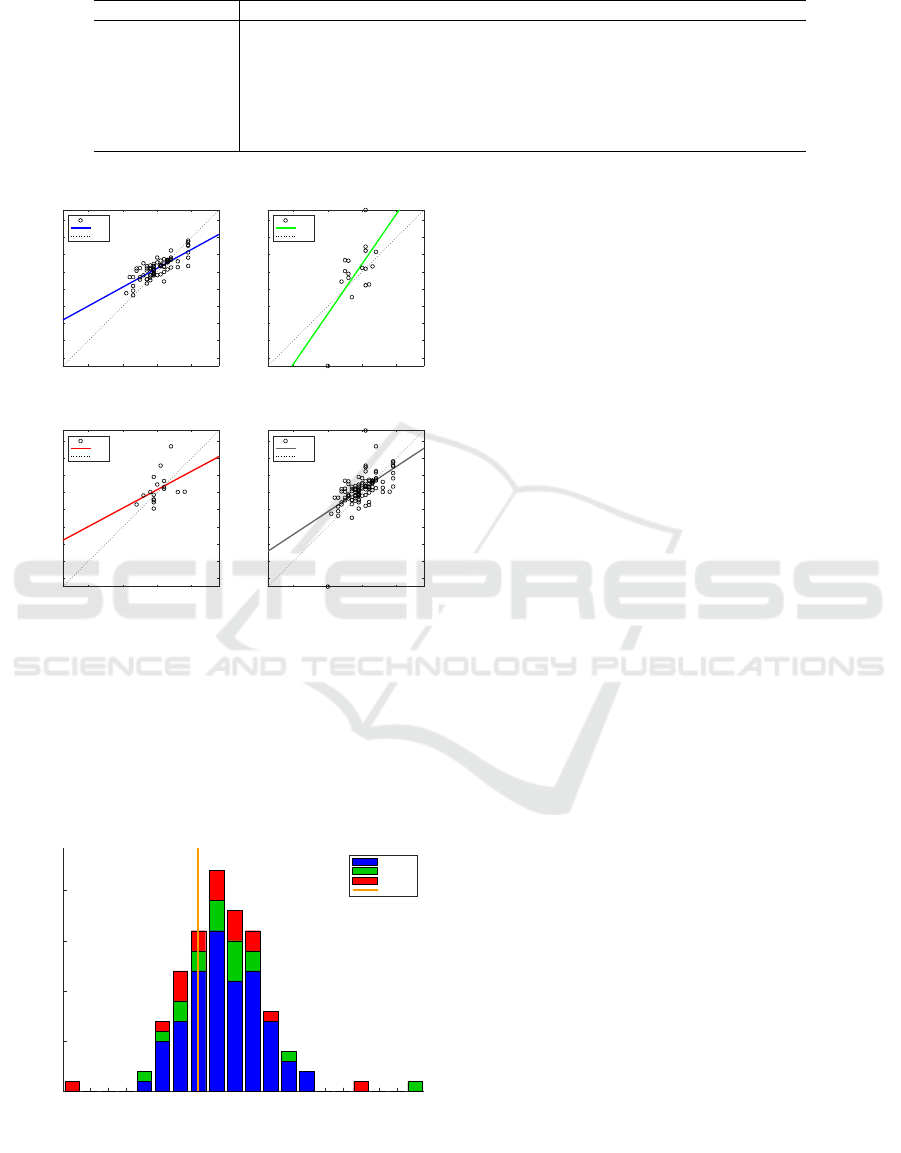
Table 5: Correlation coefficient of four lab assessments, total engagement and attendance, and the class test score.
Lab 1 Lab 2 Lab 3 Lab 4 Total Engagement Attendance Class test
Lab 1 1
Lab 2 0.84 1
Lab 3 0.70 0.70 1
Lab 4 0.85 0.84 0.80 1
Total Engagement 0.31 0.30 0.28 0.31 1
Attendance 0.34 0.31 0.28 0.32 0.92 1
Class Test 0.36 0.37 0.40 0.41 0.36 0.42 1
40 60 80 100
Target
30
40
50
60
70
80
90
100
110
Output ~= 0.55*Target + 38
Training: R=0.79161
Data
Fit
Y = T
40 60 80 100
Target
30
40
50
60
70
80
90
100
110
Output ~= 1.5*Target + -32
Validation: R=0.61323
Data
Fit
Y = T
40 60 80 100
Target
30
40
50
60
70
80
90
100
110
Output ~= 0.54*Target + 39
Test: R=0.41363
Data
Fit
Y = T
40 60 80 100
Target
30
40
50
60
70
80
90
100
110
Output ~= 0.66*Target + 29
All: R=0.59507
Data
Fit
Y = T
Figure 2: Regression plot for NN model: Top left: Train-
ing data; Bottom left: Test data; Top right: validation data;
Bottom right; resultant regressions.
rors occurred near zeroth point (horizontal axis), and
errors are gradually decreasing when moving away
from zeroth point. This proves that NN performs the
prediction successfully with acceptable error distribu-
tions as shown in Figure 3.
0
5
10
15
20
Instances
Error Histogram with 20 Bins
-31.93
-27.35
-22.77
-18.18
-13.6
-9.023
-4.441
0.1397
4.721
9.302
13.88
18.46
23.05
27.63
32.21
36.79
41.37
45.95
50.53
55.11
Errors = Targets - Outputs
Training
Validation
Test
Zero Error
Figure 3: Error histogram plot.
5 CONCLUSIONS
In this paper NN is used to model and predict the
students’ progressing in learning using the available
dataset about their lab assessment scores, class test
and the information about their engagements and at-
tendance metrics using the lecture recording software
analytics. The core purpose is to evaluate the effec-
tiveness of students’ progression in learning through
the revised Bloom’s taxonomy in combination with
the hybrid pedagogic approach – flipped classroom,
asynchronous and cognitive learning throughout the
COVID-19 period.
The multiple regression result showed the statisti-
cally significance of all the independent variables to
the dependent variable. Such evaluations verified the
appropriateness of variables used for the latter NN
modelling. The Person Correlation test also shows
the order of importance on how the progression of
students from Lab 1 to Lab 4 plus attending the live
and recorded video lectures will affect their class test
scores.
Overall, the good NN performance makes NN
such a useful tool for education evaluation purposes.
However, some present limitation of this study are the
low sample size of the dataset obtained. In the light
of the results, it is still strongly believed that educa-
tion modelling settings using NN provides an instru-
mental contribution in evaluating students’ academic
performance. The future NN model may include other
attributes such as the lecturers’ role, some other class-
room activities such as quizzes, course feedbacks and
formative assessments. We strongly believe that the
proposed model is highly generalisable in fitting into
other courses and thus leveraging the ‘Smart’ educa-
tional learning solutions.
REFERENCES
Britto, R. and Usman, M. (2015). Bloom’s taxonomy in
software engineering education: A systematic map-
ping study. In 2015 IEEE Frontiers in Education Con-
ference (FIE), pages 1–8.
CSEDU 2021 - 13th International Conference on Computer Supported Education
90

Echo360 (2020). Echo360- definitions of course analytics
metrics. https://learn.echo360.com/hc/en-us/articles/
360035037312. Accessed 25 11 2020.
Foldnes, N. (2016). The flipped classroom and cooperative
learning: Evidence from a randomised experiment.
Active Learning in Higher Education, 17:39–49.
Fuller, U., Johnson, C., Ahoniemi, T., Cukierman, D.,
Hern
´
an-Losada, I., Jackova, J., Lahtinen, E., Lewis,
T., Thompson, D., Riedesel, C., and Thompson, E.
(2007). Developing a computer science-specific learn-
ing taxonomy. ACM SIGCSE Bulletin, 39(4):152–170.
Granello, D. (2001). Promoting cognitive complexity in
graduate written work: Using bloom’s taxonomy as a
pedagogical tool to improve literature reviews. Coun-
selor Education and Supervision, 40(4):292–307.
Hussain, M., Zhu, W., Zhang, W., and Abidi, S. (2018). Stu-
dent engagement predictions in an e-learning system
andtheir impact on student course assessment scores.
Computational Intelligence and Neuroscience, 6:1–
21.
Isljamovic, S. and Suknovic, M. (2014). Predicting stu-
dents’ academic performance using artificial neural
network: a case study from faculty of organizational
sciences. In ICEMST 2014: International Conference
on Education in Mathematics, Science & Technology,
pages 68–72. ISRES Publishing.
Joffrion, H. (2005). Conceptual and procedural understand-
ing of algebra concepts in the middle grades. Master’s
thesis, Office of Graduate Studies of Texas A&M Uni-
versity.
Kardan, A. A., H, S., Ghidary, S., and Sani, M. (2013).
Prediction of student course selection in online higher
education institutes using neural network. Computers
& Education, 65:1–11.
Kostons, D. and Werf, G. (2015). The effects of activat-
ing prior topic and metacognitive knowledge on text
comprehension scores. British Journal of Educational
Psychology, 85(3):264–275.
Lau, E., Sun, L., and Yang, Q. (2019). Modelling, pre-
diction and classification of student academic perfor-
mance using artificial neural networks. SN Applied
Sciences, 1(982):1–10.
Macarini, L., Cechinel, C., Machado, M., Ramos, V.,
and Munoz, R. (2019). Predicting students success
in blended learning—evaluating different interactions
inside learning management systems. Applied Sci-
ences, 9:1–23.
MathWorks (2019). trainlm - Levernberg-Marquardt back-
propagation. http://uk.mathworks.com/help/nnet/ref/
trainlm.html. Accessed 17 6 2019.
Michalsky, T. and Zion, M. (2007). Developing students’
metacognitive awareness in asynchronous learning
networks in comparison to face-to-face discussion
groups. Journal of Educational Computing Research,
36(4):395–424.
Okubo, F., Yamashita, T., Shimada, A., and Ogata, H.
(2017). A neural network approach for students’ per-
formance prediction. In LAK17 - The Seventh Interna-
tional Learning Analytics & Knowledge Conference,
pages 598–599. Association for Computing Machin-
ery (ACM).
Othman, M. and Zain, N. (2015). Online collaboration
for programming: Assessing students’ cognitive abil-
ities. Turkish Online Journal of Distance Education-
TOJDE, 16(4):84–97.
¨
Ozc¸elik, S. and Hardalac¸, N. (2011). The statistical mea-
surements and neural network analysis of the effect
of musical education to musical hearing and sensing.
Expert Systems with Applications, 38:9517–9521.
Peter, D., Leth, T., and Bent, T. (2016). Assessing problem-
based learning in a software engineering curriculum
using bloom’s taxonomy and the ieee software engi-
neering body of knowledge. ACM Transactions on
Computing Education, 16(3):1–41.
Peterson, D. (2016). The flipped classroom improves stu-
dent achievement and course satisfaction in a statistics
course: A quasi-experimental study. Teaching of Psy-
chology, 43:10–15.
Qadir, J. and al-Furqaha, A. (2020). A student primer on
how to thrive in engineering education during and be-
yond covid-19. Education Sciences, 10(9):236–258.
Rashid, T. and Ahmad, H. (2016). Using neural network
with particle swarm optimization. Computing Appli-
cation Engineering Education, 24:629–638.
Sheth, S., Ganesh, A., Nagendra, S., Kumar, K., Tejdeepika,
R., Likhitha, C., Murthy, P., and Chand, P. (2020).
Development of a mobile responsive online learn-
ing module on psychosocial and mental health issues
related to covid 19. Asian Journal of Psychiatry,
54:236–258.
United Nations (2020). Policy brief: Education during
covid-19 and beyond - august 2020. Technical report,
United Nations.
Vandamme, J., Meskens, N., and Superby, J. (2007). Pre-
dicting academic performance by data mining meth-
ods. Education economics, 15(4):405–419.
Wilson, P. and Mantooth, H. (2013). Model-based engi-
neering for complex electronic systems. Newnes.
Wu, D., Bieber, M., and Hiltz, S. (2008). Engaging students
with constructivist participatory examinations in asyn-
chronous learning networks. Journal of Information
Systems Education, 19(3):321–330.
Yu, H. and Wilamowski, B. (2011). Levernberg Mar-
quardt training industrial electronic handbook, intel-
ligent systems, volume 5. CRC Press, 2 edition.
Zhang, Q., Kuldip, C., and Devabhaktuni, V. (2003). Ar-
tificial neural network for rf and microwave design –
from theory to practice. IEEE Transactions on Mi-
crowave Theory and Techniques, 51(4):1339–1350.
A Neural Network Modelling and Prediction of Students’ Progression in Learning: A Hybrid Pedagogic Method
91
