
Air and Water Quality Improvement during COVID-19 Lockdown
Pedro Silva, Mariana Ávila and Márcia Gonçalves
Earth Observation Laboratory, Atlantic International Research (AIR) Centre, TERINOV- Terra Chã, Angra do Heroísmo,
Portugal
Keywords: Earth Observation, Remote Sensing, Copernicus, Sentinel-3A, Sentinel-3B, Sentinel-5P, NO
2
, PM2.5, PM10,
TSM.
Abstract: COVID-19 pandemic forced many countries to adopt lockdown measures, temporarily closing factories,
diminish maritime traffic and reducing the mobility of people in the cities. Analysis from the Tropospheric
Monitoring Instrument (TROPOMI) and Ocean and Land Colour Instrument (OLCI) on board Europe’s
Sentinel-5P, 3A/B respectively, for the first wave of the COVID-19, have shown a substantial improvement
in air and water quality. More specifically, since COVID-19 lockdown until the end April, Lisbon and Porto
were at their lowest PM10 levels of about 20% and a drop of 33% in 2 years, while Madrid had a significant
drop since lockdown with vales significantly below 2018 levels but still close to 2019 levels. In terms of NO
2
levels, Lisbon had an historical minimum of the last 2 years, dropping more than 40% during most of April
2020. Finally, Madrid had 2-year lowest level of more than 30% since lockdown. Concerning the water quality
in the Portuguese coastal waters, it was verified an increase in water transparency since confinement started
until May, accordingly to the Total Suspended Matter (TSM) indicator. From February to March, March to
April and April to May there was a reduction in TSM levels of 17%, 37% and 53% respectively.
1 INTRODUCTION
The novel coronavirus disease, COVID-19, became a
pandemic in 11
th
March 2020. This virus was firstly
identified in the city of Wuhan, China, in December
2019 and causes acute respiratory problems. In order
to protect the population from this pandemic, many
countries adopted lockdown measures, leading
companies to adapt the functions of their workers in
teleworking or lay-off mode. As a consequence, there
was a drastic reduction in the air traffic, motor traffic,
and industrial activity. All of these activities have an
impact in the air and water quality. According to the
World Health Organization, air pollution kills an
estimated seven million people worldwide every year
and that 9 out of 10 people breathe air containing high
levels of pollutants (World Health Organization,
2020). The urban centres of large cities are
characterized by a high population density, high
motor vehicle traffic, and intense industrial activity,
so they are naturally areas with high levels of air and
water pollution. Quantifying the status of pollution
during the lockdown period is an important task for
researchers to understand the effect of the COVID-19
spread on the environment in the short- and long-
term.
The most well-known pollutants from the troposphere
include ozone, carbon monoxide, nitrogen dioxide
and sulfur dioxide. Specifically, nitrogen dioxide
(NO
2
) is generated by vehicles, heavy industry and
power plants. The EU Ambient Air Quality
Directives limits the concentration of 200 μg/m
3
(not
to be exceeded more than 18 hours per year) and
annual average below 40 μg/m
3
. The main effects of
breathing NO2 relates to the increase of probability
of respiratory problems as in high doses it could
inflame the lining of the lungs and reduce immunity
to lung infections, causing problems like coughing,
colds and bronchitis.
Concerning aerosols, the levels of particulate
matter aerosols < 10μM (PM10) have a significant
impact in the air quality. These particulate matter
aerosols are microscopic particles of solid or liquid
matter suspended in the air and are measured in g/m
3
.
The main sources of these aerosols include i) human
origin such as industrial processes and product use,
agriculture, commercial, residential and households;
ii) natural our semi-natural sources such as desert
dust, biomass burning and sea salts. The EU Ambient
Air Quality Directives limits the daily average (with
no more than 35 days per year) below 50 μg/m
3
and
annual average below 40 μg/m
3
. PM10 affects
Silva, P., Ávila, M. and Gonçalves, M.
Air and Water Quality Improvement during COVID-19 Lockdown.
DOI: 10.5220/0010397201090115
In Proceedings of the 7th International Conference on Geographical Information Systems Theory, Applications and Management (GISTAM 2021), pages 109-115
ISBN: 978-989-758-503-6
Copyright
c
2021 by SCITEPRESS – Science and Technology Publications, Lda. All rights reserved
109

cardiopulmonary and respiratory health, the immune
system and in last instance can cause lung cancer.
Recent studies found evidence of SARS-Cov-2 RNA
on PM10 air samples and other studies are pointing
towards a relation between PM10 and increased
mortality rate. The reduction in the air traffic, motor
traffic, vessel traffic and industrial activity naturally
has a positive impact on the level of the pollutants
previously referred in the troposphere. This was
confirmed on the 2
nd
March 2020 by NASA and ESA,
that monitored the levels of NO
2
in China, from 1
st
January until 25
th
February and detected significant
decreases in these levels. According to the Ministry
of Ecology and Environment, China, the air quality
went up 11% in the category ‘good’ in as many as 337
cities (Henriques, 2020)
As already mentioned, maritime traffic also had a
sharp decrease during the lockdown, contributing to
an improvement in the water quality in the oceans.
Ocean health has a key role in the human life, as it
produces half of the world’s oxygen, absorbs 50 times
more carbon dioxide than the atmosphere, regulates
the climate, provides food and many other human
demands.
One of the indicators of water quality is the Total
Suspended Matter (TSM) levels, measured in mg/L,
which indicate the amount of suspended particles in
water bodies. Thus, it can be considered a parameter
to evaluate the turbidity of water and its health. Some
of these particles are present naturally in river and sea
waters, such as plankton, fine plant debris and
minerals, while others stem from human activity
(organic and inorganic matter). As TSM levels
increase, the appearance of the water becomes
cloudier as light penetration decreases which has a
negative impact on river and sea biology and can
affect photosynthesis with important effects on
biogeochemistry and life itself. High TSM levels can
also clog fish gills, either killing them or reducing
their growth rate. During the lockdown, it was
verified that the surface water quality of the
Vembanad Lake in India, had major improvements in
the Suspended Particulate Matter (SPM) (Yunus et
al., 2020).
With a visible trend towards improving
environmental qualities during the COVID-19
pandemic shown by several research groups, the
Earth Observation laboratory (EO lab) from Atlantic
International Research Centre (AIR Centre) was also
interested in monitoring the environmental impacts
during lockdown by monitoring air and water quality
in Portugal (Lisbon and Porto) and Spain (Madrid)
between the months of March and May 2020
corresponding to the first wave of the pandemic. The
results were produced through the use of Copernicus
data and services.
2 COPERNICUS IN SUPPORT OF
AIR AND WATER QUALITY
MONITORING
Copernicus is the European Union's Earth
Observation Programme, managed by the European
Comission. It is implemented in partnership with the
Member States, the European Space Agency (ESA),
the European Organisation for the Exploitation of
Meteorological Satellites (EUMETSAT), the
European Centre for Medium-Range Weather
Forecasts (ECMWF), EU Agencies and Mercator
Océan. With its Sentinels Constellation,
Copernicus offer information services in six
thematic lines: Atmosphere, Marine, Land, Climate
Change, Security and Emergency. For air quality,
Sentinel-5P and its instrument on board,
TROPOspheric Monitoring Instrument (TROPOMI)
offer quality data about key atmospheric species.
The Copernicus Atmosphere Monitoring Service
(CAMS) delivers Regional and Global Products
based on data from Sentinel-5P related to air
pollution and health, solar energy, greenhouse gases
and climate forcing.
Sentinel-3A and 3B have on board the Ocean
and Land Colour Instrument (OLCI), a visible
imaging push-broom radiometer with 21 spectral
bands from 400 to 1200 nm offer a large spectrum
of type of data, related to ocean, atmosphere,
and land. Some products range from water
surface directional reflectance, algal pigment
concentration, total suspended matter concentration,
among others.
3 RESULTS AND DISCUSSION
3.1 Air Quality
Figure 1 depicts the timeline of NO
2
emissions during
the COVID-19 outbreak in Portugal and Spain,
images from European satellite Copernicus Sentinel-
5P using TROPOMI (Tropospheric Monitoring
Instrument). The images show a drastic reduction in
NO
2
contamination levels due to reduced industrial
activity, which helps mitigate the impact of the
COVID-19 outbreak.
GISTAM 2021 - 7th International Conference on Geographical Information Systems Theory, Applications and Management
110
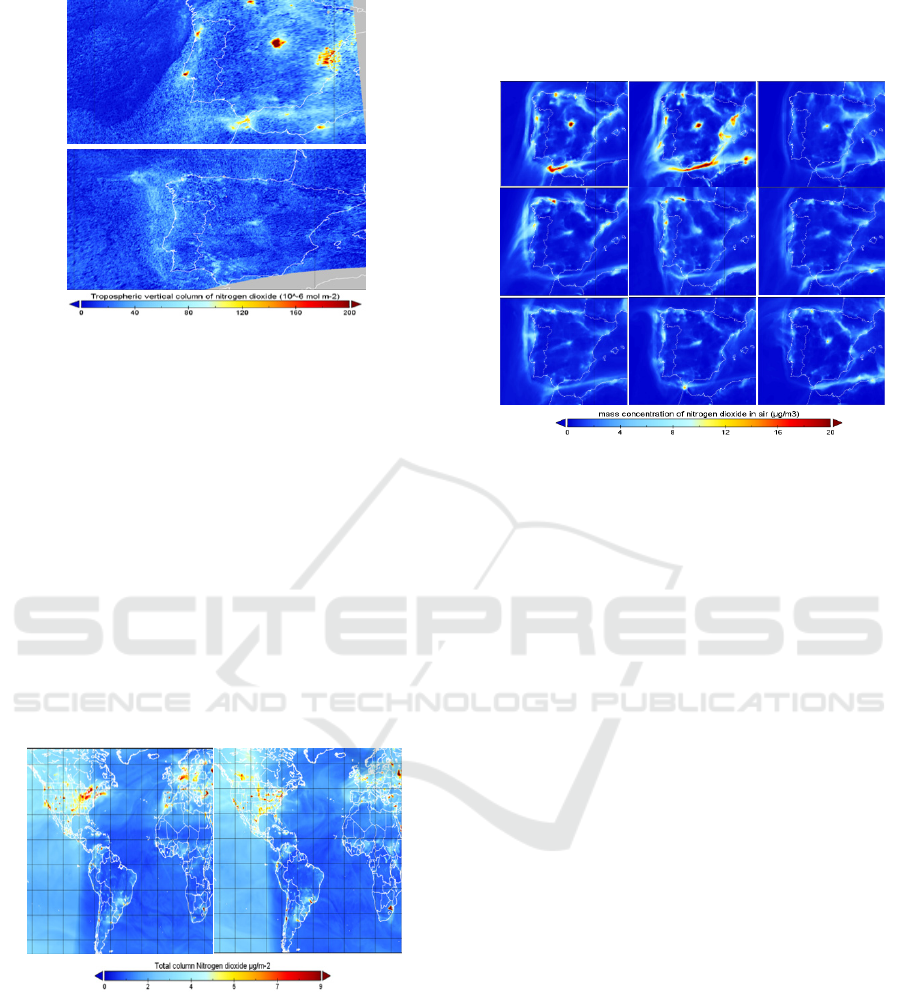
Figure 1: Tropospheric vertical column of nitrogen dioxide
(NO
2
) in the Iberian Peninsula in: a) 10
th
March 2020 and
b) 28
th
March 2020.
A timeline of NO
2
emissions in detail for Portugal
and Spain is presented in Figure 2, based on Regional
Products from CAMS service, and generated for 13h
UTC for several days, before and after the COVID
outbreak in Portugal. The difference from this data to
the data in Figure 1 is that the CAMS service digests
hourly values into a model, in this case the Ensemble
median, at the surface level, while data directly from
TROPOMI is representative of the total air column.
At the surface level and at a regional scale, NO
2
levels
are expressed in μg/m
2
. Results show a significant
reduction in NO
2
contamination levels due to reduced
industrial and other anthropogenic activity, both in
Portugal and Spain.
Figure 2: a) to b) – Total column Nitrogen Dioxide in air
for 10-03-2020 and 31-03-2020, respectively, in Atlantic
Regions.
Also, a less detailed analysis of NO
2
levels for 10
th
March and 31
st
March for the Atlantic Region was
carried out and is presented in Figure 3. This analysis
was generated through CAMS’s Global Products, so
the units are expressed in μg/m
2
. More specifically, it
is visible maritime traffic passing in the Strait of
Gibraltar, which is a sign that maritime commercial
activities continued to operate. Also, is possible to
observe a reduction in Europe, the same is true to the
USA but to a much less extent.
Figure 3: a) to b) – Mass concentration of Nitrogen Dioxide
in air for 10-03-2020, 11-03-2020 (before COVID outbreak
in Portugal); c) to i) 16, 18,20, 22,24,28-03-2020 and 1-4-
2020 respectively (after COVID-19 outbreak).
In Figure 4, are presented yearly NO
2
emissions
for Portugal and Spain, Lisbon, Porto and Madrid
generated using a 7-day average for daily values
determined at surface level and at 22h UTC, also
using CAMS service. The approach consisted in
verifying the regional NO
2
emission reduction for
Portugal and Spain and, also, in analysing the trends
for major cities within this territory. As expected, the
NO
2
emissions for the whole region peak for lower
values, however the curves behaviour dampens local
anomalies that may be observed in specific urban
areas, such as Porto city, as detailed below. In
Portugal and Spain territory, in 2020, there is a
reduction of approximately 26% for April 30
comparing with 2018 and 2019 and scaling for values
above 40% in the first week of April.
At a local scale, on April 30 the NO
2
emissions
are at their historical minimum since 2018 in Lisbon
(reduction of approximately 4,8% for 2019 and 2018
and more than 40% in the first weeks of April) and
Madrid (30,2% for 2019 and 45,5% for 2018).
However, in Porto there is a significant drop in NO
2
emissions, but the current level is still above 2019 and
2018, which might be explained due to several factors
such as a different rainy season. Similarly, as for the
concentration of PM10, the concentrations of NO
2
in
the air are lower since the lockdown due to COVID-
19 in March for the three cities (20% for Lisbon,
30,7% for Porto and 50% for Madrid).
b
a
b
c
d
e
f
g
h
i
a
b
a
Air and Water Quality Improvement during COVID-19 Lockdown
111
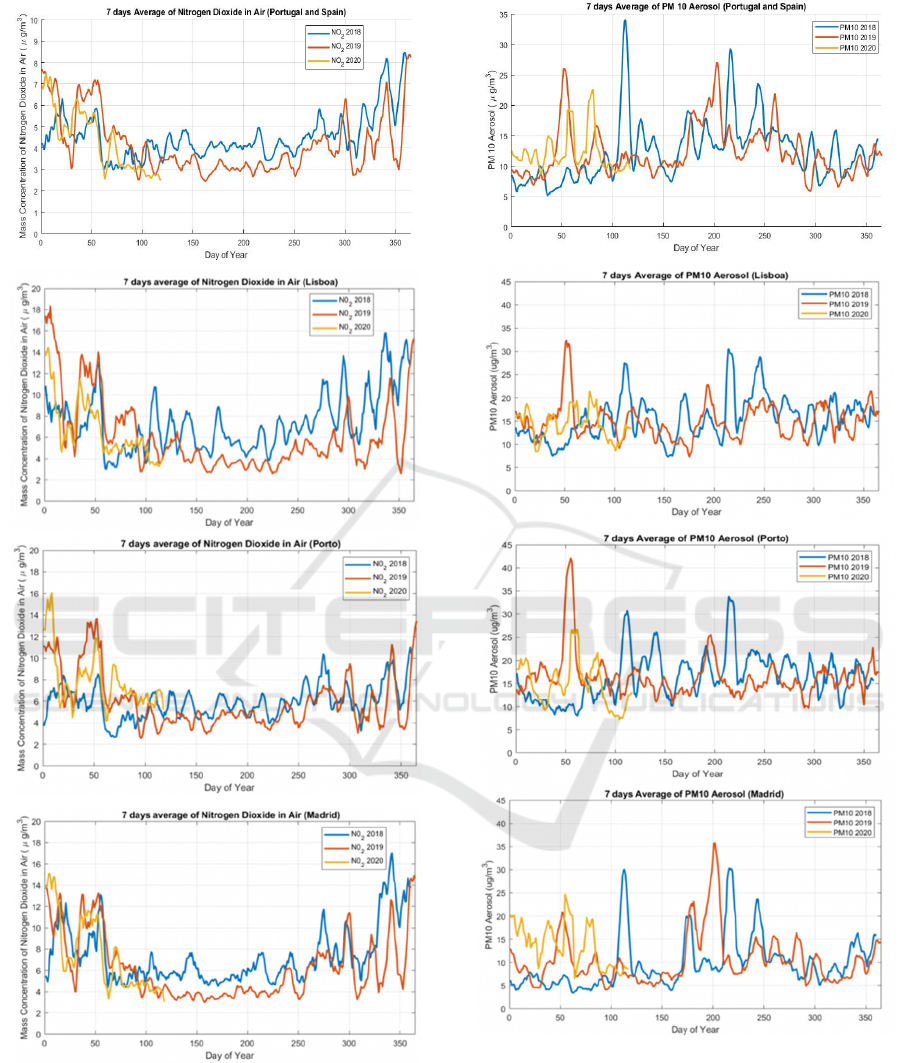
Figure 4: a) to d) - Historical mass concentration of
Nitrogen Dioxide in air for Portugal, Spain, Lisbon, Porto
and Madrid for 2018 (blue), 2019 (orange) and 2020
(yellow).
The concentration of PM10 was also analysed in
the three cities for the period of January-April 2020
and compared with the same period in 2019 and 2018.
Figure 5: a) to d) - Yearly PM10 evolution in 2018 (blue),
2019 (orange) and 2020 (yellow) for Portugal and Spain,
Lisbon, Madrid and Porto, respectively.
Comparing the results, it can be stated that there
is a reduction of PM10 levels in April based on
Portugal and Spain regional assessment. Comparing
with the two previous years, the area registered
reduction up to 24% in the two first weeks of April,
a
b
d
a
c
c
b
d
GISTAM 2021 - 7th International Conference on Geographical Information Systems Theory, Applications and Management
112
that decreases for 18% by 30 April. At a local
assessment, for Porto the PM10 levels are lower in
2020 than in the past two years for the end of March
and April. For the last day analysed (30 April 2020)
there is a reduction of approximately 22,9% for 2019
and 2018. For Lisbon, the PM10 levels are lower in
2020 than in the past two years in April, even though
there is a slight increase in some days of analysis,
matching the values of 2019, but then there was a
further drop in PM10 levels (reduction of 20% for
2019 and 2018, April 30). In the case of Madrid, the
reduction could only be verified from the second
week of April, and even so, in 30
th
there was a slight
increase of PM10 when comparing to 2019. The main
conclusion verified for the tree cities is that the
concentrations of PM10 in the air are lower since the
lockdown due to COVID-19 in March (33,3% for
Lisbon, 33,3% for Porto and 52,6% for Madrid).
All together, results from Figures 1-5 are
concordant with the results stated by Mesas-
Carrascosa et al., 2020 and Zhang et al., 2020.
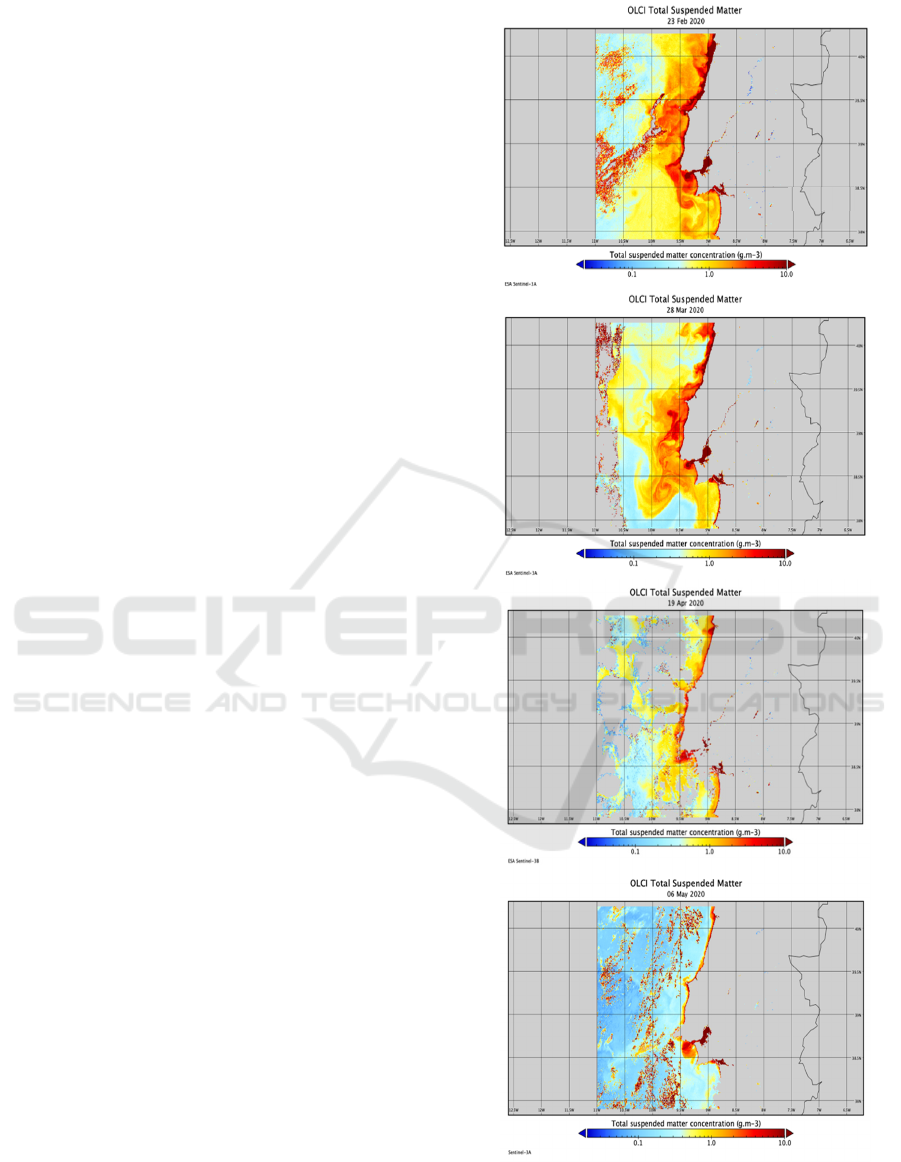
3.1 Water Quality
The concentration of TSM has been analysed before
and after COVID-19 pandemic to understand if any
changes had occurred. The approach consisted of
mapping TSM concentration on four dates,
corresponding to a given day of the month before
COVID-19 confinement (February 2020) and a given
day of each month during confinement (March, April
and May), as well as mapping the TSM differences
between these dates. This study was carried out using
the Water Full Resolution (WFR) level 2 data from
Sentinel-3 OLCI sensor
The following pictures illustrate the TSM for a
given day per month from February to May 2020. The
dates have been chosen according to the best no-cloud
images available.
The Image Differencing Change Detection
method was applied using the software ARCGIS in
order to visualise the positive and negative
differences between the TSM along these months.
Change detection involves quantifying temporal
effects using multi temporal data sets. When the
interest is to understand the changes over large areas
and at frequent interval satellite data these methods
are commonly used.
Figure 6: a) to d) - Total Suspended Matter for 23-02-2020,
28-03-2020, 19-04-2020 and 06-05-2020, respectively.
a
b
c
d
Air and Water Quality Improvement during COVID-19 Lockdown
113
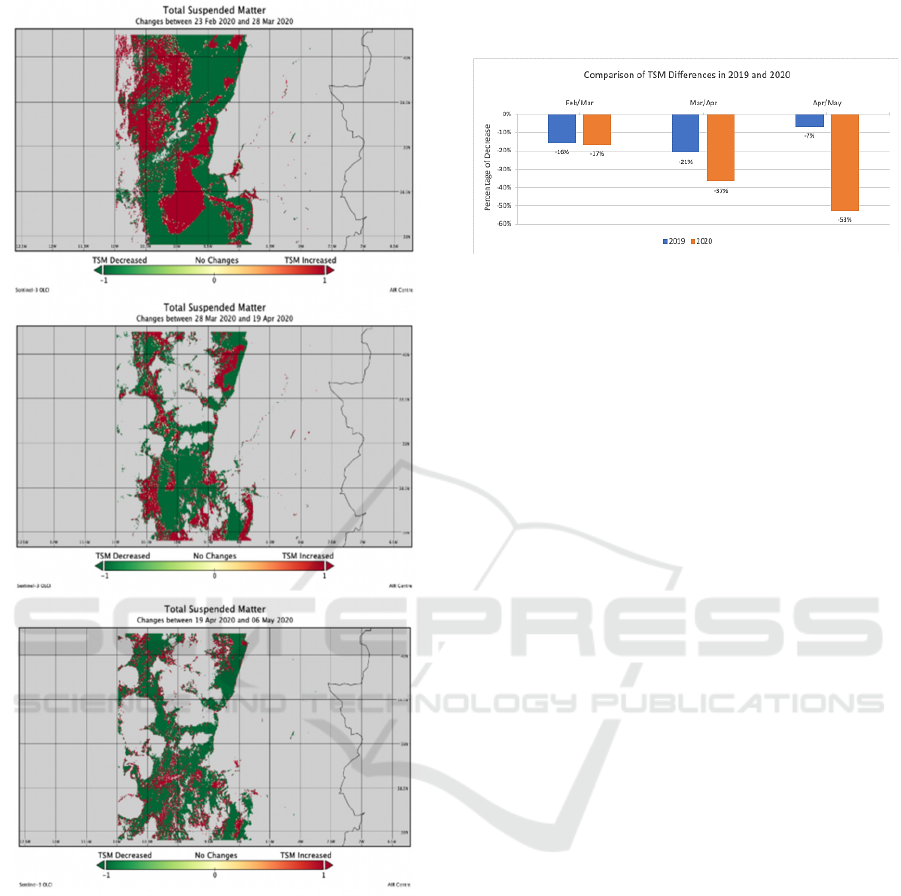
Figure 7: a) to c) Changes of TSM levels between 23-02-
2020 and 28-03-2020, 28-03-2020 and 19-04-2020, 19-04-
2020 and 06-05-2020, respectively.
The results suggest that there was a decrease on
the TSM concentration from February to March,
March to April and April to May of 17%, 37% and
53% respectively.
A similar approach was applied to compare the
TSM fluctuation between the months of 2020 with the
same fluctuation between the months of 2019 in order
to understand if there was any natural pattern on these
changes that can be affecting the results. In this case
the same method was applied to the images from 2019
and the results of this approach are summarised in the
chart below.
Figure 8: Percentage of TSM decrease between months in
2019 and 2020.
Although the TSM is not only a consequence of
human activities (Fernández-Nóvoa et al., 2017),
these results may indicate a pattern as a result of
COVID-19 restrictions.
4 CONCLUSIONS
This study has used, in a first stage, Sentinel-5P and
CAMS service to analyse the air quality in the
territory of Iberian Peninsula, as well as assess in
detail major cities within the region (Lisbon, Porto
and Madrid), for a period from January 2018 to April
2020. On a later stage, the data from Sentinel-3A and
3B allowed the analysis of water quality during the
months March, April and May 2020, in the
Portuguese coast. Regarding the air quality, NO
2
and
PM10 levels in the Iberian Peninsula were
consistently lower comparing with analogous periods
of late March and April of the two past years. In the
majority of the analysed cities, it was observed a
similar behaviour of the for the NO
2
and PM10
concentrations, except for a NO
2
in Porto that may
result from local anomalies. One aspect be taken into
account is that meteorological conditions such as
wind, rain and seasonal variations of boundary layer
have significant impact on the concentrations of these
air quality parameters. Concerning TSM levels, the
results suggest that there might be a pattern as a result
of COVID-19 restrictions, but seasonal variations
also play a role in this analysis, so it is required an
analysis with a more extended timeline to infer about
the role of COVID-19 pandemic in the transparency
of the coastal waters. In 2020 the reduction of TSM
concentration has been much more pronounced when
compared with the same period of 2019, which, most
likely, could be due to COVID-19 confinement.
As future work, it is necessary to consider a wider
sample of previous years in order to identify seasonal
a
b
c
GISTAM 2021 - 7th International Conference on Geographical Information Systems Theory, Applications and Management
114

patterns and better conclude about the local
anomalies; also consider a cross-validation of these
findings with local water sampling reports and
results, as well with data from local atmosphere
pollution sensors.
ACKNOWLEDGEMENTS
We want to acknowledge the European Commission,
in partnership with the Member States, the European
Space Agency (ESA), the European Organisation for
the Exploitation of Meteorological Satellites
(EUMETSAT), the European Centre for Medium-
Range Weather Forecasts (ECMWF), EU Agencies
and Mercator Océan for providing data from Sentinel-
3A, 3B and 5P freely available to the public.
REFERENCES
Fernández-Nóvoa, D., Gómez-Gesteira, M., Mendes, R.,
DeCastro, M., Vaz, N., & Dias, J. M. (2017). Influence
of main forcing affecting the Tagus turbid plume under
high river discharges using MODIS imagery. PLoS
ONE, 12(10). https://doi.org/10.1371/journal.pone.018
7036
Henriques, M., 2020. Will Covid-19 Have a Lasting Impact
on the Environment?. [WWW Document].
URLhttps://www.bbc.com/future/article/20200326-
covid-19-the-impact-of-coronavirus-on-the-
environment
Mesas-Carrascosa, F.-J., Pérez Porras, F., Triviño-
Tarradas, P., García-Ferrer, A., & Meroño-Larriva, J. E.
(2020). Effect of Lockdown Measures on Atmospheric
Nitrogen Dioxide during SARS-CoV-2 in Spain.
Remote Sensing, 12(14), 2210. https://doi.org/
10.3390/rs12142210
World Health Organization website: https://www.who.int/
health-topics/air-pollution. Accessed in August 24,
2020
Yunus, A. P., Masago, Y., & Hijioka, Y. (2020). COVID-
19 and surface water quality: Improved lake water
quality during the lockdown. Science of the Total
Environment, 731. https://doi.org/10.1016/j.scitotenv.
2020.139012
Zhang, Z., Arshad, A., Zhang, C., Hussain, S., & Li, W.
(2020). Unprecedented Temporary Reduction in Global
Air Pollution Associated with COVID-19 Forced
Confinement: A Continental and City Scale Analysis.
Remote Sensing, 12(15), 2420. https://doi.org/10.3390/
rs12152420
Disclaimer: Neither AIR Centre, the European
Commission nor ECMWF is responsible for any use
that may be made of the information this report
contains.
Air and Water Quality Improvement during COVID-19 Lockdown
115
