
Separation Method of Atrial Fibrillation Classes with High Order
Statistics and Classification using Machine Learning
Luís Fillype da Silva
1
, Jonathan Araújo Queiroz
1
, Caroline Vanessa
2
, Allan Kardec Barros
1
,
Gean Carlos Lopes
1
and Letícia Cabral
1
1
Departament of Eletrical Engineering, Federal University of Maranhão, Av. dos Portugueses, São Luís, Brazil
2
Department of Nursing, Faculdade Santa Terezinha, São Luis, Brazil
lcabralcorreia@gmail.com
Keywords: ECG, Machine Learning, High Order Statistics, Signs Classification.
Abstract: The electrocardiogram (ECG) is an exam that presents a graphical representation of the electrical activity of
the heart. Through it, it is possible to observe the rhythm of heart beats, the number of beats per minute, in
addition to enabling the diagnosis of various arrhythmias. This article aims to develop a classification model
based on the beats of three groups of individuals: with atrial fibrillation, intra-atrial fibrillation and normal
sinus rhythm. The methodology of extraction of characteristics based and adapted to classify Atrial
Fibrillation and its subtype, Intracardiac Atrial Fibrillation. The classifications were carried out in three-
dimensional space in two stages: with the application of Principal Component Analysis (PCA) and without
application of it, through Artificial Neural Networks (ANN), Support Vector Machines (SVM) and K-nearest
Neighbors (KNN), obtaining accuracy of 93% to 99%.
1 INTRODUCTION
Atrial fibrillation (AF) as being a supraventricular
arrhythmia characterized by disorganized atrial
electrical activity, secondary to multiple foci of atrial
depolarization (Neto et al., 2018).
Despite recent advances in the treatment of AF,
patients with this heart disease still have high
mortality. This is because there are other ways that
AF. It has been widely used due to the nature of its
observations, as shown: the complex electrical pattern
observed during AF can be explained with several
waves that propagate along several routes along the
atria; the available data also support a focal
mechanism, according to which conductors, located
mainly in the pulmonary veins, trigger and support
the spread of electrical activity in the atria (Richter et
al., 2010). Thus, ECG is essential to predict, detect
and diagnose various heart problems, aiding in its
diagnosis (Queiroz et al., 2017).
Works such as that of Kachuee et. al. (2018)
proposes a method based on deep convolutional
neural networks for the classification of heartbeat,
capable of accurately classifying five different
arrhythmias. Hullah et. al. (2020) performs a
classification of 8 types of arrhythmia also using
convolutional neural networks. In Queiroz et al.
(2017) studied the variability of heartbeat and
provided an automatic diagnosis method for heart
disease. Alhusseini et al. (2020) developed a
convolutional neural network to train 100,000 AF
image grids. There are still methods in the literature
that classify ECG signals, as proposed in Ma et al.
(2020), using the RR interval for this classification of
Atrial Fibrillation.
This paper studies and proposes a method of
extracting the heartbeat of all ECGs from the bases
used, grouping 3 groups: individuals with signs of
Atrial Fibrillation, Intracardiac Atrial Fibrillation and
healthy, using high-order Statistics, and subsequently
performing the classification in three Machine
Learning algorithms.
2 THEORY
2.1 ECG
The ECG is essential two main types of information.
First, in medicine, the cardiologist can measure the
284
Fillype da Silva, L., Queiroz, J., Vanessa, C., Barros, A., Lopes, G. and Cabral, L.
Separation Method of Atrial Fibrillation Classes with High Order Statistics and Classification using Machine Learning.
DOI: 10.5220/0010325402840291
In Proceedings of the 14th International Joint Conference on Biomedical Engineering Systems and Technologies (BIOSTEC 2021) - Volume 4: BIOSIGNALS, pages 284-291
ISBN: 978-989-758-490-9
Copyright
c
2021 by SCITEPRESS – Science and Technology Publications, Lda. All rights reserved
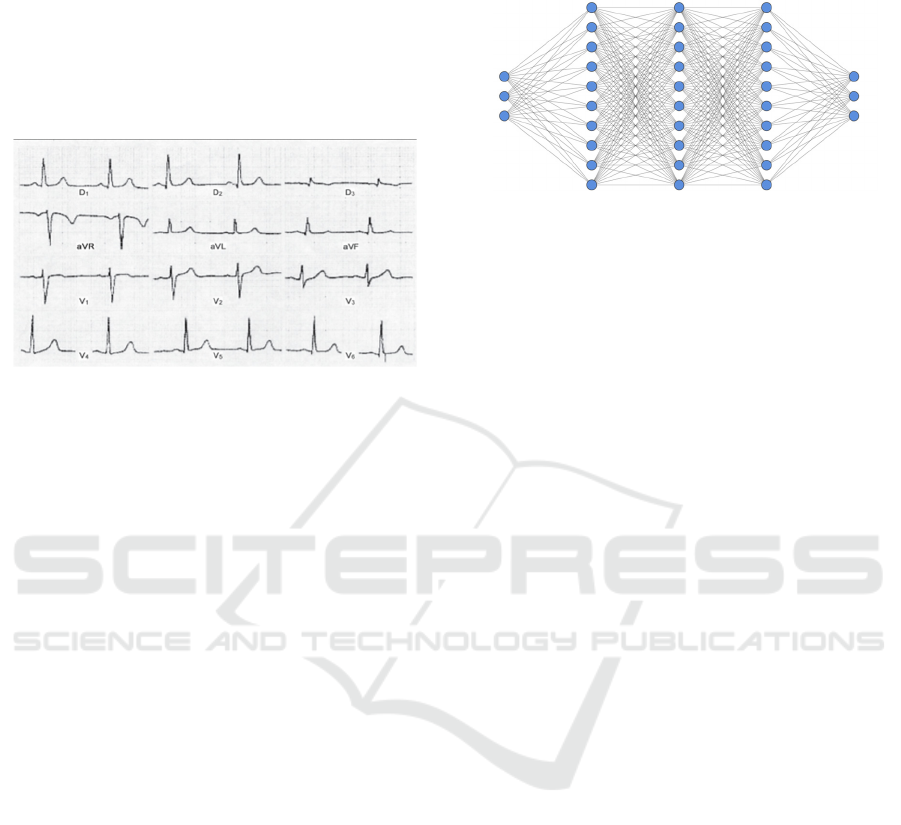
time intervals of the ECG to determine how long the
electrical wave takes to pass through the heart's
electrical conduction system. This information find
out to find out if electrical activity is regular or
irregular, fast or slow. Second, by measuring the
strength of electrical activity, the cardiologist is able
to find out if parts of the heart are too large or
overloaded (Ebrahimi et al., 2020).
Figure 1: ECG.
2.2 Machine Learning
Within the innovations of data science, Machine
Learnine is a class of techniques and research area
that allows computers to learn as humans and to
extract or classify patterns. Machines may also be
able to analyze more data sets and extract data
resources that humans may not be able to do. This
technique allows the creation of algorithms that can
learn and make predictions. In contrast to rule-based
algorithms, AM takes advantage of greater exposure
to large and new data sets and has the ability to
improve and learn from experience, such as Neural
Networks, K-nearest Neighbors (Choy et al. 2016).
2.2.1 Artificial Neural Network
Artificial Neural Networks (ANN), better known as
neural networks, as complex structures
interconnected by simple processing elements
(neurons), which have the ability to perform
operations, such as calculations in parallel, for data
processing and knowledge representation (Haykin,
2001).
The author also stresses the properties and
capabilities that make ANN potentially useful are:
non-linearity: an artificial neuron can use linear or
non-linear functions; Input-Output mapping: based
on examples of input and output, the ANN is able to
adapt to minimize the mapping error. Among the
known structures of these models, we have the MLP
(Multilayer Perceptron), which, in general, has an
input layer, one or more hidden layers and an output
layer. See Figure 2 for the MLP model.
Figure 2: MLP model.
In this paper, MLP was used with hyperparameter
of 3 neurons in the input layer, 2 layers with 100
neurons, and 3 neurons in the output layer.
2.2.2 K-Nearest Neighbors (KNN)
KNN is one of the prospective statistical
classification algorithms used to classify objects
based on training examples closest to the plane.
According to the authors, it is a slow algorithm, due
to the model or real learning not being performed
during the training phase. In this case, this set is used
only to fill a sample of the space with instances whose
class is known. At this stage, the vector and class
labels of the user-defined constant training samples, a
query or test point (unlabeled vector), and the data are
classified by assigning a label, which is the most
recurrent among the K samples training courses
closer to that consulted point (Noi and Kappas ,2018).
In this paper, KNN with K settings equal to 10
was used for the classification of heart disease.
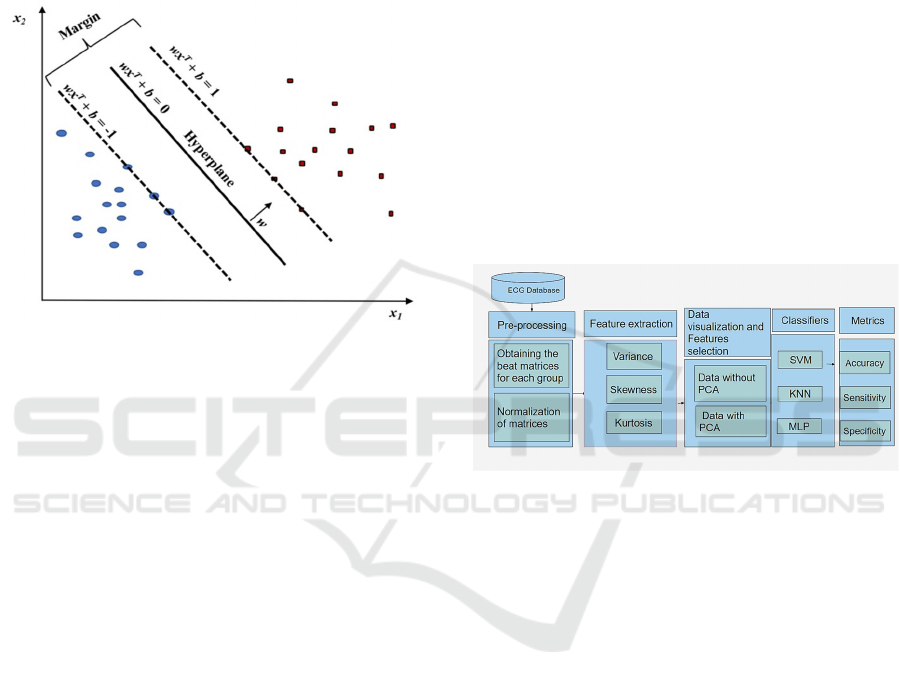
2.2.3 Support Vector Machine (SVM)
SVM as a powerful method to build a classifier. This
method aims to create a decision boundary between
two classes that makes it possible to predict the labels
of one or more feature vectors. For the authors, this
decision frontier, known as a hyperplane, is oriented
so that it is as far as possible from the closest data
points for each of the classes present. Such closer
points are called support vectors, giving rise to the
method name (Huang et al., 2017).
In this way, the ideal hyperplane can then be
defined as that which separates the data and
maximizes the margin, respecting the following
equations (Huang et al., 2017).
w𝑥
𝑏 0
(1
)
w𝑥
𝑏 1
(2
)
Separation Method of Atrial Fibrillation Classes with High Order Statistics and Classification using Machine Learning
285
wxᵀ + 𝑏 ≤ −1
(3)
In the above equations, w represents the values of
the weights, x the input vector and the bias value.
Being the Equation (1) representing the optimal
hyperplane, the Equations (2) e (3) parameterizing the
data that represents the classes. The explanatory
Figure 3 follows.
Figure 3: SVM model.
2.2.4 Principal Component Analysis (PCA)
PCA as a statistical technique that aims at condensing
information from a large set of variables correlated
into some variables ("main components"), while not
wasting the variability present in the data set. For the
authors, the main components are derived as a linear
combination of the variables in the data set, with
weights chosen so that these components necessarily
become uncorrelated. Each component contains new
information about the data set and is ordered so that
the first components account for most of the
variability (Ramon et al., 2006).
Demonstrating the importance of this technique,
including ECG signs, PCA is used to deal with
several problems in ECG analysis, such as data
compression, beat detection and classification, noise
reduction, separation signal and resource extraction
(Ramon et al., 2006).
In this paper, PCA is not used to reduce
dimensionality, but to not correlate the data, as
described in (Haykin, 2009).
2.2.5 High-order Statistics
In the early 1990s, in particular, there was an increase
in interest in High Order Statistics and its
applications. The application of cumulants in several
fields of knowledge was verified, such as sonar,
biomedicine, data processing, image reconstruction,
etc (Borelli, 2018).
These statistics provide more information than is
available simply provided through the mean and
variance of a process. Thus, it can be said that they
allow a better way to discriminate processes. So, to
better understand and start an approach beyond the
variance and average of the sets, using the skewness
and kurtosis of the data.
3 MATERIALS AND METHOD
In Figure 4, the methodology used in this article is
illustrated. The used databases were defined,
separating them into 3 groups: signs of individuals
with AF, individuals with intra-cardiac AF and
individuals with normal sinus rhythm. The database
signs were pre-processed.
Figure 4: Methodology.
Then, the features represented by high-order
statistics were selected, applying the PCA, generating
new data. Data with PCA and without PCA were
placed as input for classifiers, in order to investigate
the difference in classifications in both approaches.
3.1 Database
The Intracardiac Atrial Fibrillation Database, MIT-
BIH Atrial Fibrillation Database and The MIT-BIH
Normal Sinus Rhythm Database data sets, both
available in Goldberger et al. 2000, were used. The
database of signs of patients with AF contains 23
records, all of which are used in this analysis. The
signal database of patients with intra-cardiac AF
contains 8 patients, all of which are used. From the
database of individuals with normal sinus rhythm, 18
patients were used.
3.2 Pre-processing
ECG signs characteristic of the DII lead were
acquired. The entire duration of the signal, sampled at
BIOSIGNALS 2021 - 14th International Conference on Bio-inspired Systems and Signal Processing
286
a frequency of 256 Hz, was used to extract the beats
of each patient for analysis and subsequent extraction
of features.
After that, each selected signal was segmented to
obtain the respective beat, as proposed by Queiroz et
al. (2017). Thus, the beats of each group were
grouped, generating three matrices, one for each
group of individuals, as described in the equations
below.
𝑀
𝐵𝑛,𝑎 𝐵𝑛,𝑏…𝐵𝑛,𝑧
(4)
where n represents the number of beats, equal to 190,
and a to z represents the total of all columns of all
beats. Concomitant to this, the mean of its set was
subtracted from the sign, dividing the result by
Shannon's entropy, given by the Equation (5).
𝑍 𝑀
∑
∑
(5)
where p represents the probability associated with
each beat, and Z represents the new matrix associated
with the concatenation of the beats.
3.3 Feature Extraction
The extraction methodology was adapted using high-
order statistics, proposed by Queiroz et al. (2017). A
vector was obtained for each of the associated
statistics: variance, kurtosis and asymmetry, which
will be the inputs of the classifiers, represented by
𝜎
, 𝜅
and 𝜆
, respectively. The equations that
describe such statistics are described in Equation (6),
(7) and (8), where E(x) represents the Expected value.
𝜎
𝐸𝑋
𝐸𝑋
(6)
𝜆
𝐸𝑋 𝐸
𝑋
𝜎
(7)
𝜅
𝐸𝑋 𝐸
𝑋
𝜎
(8)
3.4 Evaluation Metrics
In this article, the values of accuracy, sensitivity and
specificity, described by Equation (9), (10) and (11),
were used to verify the performance of the classifiers.
In the equations, TP corresponds to the number of
true positives, TN to true negatives, FP to record false
positives and FN to classify false negatives.
𝐴
𝑐𝑐𝑢𝑟𝑎𝑐𝑦
𝑇𝑃 𝑇𝑁
𝑇𝑃 𝐹𝑁 𝑇𝑁 𝐹𝑃
𝑥 100
(9)
𝑆𝑒𝑛𝑠𝑖𝑡𝑖𝑣𝑖𝑡𝑦
𝑇𝑃
𝑇𝑃 𝐹𝑁
𝑥 100
(10
)
𝑆𝑝𝑒𝑐𝑖𝑓𝑖𝑐𝑖𝑡𝑦
𝑇𝑁
𝑇𝑁 𝐹𝑃
𝑥 100
(11
)
3.5 Cross-validation
Cross validation is a technique to assess the
generalizability of a model, based on a set of data. In
this article, the data is divided using the holdout
method, which consists of dividing the data into 70
and 30 at random. 70% of the patients were used for
training, 30% for testing and k-fold equal to 7.
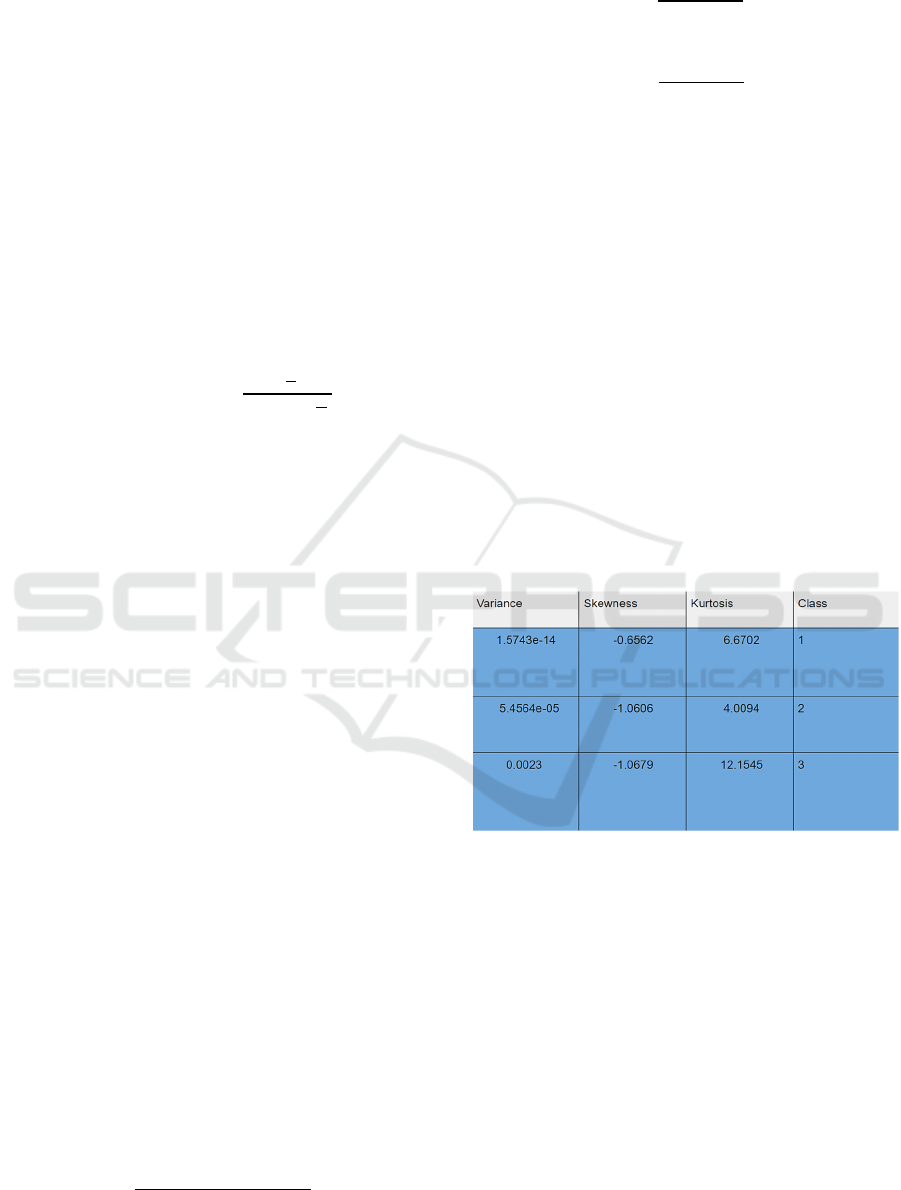
3.6 Dataset Builded
The construction of the data set was carried out as
follows. A column was created for each statistic,
representing the variance, skewness and kurtosis of
each beat. A label was also created, column 4 of the
data set, which represents the class belonging to the
respective beat. This class has a value of 1 for a
healthy, 2 for intracardiac AF and 3 for AF. See
Figure 6 below.
Figure 5: Data examples.
4 RESULTS
This paper analyzed the beats extracted from the ECG
for patients with normal sinus rhythm, AF and signs
from individuals with intra-cardiac AF, in order to
classify them.
For the classification stage, matrices were
generated, where each column is represented by
variance, skewness and kurtosis, respectively. Such
matrices were the inputs of the KNN, SVM and ANN
classifiers to verify which classification algorithm has
greater accuracy, sensitivity and specificity. The
results were compared with PCA in the data sets and
Separation Method of Atrial Fibrillation Classes with High Order Statistics and Classification using Machine Learning
287
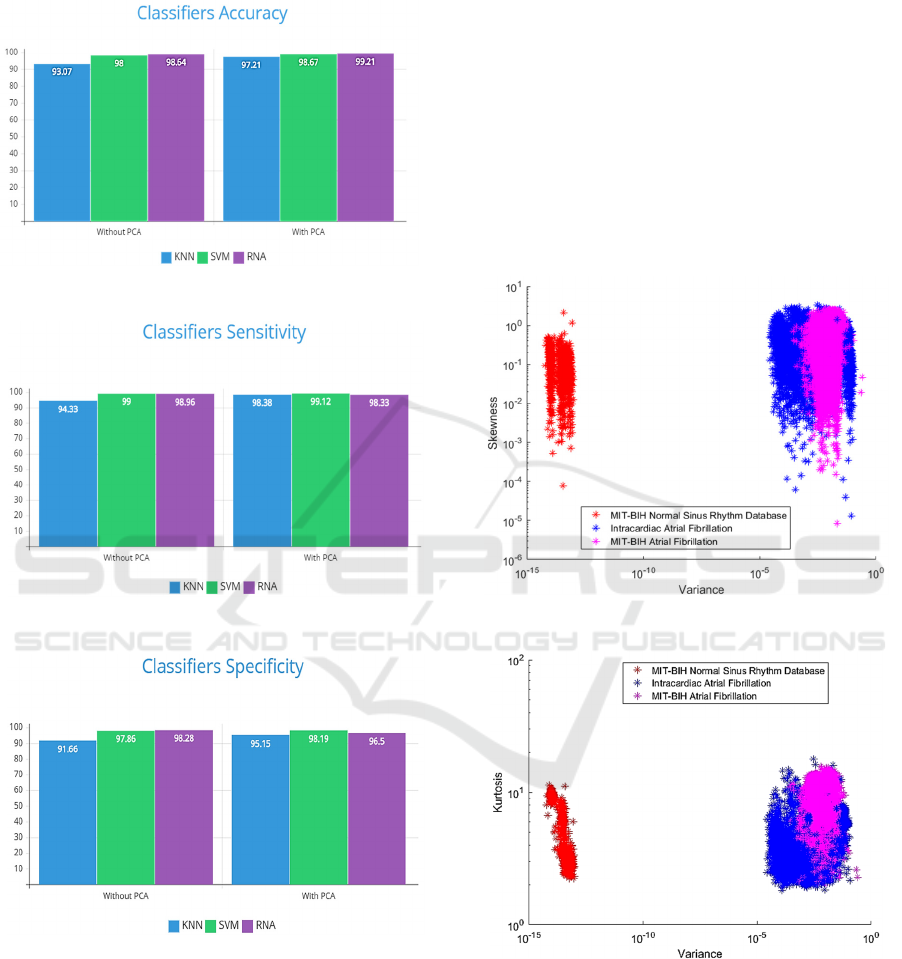
without the application of the same. See below in
Figure 6, Figure 7 and Figure 8.
Figure 6: Classifiers Accuracy.
Figure 7: Classifiers Sensibility.
Figure 8: Classifiers Specificity.
5 DISCUSSION
5.1 Data without PCA
In his work, Ma et al. (2020) used the RR interval for
the classification, obtaining an accuracy of 98.3%. In
another study, the same authors also used the RR
interval, classifying with CNN-LSTM, obtaining an
accuracy of 97.21%. Alhusseini et al. (2020)
developed a CNN applied to images of 35 patients,
who made decisions similar to that of specialists, with
95% accuracy. Khriji et al. (2020) used ANN to
classify three differents types of heart diseases too,
obtaining 93.1% of accuracy. In this work, the
approach of extracting features of the beats was used,
with high order statistics, obtaining an accuracy of
98.95 % for ANN.
In Figure 9, 10, 11, the analysis without PCA
shows that the AF data are quite grouped, as they are
the same heart disease, but with different analysis
approaches.
Figure 9: Beats expressed by Variance and Skewness.
Figure 10: Beats expressed by Variance and Kurtosis.
BIOSIGNALS 2021 - 14th International Conference on Bio-inspired Systems and Signal Processing
288
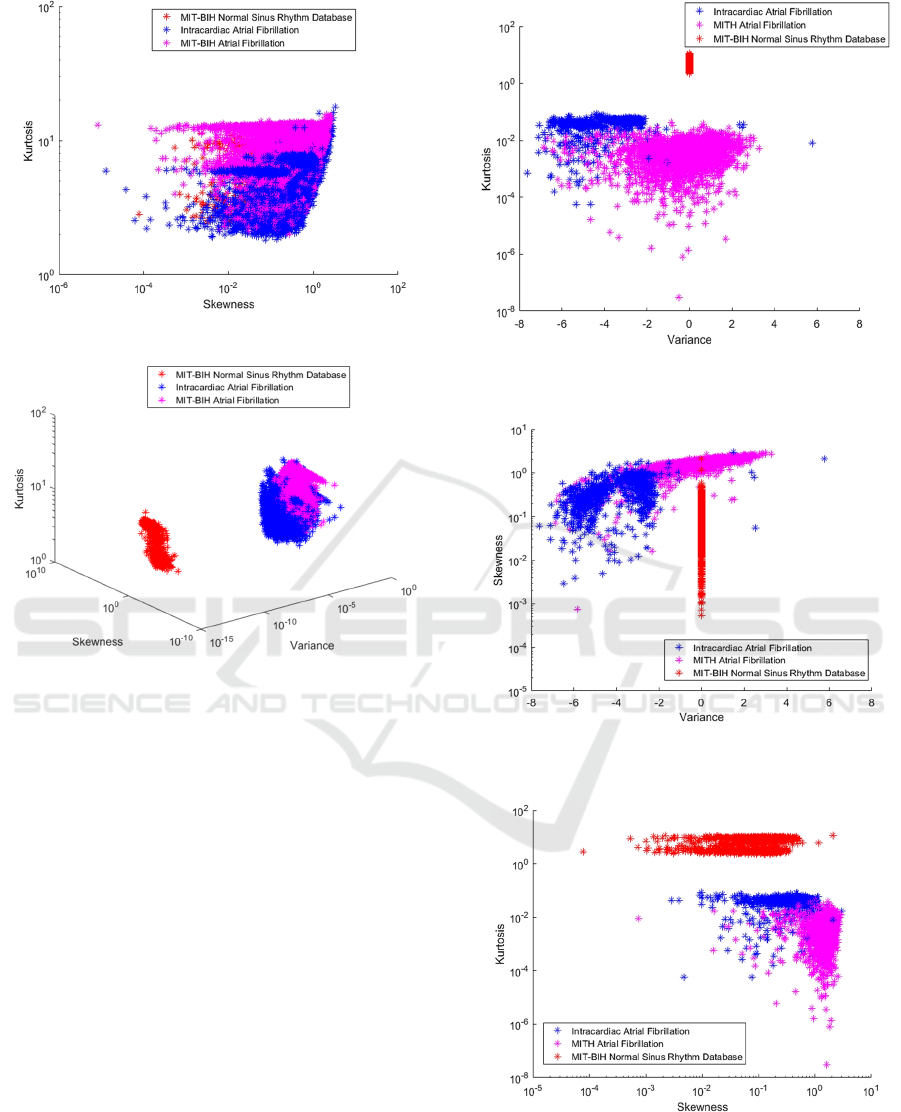
Figure 11: Beats expressed by Skewness and Kurtosis.
Figure 12: Beats expressed by Variance, Skewness and
Kurtosis.
Separations that use variance as features present a
good representation and achieve high accuracy in
relation to other combinations. This is because
kurtosis can be an appropriate approach to measure
sparse signs, such as the ECG, as discussed in
Queiroz et. al. (2017). It is also inferred from Figure
6 that exemplifies the construction of the dataset, that
the data sets have variance and kurtosis very different
from each other, justifying this result.
5.2 Data with PCA
To improve the representation of these features, the
PCA was then used to rotate these data, resulting in
Figure 14.
As seen in Figures 14, 15, 16, and 17, the results
of the classifications with the use of the PCA were
better and confirmed by the metrics of evaluation of
the algorithms themselves, described in Equations 9,
10, and 11.
Figure 13: Beats expressed by Variance and Kurtosis with
PCA.
Figure 14: Beats expressed by Variance and Skewness with
PCA.
Figure 15: Beats expressed by Skewness and Kurtosis with
PCA.
Separation Method of Atrial Fibrillation Classes with High Order Statistics and Classification using Machine Learning
289

Figure 16: Beats expressed by Variance, Skewness and
Kurtosis with PCA.
SVM performed better due to its easy parameter
definition. For ANN, on the other hand, it is necessary
to estimate and define these values very well
empirically to ensure convergence and generalization
capacity. That is, to achieve the best result, it is
necessary to test several different architectures,
increasing or decreasing the number of hidden layers,
making variations in the learning rates, momentum
and number of training periods.
KNN, on the other hand, because it has a slow
training and it is also necessary to estimate the
number of K, this algorithm had a performance below
the others used.
6 CONCLUSIONS
In this paper, the effectiveness of using high-order
statistics to extract characteristics and classify heart
disease, such as atrial fibrillation, was reinforced. In
addition, the use of data modification was shown,
showing a difference in the performance of the
original data and the rotated data in ECG signs. It is
also concluded that although they are the same
pathology, computationally FA and intracardiac FA
have different features. It can also be concluded that
the use of the entire beat instead of the RR interval
can be a good methodology to solve this problem.
In future works, different cardiovascular diseases
can be studied in the methodology and techniques can
be used to improve the pre-processing, as well as
apply other classifiers to evaluate the metrics, and to
test hyperparameters of the classification algorithms.
ACKNOWLEDGEMENTS
We thank CNPQ, the Biological Signal Processing
Laboratory of the Federal University of Maranhão
(UFMA) and BIOSIGNALS for the opportunity to try
to publish science.
REFERENCES
Alhusseini, M. I, Abuzaid, F, Rogers, A. J, Zaman, J. A. B,
Baykaner, T, Clopton, P, Bailis, P, Zaharia, M, Wang,
P.J, Rappel, W.J, and Narayan, S. M. (2020). Machine
Learning to Classify Intracardiac Electrical Patterns
During Atrial Fibrillation. Circulation: Arrhythmia and
Electrophysiology, 13(8). doi: 10.1161/CIRCEP.119.
008160.
Borelli, A.F. (2018). Extração de Características em Sinais
Biológicos Retrieved September 15, 2020 from:
https://www.ppgee.ufmg.br/defesas/1479M.PDF.
Choy, G, Khalilzadeh, O, Michalski, M, Do, S, Samir, A.E,
Pianykh, O.S, Geis, J, Pandharipande, P.V, Brink, J.A,
Dreyer, K.J. (2018) Current Applications and Future
Impact of Machine Learning in Radiology. Radiology,
288(2), 171820. doi: 10.1148/radiol.2018171820.
Ebrahimi, Z, Loni, M, Gharehbaghi, A, and Daneshtalab,
M. (2020). A Review on Deep Learning Methods for
ECG Arrhythmia Classification. Expert Systems with
Applications X, V(7). doi: 10.1016/j.eswax.2020.100
033
Goldberger, A.L, Amaral L.A.N, Glass, L, Hausdorff, J. M,
Ivanov, P. C, Mark, R.G, Mietus, J.E, Moody, G.B,
Peng, C.K, and Stanley, H. E. (2000). The MIT-BIH
Atrial Fibrillation Database. Retrieved September 12,
2020, from: https://archive.physionet.org/physiobank/
database/afdb
Goldberger, A. L, Amaral L.A.N, Glass, L, Hausdorff, J. M,
Ivanov, P. C, Mark, R.G, Mietus, J. E, Moody, G.B,
Peng, C.K, and Stanley, H. E. (2000). Intracardiac
Atrial Fibrillation Database. Retrieved September 12,
2020, from: https://archive.physionet.org/physiobank/
database/iafdb/.
Goldberger, A.L, Amaral L.A.N, Glass, L, Hausdorff, J. M,
Ivanov, P. C, Mark, R.G, Mietus, J.E, Moody, G.B,
Peng, C.K, and Stanley, H. E. (2000). The MIT-BIH
Normal Sinus Rhythm Database. Retrived September
12, 2020, from: https://archive.physionet.org/physio
bank/database/nsrdb/.
Goldberger A. L, Amaral L.A, Glass L, Hausdorff J. M,
Ivanov P. C, Mark, R. G., Mietus, J. E, Moody G. B,
Peng C. K., and Stanley H. E., (2000). PhysioBank,
PhysioToolkit, and PhysioNet: Components of a New
Research Resource for Complex Physiologic Signals.
Circulation 101(23): e215-e220.
Haykin, S. (2001). Redes neurais: princípios e prática (2
th
ed.). Porto Alegre: Bookman.
BIOSIGNALS 2021 - 14th International Conference on Bio-inspired Systems and Signal Processing
290

Haykin, S. (2009). Neural networks and Learing Machines
(3th ed.). London: Pearson.
Huang, S, Cai, N, Pacheco, P. P, Narrandes, S, Wang, Y
and Xu, W. (2018). Applications of Support Vector
Machine (SVM) Learning in Cancer Genomics. Cancer
genomics & proteomics, 15(1), 41-51. doi:
10.21873/cgp.20063.
Kachuee, M, Fazeli, S, and Sarrafzadeh, M. (2018). ECG
Heartbeat Classification: A Deep Transferable
Representation. ArXiv. Retrieved from:
https://arxiv.org/abs/1805.00794.
Khriji, L, Marwa, F, and Machhout, M. (2020). Deep
Learning-Based Approach for Atrial Fibrillation
Detection. Development of Computer Vision (CV)
Technology for Quality Assessment of Dates in Oman,
LNCS 12157, 100–113. doi:10.1007/978-3-030-51517-
1_9.
Ma, F, Zhang, J, Liang, W, and Xue, J. (2020). Automated
Classification of Atrial Fibrillation Using Artificial
Neural Network for Wearable Devices. Mathematical
Problems in Engineering, 2020(si), 1-6. doi:
10.1155/2020/9159158.
Ma, F, Zhang, J, Chen, W, Liang, W and Yang, W. (2020)
An Automatic System for Atrial Fibrillation by Using a
CNN-LSTM Model. Discrete Dynamics in Nature and
Society. Retrieved from: https://www.hindawi.com/
journals/ddns/2020/3198783/.
Neto, J.F, Moreira, H. T and Miranda, C. H. (2018)
Fibrilação Atrial – INÍCIO. Revista Qualidade.
Retrived from: https://www.hcrp.usp.br/revista
qualidade/edicaoselecionada.aspx?Edicao=6.
Noi, P. T, Kappas, M. (2018). Comparison of Random
Forest, k-Nearest Neighbor, and Support Vector
Machine Classifiers for Land Cover Classification
Using Sentinel-2 Imagery. Sensors, 18(1),18. doi:
10.3390/s18010018.
Queiroz, J.A, Junior, A, Lucena, F, and Barros, A.K. (2017)
Diagnostic decision support systems for atrial
fibrillation based on a novel electrocardiogram
approach. Journal of electrocardiology, 51(2), 252-
259. doi:10.1016/j.jelectrocard.2017.10.014.
Ramon, F. C, Laguna, P, Sörnmo, L Bollmann, A. and J.
M. Roig. (2007). Principal component analysis in ECG
signal processing. EURASIP Journal on Advances in
Signal Processing, 2007(1). doi 10.1155/2007/74580.
Richter, U, Faes, L, Cristoforetti, A, Masè, M, Ravelli, F,
Stridh, M, and Sörnmo, L., (2010). A Novel Approach
to Propagation Pattern Analysis in Intracardiac Atrial
Fibrillation Signals. Annals of Biomedical Engineering,
39(1),310-23. doi: 10.1007/s10439-010-0146-8.
Ullah, A, Anwar, S. M, Bilal, M, and Mehmood, R. M.,
Classification of Arrhythmia by Using Deep Learning
with 2-D ECG Spectral Image Representation. Arxiv.
Retrieved from: https://arxiv.org/pdf/2005.06902.
Separation Method of Atrial Fibrillation Classes with High Order Statistics and Classification using Machine Learning
291
