
Optimal Sensor Placement for Human Activity Recognition with a
Minimal Smartphone–IMU Setup
Vincent Xeno Rahn
a
, Lin Zhou
b
, Eric Klieme
c
and Bert Arnrich
d
Hasso Plattner Institute, University of Potsdam, 14482 Potsdam, Germany
Keywords:
Human Activity Recognition, HAR, Inertial Measurement Unit, IMU, Smartphone, Sensors, Convolutional
Neural Network, CNN, Deep Learning.
Abstract:
Human Activity Recognition (HAR) of everyday activities using smartphones has been intensively researched
over the past years. Despite the high detection performance, smartphones can not continuously provide reli-
able information about the currently conducted activity as their placement at the subject’s body is uncertain. In
this study, a system is developed that enables real-time collection of data from various Bluetooth inertial mea-
surement units (IMUs) in addition to the smartphone. The contribution of this work is an extensive overview
of related work in this field and the identification of unobtrusive, minimal combinations of IMUs with the
smartphone that achieve high recognition performance. Eighteen young subjects with unrestricted mobility
were recorded conducting seven daily-life activities with a smartphone in the pocket and five IMUs at different
body positions. With a Convolutional Neural Network (CNN) for activity recognition, activity classification
accuracy increased by up to 23% with one IMU additional to the smartphone. An overall prediction rate of
97% was reached with a smartphone in the pocket and an IMU at the ankle. This study demonstrated the
potential that an additional IMU can improve the accuracy of smartphone-based HAR on daily-life activities.
1 INTRODUCTION
Human Activity Recognition (HAR) enables retrieval
of high-level knowledge from low-level sensor inputs
(Chen et al., 2019) and is capable of monitoring daily-
life activities as walking, sitting, or running. Impor-
tant applications lay in the field of healthcare in terms
of physical monitoring (Zhang and Sawchuk, 2012).
For example, HAR can inform subjects about irreg-
ularities as early as possible for diagnosis and direct
treatments.
HAR is commonly performed using inertial mea-
surement units (IMUs). An IMU is a combination of
multiple inertial sensors: an accelerometer (measures
acceleration), a gyroscope (measures angular veloc-
ity), and sometimes a magnetometer (measures mag-
netic field) (Ahmad et al., 2013). An IMU can be used
as a standalone device or integrated into other devices
like smartphones. Recent advancements in hardware
and a growing variety of standalone IMU devices
a
https://orcid.org/0000-0001-5241-6700
b
https://orcid.org/0000-0001-9916-3878
c
https://orcid.org/0000-0001-7032-2230
d
https://orcid.org/0000-0001-8380-7667
(Zhou et al., 2020) led to increasing applications us-
ing IMUs (Zhu and Sheng, 2009). The fact that many
of them now also support wireless communication
protocols allows smartphones or computers to receive
sensor data in real-time. Meanwhile, smartphone-
based HAR has been intensively researched over the
past years. Because smartphones require no instal-
lation costs, are user-friendly, and provide an un-
obtrusive way of recording data in daily situations,
they have become a standard tool for HAR (Su et al.,
2014).
To date, a large number of studies exist investigat-
ing HAR. Some of them focus on HAR using smart-
phone sensors (Su et al., 2014; Ghosh and Riccardi,
2014; Bayat et al., 2014) and others on HAR using
body-worn standalone IMU devices (Altun and Bar-
shan, 2010; Huynh, 2008; Janidarmian et al., 2017),
few of them transferring data via Bluetooth (Bulling
et al., 2014; Khan et al., 2010). There have also
been some studies determining the highest accuracy-
achieving sensor placements (Atallah et al., 2011;
Orha and Oniga, 2014; Mannini et al., 2015).
Rahn, V., Zhou, L., Klieme, E. and Arnrich, B.
Optimal Sensor Placement for Human Activity Recognition with a Minimal Smartphone–IMU Setup.
DOI: 10.5220/0010269100370048
In Proceedings of the 10th International Conference on Sensor Networks (SENSORNETS 2021), pages 37-48
ISBN: 978-989-758-489-3
Copyright
c
2021 by SCITEPRESS – Science and Technology Publications, Lda. All rights reserved
37

1.1 Motivation
Smartphones as recording devices are a convenient
solution for HAR as they have built-in motion sen-
sors such as accelerometer or gyroscope. However,
the sensor data received from smartphones might also
be incorrect or misleading in many situations, even if
only considering all the different ways people carry
their phones or how they interact with them during
the day. Activities such as writing a short text mes-
sage and holding it in the hand, laying it on a table,
or putting it in another pocket are just a few examples
where correct activity recognition is more difficult.
Another important requirement for HAR is to en-
able the observed subjects to behave as naturally
as possible. This can not be achieved if the com-
plete body is covered with sensors, because this setup
would only work for short term applications as in a
hospital setting, but not for everyday activities. A sys-
tem that addresses these problems and enables high
accuracy HAR directly from the smartphone of the
subject is needed.
1.2 Contribution
In this paper, an activity recognition system is pre-
sented. Its main contribution was the determination
of an optimal minimum smartphone and IMU sensor
setup improving HAR results for basic daily-life ac-
tivities. This work’s concrete contributions are as fol-
lows:
• A dataset of 18 participants performing seven dif-
ferent every-day activities was collected in an ex-
periment (Section 3). To the best of our knowl-
edge, this is the first study combining Bluetooth
sensors with internal smartphone sensors data col-
lection for HAR.
• It was proved that the HAR performance of the
smartphone in the subject’s pocket could be im-
proved by 23% if combined with a body-worn
standalone IMU device. The highest improve-
ments are reached by the ankle and the lower
back. F1-scores of up to 97% are reached using
a Convolutional Neural Network (Section 4.4).
• Also, it was shown that some single IMU place-
ments achieve high recognition precisions (F1-
scores around 87%), making the resulting recog-
nition more independent from the smartphone in
case it produces imprecise data (Section 4.4).
Beginning with an introduction of daily-life activity
recognition in related work by giving an overview of
similar studies and their applied methods (Section 2),
followed by a description of the conducted experi-
ment (Section 3) and its evaluation (Section 4), this
work concludes by discussing future research (Sec-
tion 5).
2 RELATED WORK
2.1 Background
The recognition of daily life human activities is a pop-
ular problem. There are several common approaches
and varying factors such as probed activities and cho-
sen sensor setups. This section provides a review of
methods for HAR with a special focus on daily-life
activity recognition.
2.1.1 Human Activity Recognition Process
A basic Activity Recognition Process (ARP) consists
of five steps. Data is collected from sensor signals.
The acquired data might consist of artifacts arising
from malfunctions, simultaneously occurred physical
activities or electronic fluctuations. Thus, the data is
preprocessed. It is segmented into windows of a spe-
cific length and labeled with the activity that was con-
ducted in this segment. In the next step, every time
window is transformed into a vector of features (De-
hghani et al., 2019). In Feature extraction for HAR, it
is challenging to produce distinguishable features due
to the similarity of activities that might share simi-
lar characteristics (e.g. walking and running) (Chen
et al., 2020). Finally, based on the data and its corre-
sponding labels, a classifier is trained. According to
(Dehghani et al., 2019), Decision Tree, Na
¨
ıve Bayes,
Support vector machine, K-nearest neighbors, Hidden
Markow Models, and ensemble classifiers as Random
Forest are common and preferred classifiers in HAR.
2.1.2 Activities
According to Table 1 and Table 2, activity sets in sim-
ilar studies often include walking, sitting, and stand-
ing, sometimes combined with primary activities as
eating or vacuuming. Some studies investigated even
more complex daily-life activities, for instance, (Atal-
lah et al., 2011) the wiping of tables or (Valarezo
et al., 2017) the folding of laundry.
2.1.3 Inertial Sensors
In (Zhang and Sawchuk, 2012), the accelerome-
ter proved to be the best performing motion sensor
to recognize sitting, walking, climbing upstairs and
SENSORNETS 2021 - 10th International Conference on Sensor Networks
38

Table 1: Related work determined the best sensor positions for specific activities using accelerometers or IMUs.
Activities Best Positions
(Atallah et al., 2011)
lying down wrist
preparing food, eating and drinking, socializing, read-
ing, getting dressed
waist
walking, treadmill walking, vacuuming, wiping tables chest, wrist
running, treadmill running, cycling ear, arm, knee
sitting down and getting up, lying down and getting up waist, chest, knee
(Orha and Oniga, 2014)
standing, sitting, supine, prone, left lateral recum-
bent, right lateral recumbent, walking, running, for-
ward/left/right bending, squats, settlements and lifting
the chair, falls, turn left and right, upstairs, downstairs
right thigh, right hand
(Bao and Intille, 2004)
ambulation, posture thigh, hip, ankle
upper body movements (sitting, reading, watching TV) wrist, arm
total of 20 everyday activities thigh, wrist / hip, wrist
(Mannini et al., 2015) walking ankle, thigh
(Bulling et al., 2014)
opening/closing window, watering plant, reading, drink-
ing a bottle, cutting/chopping with a knife, stirring in a
bowl, forehand, backhand, smash
wrist
downstairs, riding the elevator up and down, and
brushing teeth. To detect falling, the rotation an-
gle retrieved from the gyroscope increases the per-
formance. Therefore, the accelerometer and gyro-
scope improve the reliability of the recognition pro-
cess by complementing each other. The researchers
in (Shoaib et al., 2013) determined that climbing up-
stairs has a high recognition accuracy by a gyroscope
at most positions while for example standing is better
recognized by an accelerometer. They also showed
that the magnetometer has a high dependence on di-
rections and is thus causing over-fitting in training
classifiers (Shoaib et al., 2013).
2.1.4 Sensor Setup
The results of an ARP heavily depend on the cho-
sen sensor placements (Mohamed et al., 2018). An
overview of related work examining best achieving
sensor positions using accelerometers can be found in
Table 1. For basic daily life activities, placements on
the wrist, the knee, the waist, and the thigh seem to
provide high classification accuracy. As for the ref-
erenced studies, a combination of arm and leg covers
most of the activities. As of (Bao and Intille, 2004),
complex activities require at least one sensor on the
upper and one on the lower body.
Typical frequencies for daily activities are for ex-
ample 27 Hz (Orha and Oniga, 2014), 30 Hz (Figueira
et al., 2016), 32 Hz (Bulling et al., 2014), 50 Hz (De-
hghani et al., 2019), or 100 Hz (Gao et al., 2019).
(Mannini et al., 2015) sampled walking data down to
30 Hz and did not see a difference in recognition accu-
racy. In (Ghosh and Riccardi, 2014) the classification
accuracy drops significantly for sampling rates lower
than 10 Hz.
2.1.5 Data Preprocessing
The chosen window can vary in size and can be either
overlapping or non-overlapping. (Dehghani et al.,
2019) found, that when subject-independent cross-
validation is used, the performance of HAR systems
can not be improved by using overlapping sliding
windows instead of non-overlapping windows. The
window size has a significant influence on the accu-
racy of the ARP. To be able to differentiate the ac-
tivity from others, the window should include at least
one instance of the activities’ repeating action such
as taking a step for walking. On the other hand, an
increased window size does not necessarily improve
recognition performance (Janidarmian et al., 2017).
As of (Banos et al., 2014), the most accurate detec-
tion is achieved with short windows of two seconds
or smaller, very short windows (0.25−0.5 s) lead to a
very good recognition performance.
2.2 Overview of Related Work
As already mentioned in Section 1, there have been
a lot of studies regarding HAR. In Table 1, there has
been presented an excerpt of studies investigating op-
timal sensor combinations for accelerometers as well
as IMUs. In the following, a short survey of further
studies dealing with daily-life activity recognition is
given. Table 2 presents a more detailed overview.
A large number of studies aimed to distinguish be-
tween different activities by using one or multiple ac-
Optimal Sensor Placement for Human Activity Recognition with a Minimal Smartphone–IMU Setup
39

Table 2: Overview of HAR studies using accelerometers and HAR studies using IMUs.
Accelerometer Placements
(total number)
Activities
(total number)
Sampling
Rate
Subj. (Best) Method Accur.
(Foerster et al., 1999) sternum, wrist, thigh, lower
leg (5)
sitting, standing, lying, sitting and talking, working at keyboard, walking,
stairs up, stairs down, cycling (9)
16 Hz 24 template
matching
95.8%
(Mantyjarvi et al.,
2001)
3 left hip, 3 right hip (6) walking, upstairs, downstairs, opening doors (4) 256 Hz 6 independent
component
analysis
83% −
90%
(Bao and Intille, 2004) hip, wrist, upper arm, ankle,
thigh (5)
walking, sitting, standing, watching TV, running, stretching, scrubbing,
folding laundry, brushing teeth, riding elevator, riding escalator, climbing
stairs, walking carrying items, working on computer, eating or drinking,
reading, cycling, strength-training, vacuuming, lying down (20)
76.25 Hz 20 decision tree
classifiers
84%
(Tapia et al., 2007) hip, thigh, ankle, upper arm,
wrist (5)
in different variations: lying down, standing, sitting, walking, running,
climbing stairs, cycling, carrying weight, moving weight, and more gym
activities (30)
30 Hz 21 C4.5 classifier 94.9%
(Krishnan and
Panchanathan, 2008)
hip, ankle, thigh (3) walking, sitting, standing, running, cycling, lying, climbing stairs (7) 76.25 Hz 20 AdaBoost 93%
(Bonomi et al., 2009) lower back (1) lying, sitting, working on computer, standing, washing dishes, walking,
downstairs, upstairs, walking outside, running, cycling (11)
20 Hz 20 decision tree
classifiers
93%
(Mannini and
Sabatini, 2010)
hip, wrist, arm, ankle, thigh
(5)
walking, sitting, standing, running, cycling, lying, climbing stairs (7) 76.25 Hz 20 NM classifier 98.5%
(Mannini et al., 2015) ankle, thigh, hip, arm, wrist
(5)
lying, sitting, sorting files on paperwork, cycling, natural walking,
treadmill walking, carrying a load, stairs or elevator, jumping-jacks,
sweeping with a broom, painting with roller/brush (28)
90 Hz 33 cross-validation
with SVM
91.2%
(Janidarmian et al.,
2017)
waist, lower arms, upper
arms, lower legs, upper legs,
chest (10)
combined datasets (70) 8 - 100 Hz 228 principal
component
analysis
96.44% ±
1.62%
IMU Placements
(total number)
Activities
(total number)
Sampling
Rate
Subj. (Best) Method Accur.
(Altun and Barshan,
2010)
chest, arms, legs (5) sitting, standing, lying down on back/right side, upstairs, downstairs,
standing/moving in elevator, walking, walking on treadmill, running on
treadmill, exercise on stepper/cross trainer, cycling, rowing, jumping,
playing basketball (19)
25 Hz 8 BDM
classification
95%
(Zebin et al., 2016) pelvis, thighs, shanks (5) walking, upstairs, downstairs, sitting, standing, lying down (6) 50 Hz 12 Convolutional
Neural Network
97.01%
(Rivera et al., 2017) wrist (1) open door, close door, open fridge, close fridge, clean table, drink from
cup (8)
100 Hz 12 Recurrent
Neural Network
80.09%
(Valarezo et al., 2017) wrist (1) lying, sitting, standing, walking, running, cycling, Nordic walking,
ironing, vacuuming, rope jumping, upstairs, downstairs, optional:
watching TV, computer work, driving car, folding laundry, cleaning
house, playing soccer (12/6)
100 Hz 9 Recurrent
Neural Network
96.95%
SENSORNETS 2021 - 10th International Conference on Sensor Networks
40

celerometers. (Foerster et al., 1999) for example as
one of the earliest works on this topic dealt with 5 ac-
celerometers attached to 24 subjects to recognize pos-
tures and motions by using a hierarchical classifica-
tion model resulting in an accuracy of 95.8%. On only
four basic activities performed by six participants,
(Mantyjarvi et al., 2001) reached an overall recogni-
tion accuracy of 83% − 90%. With 93%, (Bonomi
et al., 2009) accomplished a bit higher recognition
performance on seven more activities and only one ac-
celerometer placed at the lower back. (Bao and Intille,
2004) equipped the body with 5 accelerometers at the
hip, wrist, upper arm, ankle, and thigh to differenti-
ate between 20 activities performed by 20 subjects,
resulting in a similar performance using decision tree
classifiers. From the generated dataset by (Bao and
Intille, 2004), 3 accelerometers have been selected
to recognize seven lower body activities in (Krish-
nan and Panchanathan, 2008). The accuracy reached
93%. (Mannini and Sabatini, 2010) applied several
learning methods on the same dataset excerpt, but
with additional wrist and arm sensor and achieved an
accuracy of 98.5%. In (Janidarmian et al., 2017), sev-
eral datasets have been combined to generate a dataset
consisting of 70 activities performed by 228 subjects,
recorded by 10 accelerometers covering most relevant
body positions. The results are impressive as an accu-
racy of 96.44% ± 1.62% was achieved using a prin-
cipal component analysis.
While the accelerometer provides good results as
seen for the previously introduced studies, IMU sen-
sors also come with an additional gyroscope and mag-
netometer. Instead of single accelerometers, few stud-
ies used an IMU sensor and achieved high recognition
performances. (Altun and Barshan, 2010) retrieved
95% from five IMUs placed at the chest and each leg
and arm. Eight subjects had conducted 19 activities,
including standard activities but also rowing, jump-
ing, and playing basketball. The single IMU setup
on the participant’s wrist was tested by (Rivera et al.,
2017) as well as (Valarezo et al., 2017). Latter re-
trieved 96.95% accuracy on 18 different activities per-
formed by nine subjects. (Zebin et al., 2016) used a
Convolutional Neural Network with an accuracy of
91.01% when recognizing walking, upstairs, down-
stairs, sitting, standing, and lying down composed by
12 subjects from five IMUs.
2.3 Learnings from Related Work
To summarize, there have already been studies inves-
tigating HAR using accelerometers and IMUs, mostly
reaching a recognition accuracy between 80% and
97%. Thus, IMUs seem to be sufficient for recogniz-
ing basic daily-life activities. There were also works
comparing different combinations for specific activi-
ties to find out about optimal sensor positions, sam-
pling rates, and window sizes. It appears that the op-
timal combinations heavily depend on the conducted
activities.
Optimal sensor positions were aimed to be found
in related work for independent accelerometer or IMU
setups, but having the smartphone in the pocket as a
fixed sensor and testing the improvement of a combi-
nation was not considered.
Besides, to provide HAR from IMUs on the body,
a device capable of complex computations and pro-
viding enough storage is required. The data trans-
fer in the above-mentioned studies mostly happened
between the IMUs and a computer to avoid process-
ing and storage restrictions of other devices as smart-
phones. Thus, a computer or even a wire must be
present, which does not allow the natural conduction
of daily activities.
The contribution of this work is to investigate the
influence of different IMU positions for smartphone-
based HAR.
3 EXPERIMENTAL SETUP
3.1 Recording Sequence
Following related work, the most commonly inves-
tigated daily activities were selected: lay, sit, stand,
walk, climb upstairs, climb downstairs, and run.
To collect comparable data, a recording sequence
was created. Every subject performed this sequence at
a stretch with short pauses between the different activ-
ities. The pauses were needed for (1) a more efficient
data segmentation and (2) giving the subjects enough
time to reach the next ”station” (for example the chair
to sit). See Table 3 for the complete sequence. Man-
ual adjustment of the labeled data was not necessary
due to the strict schedule.
The experiment was carried out in the foyer of a
building and the open area in front of it. Sitting, lying,
standing, walking, and running were easy to realize
using chairs, tables, and a mat. For the stair climb-
ing activities, a long staircase consisting of continu-
ous steps was used. The only drawback was a slightly
longer step in the middle. The participants were asked
to take this step with one move.
The study was conducted in accordance with the
latest revision of the declaration of Helsinki (Rick-
ham, 1964). All subjects gave their consent before
participating in the data collection procedures. The
Optimal Sensor Placement for Human Activity Recognition with a Minimal Smartphone–IMU Setup
41
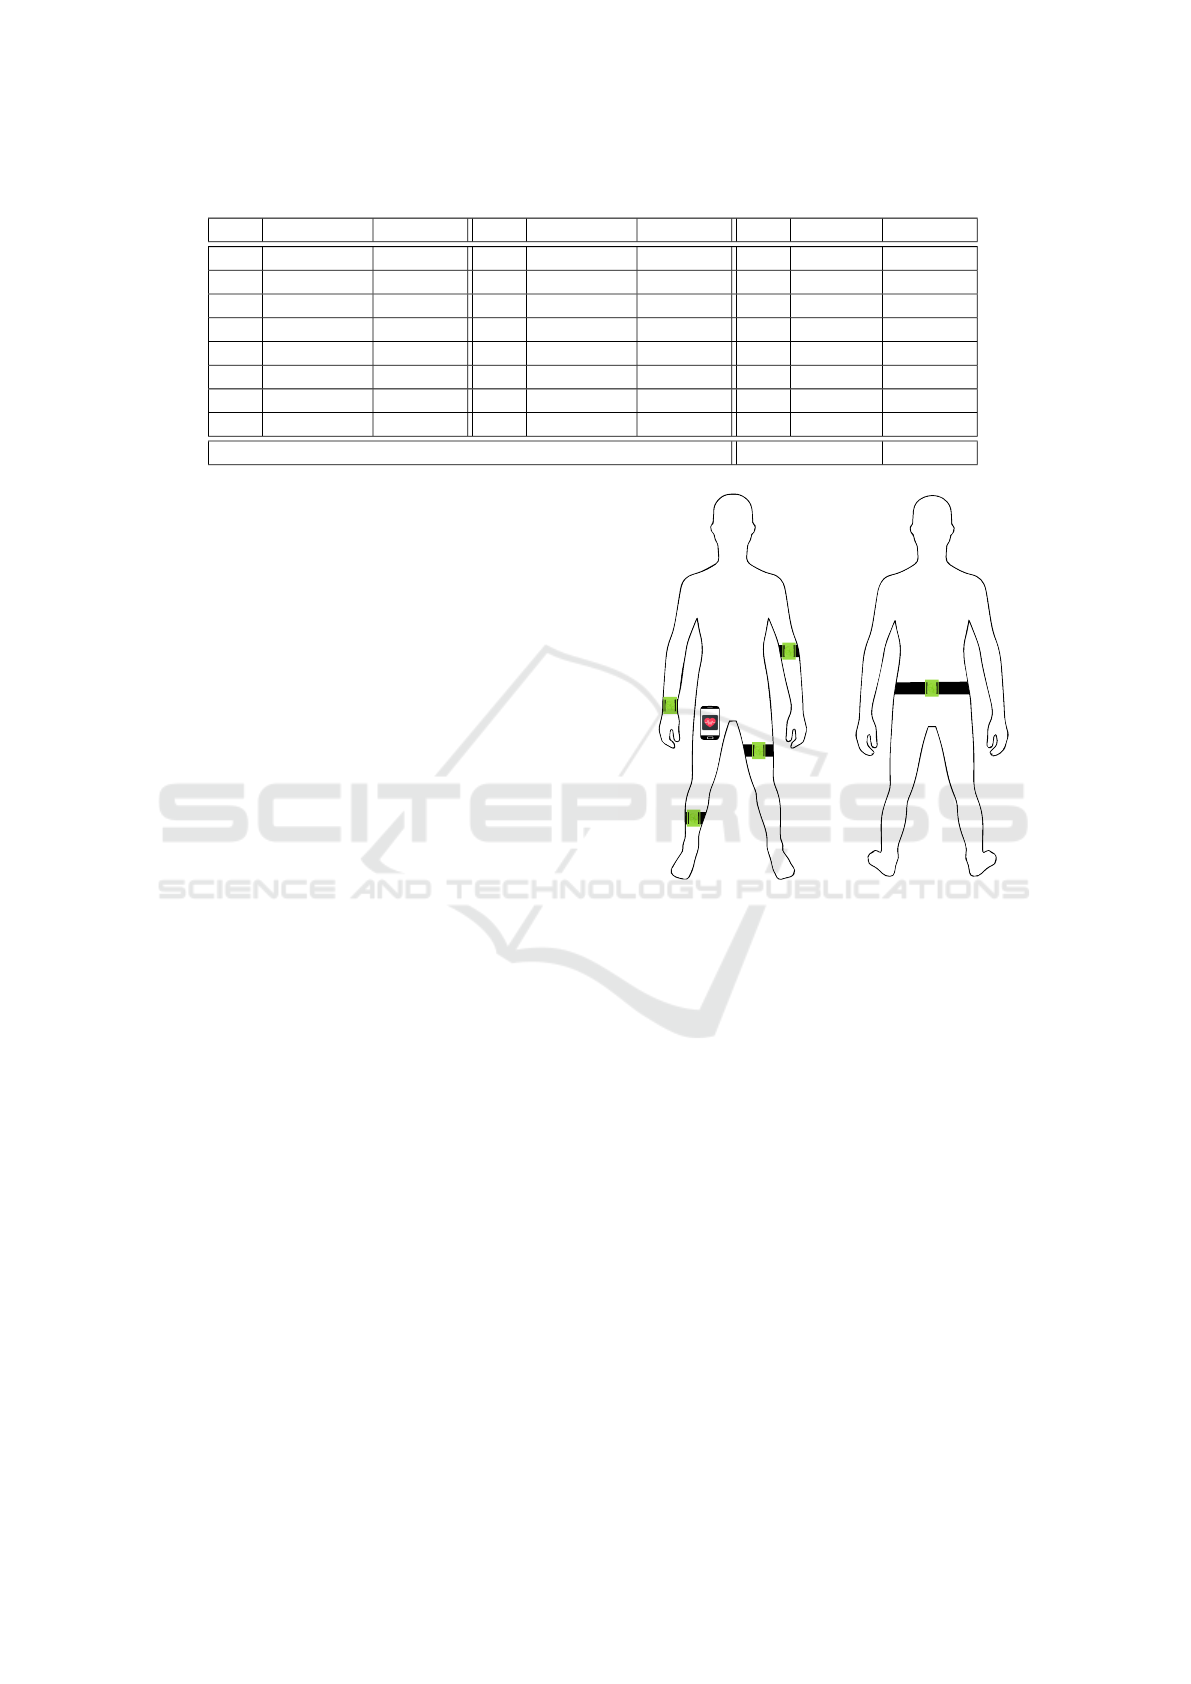
Table 3: Recording sequence, pauses of 10 - 40 seconds between the activities.
No. Activity Time (s) No. Activity Time (s) No. Activity Time (s)
0 walk 20 8 sit 20 16 run 20
1 sit 20 9 walk 20 17 run 20
2 lay 20 10 lay 20 • • •
3 stand 20 11 stand 20 • • •
4 downstairs 10 12 downstairs 10 • • •
5 upstairs 10 13 upstairs 10 • • •
6 downstairs 10 14 downstairs 10 • • •
7 upstairs 10 15 upstairs 10 • • •
Total 280
data collection was supervised by the authors to en-
sure the quality of the data.
3.2 Sensor Setup
A One Plus 6 smartphone (One Plus, China) and five
QuantiMotion IMUs (Bonsai Systems
R
, Switzerland)
were used for data collection in this study. The smart-
phone was placed in the front right pocket of the sub-
jects, where it might be worn in daily situations. The
IMUs have been placed asymmetrically on both body
sides covering the wrist, ankle, upper arm, and upper
leg, the fifth IMU was located at the lower back. As
seen in Section 2.1.4 regarding best achieving sensor
positions in related work, the wrist and thigh provide
high classification accuracy for daily life activities.
Further sensors were added to the ankle, the arm, and
the lower back to cover the rest of the body positions
mostly used in other studies.
Based on preliminary experiments, accelerome-
ter and gyroscope data were recorded at 100 Hz and
downsampled to 80 Hz. Several other sampling rates
were tested in addition, in order to investigate further
the impact of sampling rate on activity recognition ac-
curacy. The acceleration and gyroscope range were
±16 g and ±2000
◦
/s, respectively.
3.3 Recording Tools
A custom Android app was developed for sensor data
collection. The app is capable of recording data from
the internal sensors in the smartphone as well as mul-
tiple external Bluetooth Low Energy (BLE) IMUs.
For the current experimental setup, the app provides
the subject auditory instructions of the pre-defined
recording sequence (e.g., walk, sit, stand), and labels
the recorded data with the activities. Using basic text-
to-speech components, the subject gets told what hap-
pens next, thus can prepare, and start/stop the activ-
ity at the right time. This produces clear separated
data. It was furthermore ensured that if the Bluetooth
Front Back
Figure 1: The five Bonsai IMUs were placed on the left
thigh, right ankle, left arm, right wrist, and lower back. The
smartphone with the recording app (see Section 3.3) was
placed in the right pocket.
connection to the IMUs gets lost, the experiment is
paused and resumed at the moment the connection is
reestablished.
4 EVALUATION
4.1 Dataset
In this experiment, the data was composed of 18 sub-
jects. Seven different activities (lay, sit, stand, walk,
climb upstairs, climb downstairs, and run) were per-
formed while receiving data from the six used sen-
sors (placing see Figure 1). One subject was not able
to climb stairs and run, so only lying, sitting, stand-
ing, and walking was recorded. Overall, 720 seconds
duration for lying, sitting, standing and walking, and
680 seconds for stair climbing were recorded.
The dataset was split into train, validation, and test
SENSORNETS 2021 - 10th International Conference on Sensor Networks
42
0 2 4
6
8 10
time (s)
−20
−10
0
acceleration (m/s
2
)
(a) Raw Data
0 2 4
6
8 10
time (s)
−20
−10
0
(b) Resampled Data (80 Hz)
0 2 4
6
8 10
time (s)
−15
−10
−5
0
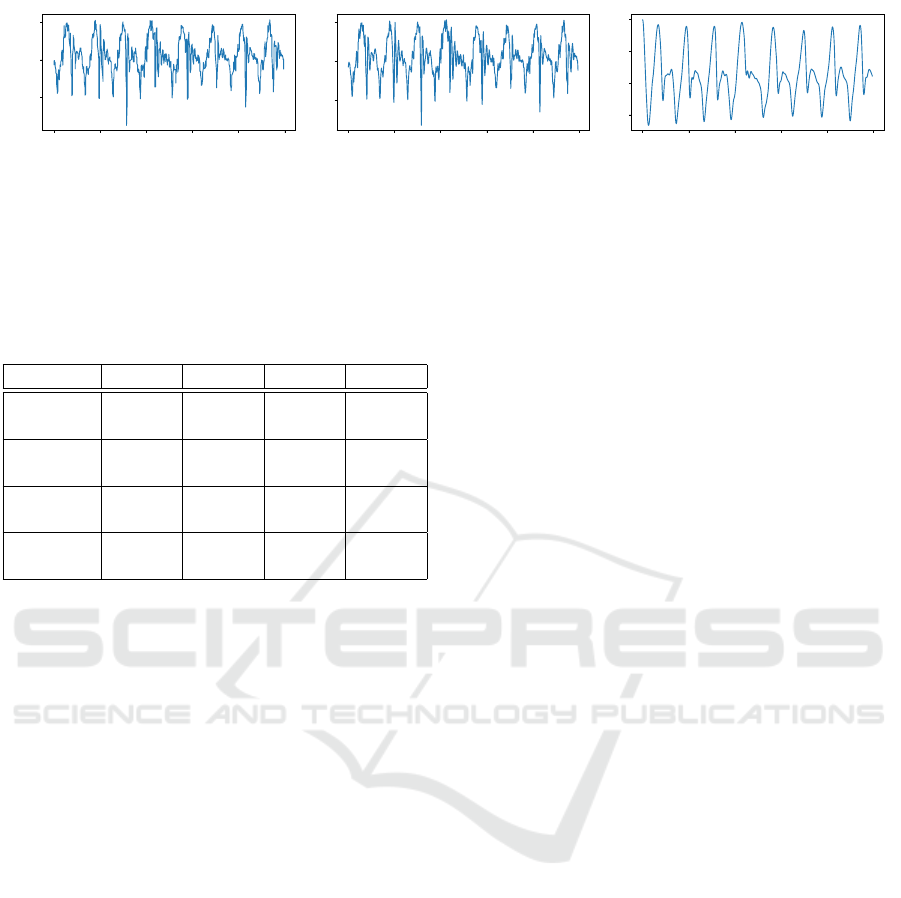
(c) Filtered Data
Figure 2: Preprocessing of acceleration data along the x-axis shown on an example upstairs activity recorded at the left thigh.
data. Different subjects were randomly selected for
each of these groups. See Table 4 for the distribution.
Table 4: Subjects’ characteristics. Data is presented as
mean ± standard derivation.
All Train Valid. Test
Count 18 9 3 6
(f/m) (4/14) (2/7) (1/2) (1/5)
Age 21.89 22.56 20.67 21.5
± 3.59 ± 4.92 ± 0.47 ± 0.76
Weight 69.11 71.22 66.67 67.17
(kg) ± 7.64 ± 8.8 ± 2.36 ± 6.54
Height 1.77 1.77 1.76 1.77
(m) ± 0.06 ± 0.05 ± 0.03 ± 0.08
4.2 Preprocessing and Segmentation
The raw acceleration and gyroscope data received
from the devices were downsampled to the defined
sampling rate of 80 Hz and filtered through a Butter-
worth low-pass filter to remove high-frequency noise.
This filter attenuates higher frequency components of
the signal beyond a configurable cut-off frequency
(Butterworth, 1930). (Wang et al., 2011) proposed for
the processing of body sensor networks a 3rd order
Butterworth low-pass filter with a cut-off frequency
of 4 Hz. The same filter specification has been applied
in this experiment. An example sequence of a random
subject climbing upstairs and the three preprocessing
stages are shown in Figure 2.
In related work, a window length between 0.25
and 0.5 seconds was proposed. Thus, the filtered data
was segmented into non-overlapping windows with a
size of 0.5 s.
4.3 Classification
Previous works successfully used machine learning
methods for HAR (Chen et al., 2020). In two of the
latest studies, Convolutional Neural Networks (CNN)
were selected as the method achieving the highest
recognition precision (Ignatov, 2018; Yang et al.,
2015). (Zebin et al., 2016) conducted a very similar
experiment to the one in this paper but only using a
fixed set of body-worn inertial sensors. They aimed to
distinguish between the same activities as in this work
except for running. By using a CNN, they reached a
recognition accuracy of 97.01%. Thus, a CNN was
composed to recognize the activities in this experi-
ment. CNNs are inspired by the biological visual sys-
tem, they provide a hierarchical feed-forward neural
network. A CNN has convolutional layers to learn fil-
ters sliding along the input data (Ignatov, 2018) in ad-
dition to fully-connected layers of the original neural
networks. The convolution and sampling layers work
as feature extractors in the ARP (Almaslukh et al.,
2018).
The CNNs for this study consist of three convo-
lutional, three pooling, and one fully connected layer.
(Ignatov, 2018) for example used 1 × 16 filters, while
in our study, three 1 × 2 convolution layers separated
by pooling layers have been tested to achieve similar
results but increase the training velocity. The num-
ber of channels depends on the number of IMUs an-
alyzed. Each IMU brings six channels (acceleration
and gyroscope in all three axes). For example, if the
combination of smartphone and the IMU at the right
wrist is investigated, this results in twelve channels
(see Figure 3 for the CNN architecture). Based on
the amount of sensor combinations tested, there have
been trained twelve CNNs. A batch size of 50 and
a learning rate of 0.001 were chosen for training the
network in 200 epochs.
4.4 Results
The main goal of this work was to determine the im-
pact of different IMU combinations and finding the
optimal minimal setup. Thus, single IMU setups and
combinations of the smartphone and an additional
IMU were investigated. An overview of all possi-
ble combinations tested and their results are plotted
in Figure 4.
This results show that regarding combinations of
the smartphone and an additional IMU, combinations
of the smartphone in the right pocket and the IMUs
at the right ankle and the lower back provide promis-
Optimal Sensor Placement for Human Activity Recognition with a Minimal Smartphone–IMU Setup
43
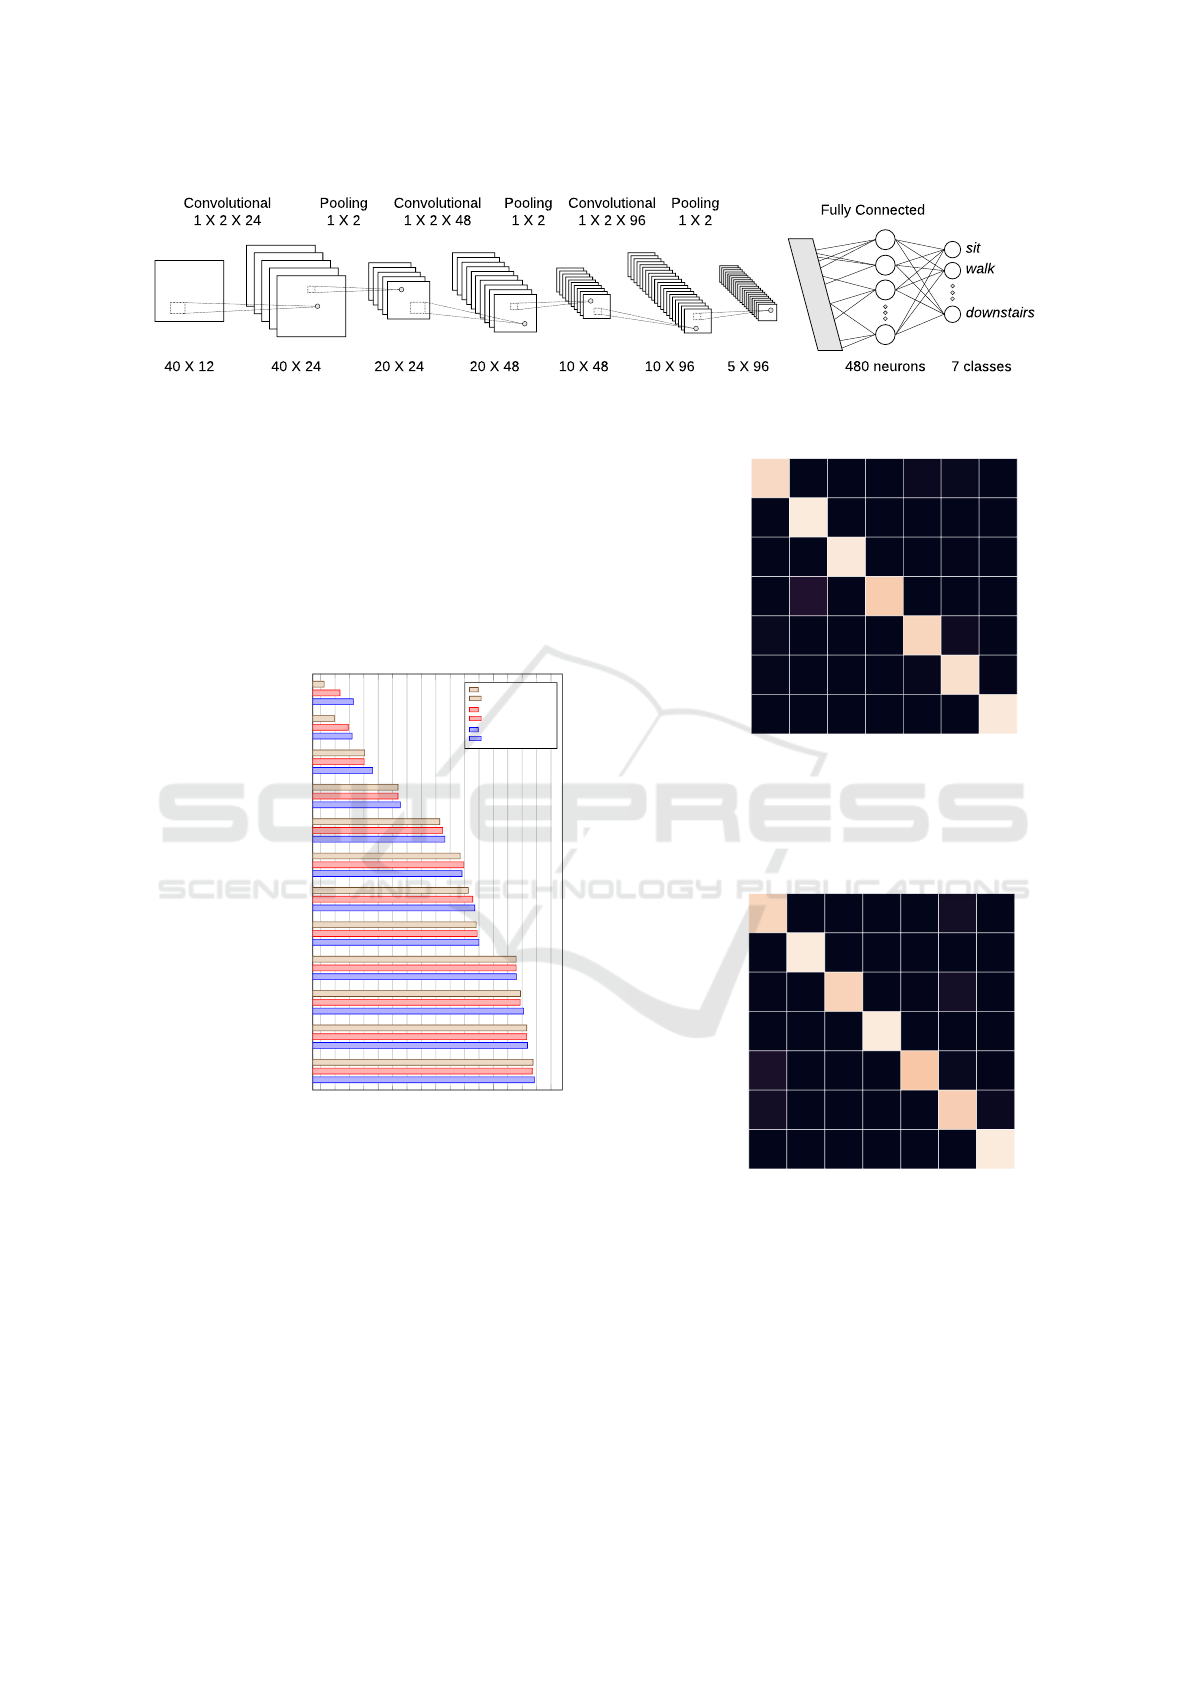
Figure 3: CNN architecture for classification of data from two IMUs.
ing F1-scores of approximately 97% and 96%. As
shown in the confusion matrices in Figure 5, the ap-
plied classifier had for both most problems recogniz-
ing the stairs and walking activities, and for the right
ankle also with lying while for the lower back the
prediction of standing was wrong a few more times.
Both classified sitting always correct, but sometimes
the classifier on the right ankle combination confused
laying and climbing downstairs as sitting.
60
70 80 90 100
Pocket + Right ankle
Pocket + Lower back
All
Pocket + Left arm
Lower back
Left arm
Right ankle
Pocket + Right wrist
Pocket
Pocket + Left thigh
Left thigh
Right wrist
F1-score
Recall
Precision
Figure 4: Recognition performance for the different sensor
combinations. Pocket describes the smartphone in the right
pocket.
Furthermore, the combination of the pocket and
the left arm produces a high F1-score of 94%. For this
combination, walking and the stairs activities were
miss-classified by more than 10%, but the remaining
activities were recognized nearly correctly. The other
smartphone and IMU combinations have most diffi-
culties recognizing sitting, lying, and walking. Stand-
ing, the stair climbing activities and running achieve
high performance. They all score lower than 81%.
In comparison to the remaining activities, walking
Walk
Sit
Stand
Lay
Upstairs
Downstairs
Run
Predicted activity
Walk
Sit
Stand
Lay
Upstairs
Downstairs
Run
Actual activity
95.28
0 0 0 2.36
2.1
0.26
0 100 0 0 0 0 0
0 0
99.25
0 0.25 0.5 0
0 8.27 0
91.73
0 0 0
2
0 0.25 0
94.5
3.25 0
1
0.25 0 0 1.25
97
0.5
0 0 0.25 0 0 0.25
99.5
(a) Pocket and right ankle
Walk
Sit
Stand
Lay
Upstairs
Downstairs
Run
Predicted activity
Walk
Sit
Stand
Lay
Upstairs
Downstairs
Run
Actual activity
94.49
0 0.26 0 0.26
4.99
0
0 100 0 0 0 0 0
0.5 0
93.5
0 0.75 5.25 0
0 0 0 100 0 0 0
7
0 0 0
90.25
2.25 0.5
4.75 0 0 0 0.25
92.5
2.5
0 0 0 0 0.25 0
99.75
(b) Pocket and lower back
Figure 5: Confusion matrices of IMU combinations with
the highest performance.
and the stairs activities were predicted wrong more
often. This might be related to the similarity of the
three activities. Maybe also the long step in the mid-
SENSORNETS 2021 - 10th International Conference on Sensor Networks
44
dle of the stairs caused the subjects to walk similar to
normal walking for a short time because they had to
make a big step.
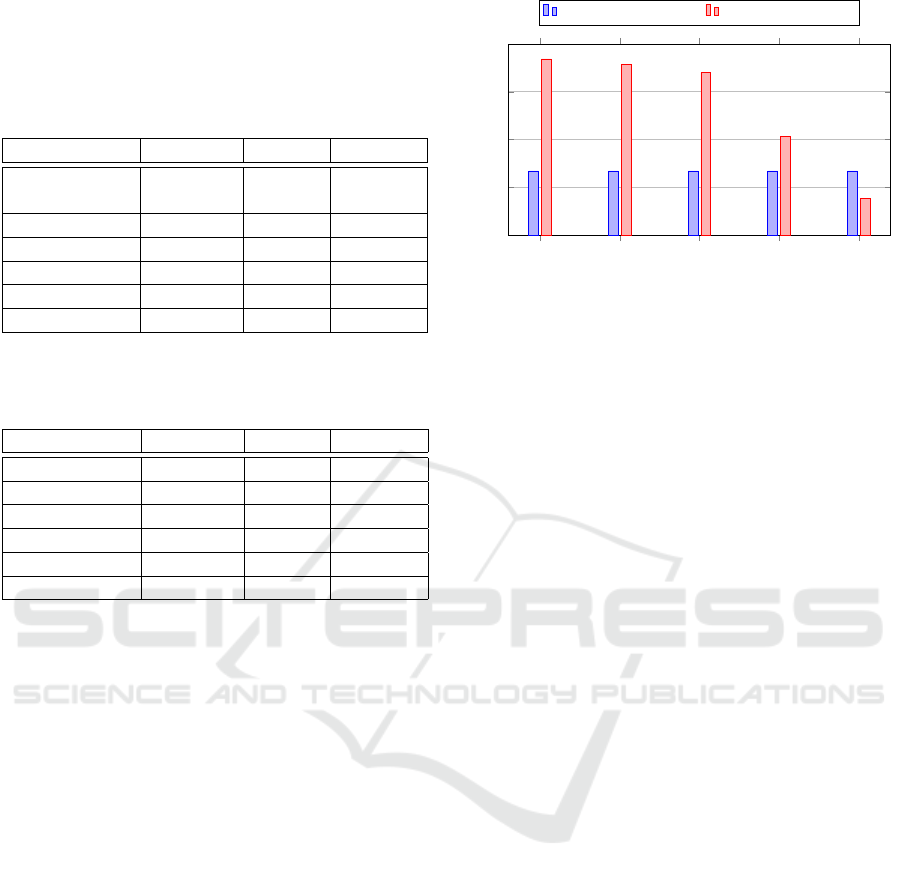
Table 5: CNN classification performance of the different
single IMUs.
Position Precision Recall F1-score
Right pocket
(Smartphone)
73.85% 73.42% 73.43%
Left thigh 65.46% 64.79% 62.44%
Right ankle 84.55% 84.86% 84.22%
Left arm 86.76% 86.42% 85.65%
Right wrist 65.67 % 63.36% 60.59%
Lower back 87.48% 87.18% 87.00%
Table 6: CNN classification performance from the combi-
nations of the smartphone in the right pocket with another
IMU sensor.
Sensor added Precision Recall F1-score
- 73.85% 73.42% 73.43%
Left thigh 69.01% 67.56% 67.64%
Right ankle 97.11% 96.75% 96.89%
Left arm 93.99% 93.95% 93.96%
Right wrist 81.56% 81.18% 80.69%
Lower back 95.93% 95.78% 95.79%
In Table 5, the results of single sensor setups are
presented. Also as such a single sensor setup, the
IMUs at the lower back and the right ankle reach
the highest recognition performances with 87% and
84.22%, respectively. The smartphone in the right
pocket as a single IMU results in a F1-score of
73.43%. The achieved improvements by combining
the smartphone with IMUs are shown in Figure 6.
Merged with the body-worn standalone IMU devices,
gains of up to 23.46% are reached with the best com-
binations as presented above. The worst combination
is the addition of the IMU at the left thigh which re-
sults in the score to decrease by nearly 6%. This
might be caused by both sensors being at similar posi-
tions (the smartphone in the right pocket and the IMU
at the left upper leg) and them producing redundant
information as well as missing upper body details.
With lower sampling rates, the recording IMU de-
vices would consume less energy, however, less in-
formation may be preserved. With various window
sizes, the classification performance could fluctuate
drastically. To test the robustness of the classification
results in terms of energy consumption and perfor-
mance, the impacts of lower sampling rates and other
window sizes were analyzed. The dataset was down-
sampled to different sampling rates, segmented in dif-
ferent window sizes, and fed into the CNN. The sam-
Right ankle
Lower back
Left arm
Right wrist
Left thigh
60
70
80
90
100
F1-score smartphone F1-score combined
Figure 6: Recognition improvement if the smartphone is
combined with each body-worn standalone IMU device.
pling rate appears to make no significant difference
regarding the resulting test performance, but a drop
of 5% at most can be noticed comparing the results
from 80 Hz to those from 10 Hz sampled data. Lower
sampling rates still provide sufficient results, but ac-
curacy is significantly lost at frequencies lower than
6 Hz as already investigated by (Klieme et al., 2018).
It can be seen that different window sizes also do not
make a big change regarding the achieved scores, as
long as they do not exceed 2 s and do not fall below
0.25 s. The 0.25−0.5 s that have been proposed by
(Banos et al., 2014) also achieve high F1-scores for
our dataset, but for this experiment, high recognition
performance is also received for windows of 2 s.
The processed data was recorded in a laboratory
setting. (Foerster et al., 1999) showed, that an ac-
curacy of 95.6% for ambulation activities performed
in controlled data collection environments could be
reached. But the accuracy decreased to 66% when
instead using naturally recorded data. The high per-
formance of the processed data in this study could
hence be strongly related to its controlled genera-
tion. Regarding the recorded subjects, it is also es-
sential to notice that apart from the one person men-
tioned above, those were all participants with unre-
stricted mobility between 19 and 36 years. Hence
the achieved results might be invalid for other groups
as for people with health impairments or elderly pa-
tients. There have also been some difficulties while
recording. BLE in combination with the Bonsai IMUs
sometimes caused disconnections and forced the ex-
periment to be re-started. This interruption of the
recording protocol might have falsified the results.
Optimal Sensor Placement for Human Activity Recognition with a Minimal Smartphone–IMU Setup
45

5 CONCLUSIONS
Based on an experiment with 18 subjects, it was
shown that an additional Bluetooth IMU sensor ar-
rangement can improve the robustness of smartphone-
based HAR for daily-life activities. Basic activities
can be recognized with a high accuracy depending
on the chosen sensor placements. The used CNN
reached a high F1-score of 96.89% for a combination
of the smartphone in the pocket and an IMU on the
right ankle. Furthermore, combining an IMU on the
lower back with the smartphone resulted in a score of
95.79% and the combination of the smartphone and
the left upper arm in a score of 93.96%. Thus, similar
results are achieved compared to related work such
as the work by (Zebin et al., 2016). They reached
97.01% using five IMUs combined on six basic ev-
eryday activities using a CNN. Overall, recognition
improvements of up to 23% are possible when comb-
ing the smartphone in the pocket with a single IMU
sensor at the body compared to when the smartphone
was processed exclusively. In addition, it was proven
that high sampling rates are not required for the activ-
ities in this experiment just as large windows sizes.
A possible future study could (1) discover how the
smartphone sensors can be ignored in case the smart-
phone is not worn in the pocket. One of the primary
motivation for the study in this work has been the un-
certainty of smartphone positions in the daily life of
people. The achieved results could be used to record
a dataset with the smartphone on multiple positions
where it might be worn with additional IMUs at one
(or both) of the identified sensor positions with the
best improvement of recognition performance. The
goal of the study could then be to always provide a
high precision rate by ignoring the smartphone if its
placement does provide irrelevant or even misleading
information. With the Body Location Independent Ac-
tivity Monitoring, there also already exist approaches
trying to solve the problem of different sensor posi-
tions with promising results (Figueira et al., 2016).
To consider the obtained results as valid, (2) fur-
ther activities (such as bicycling) should be investi-
gated. The conducted activities in this study involved
either no or a lot of movements in the lower body.
That could explain the high performance of the an-
kle position. Maybe other activities with predominant
movements in the upper body can be recognized bet-
ter using for example the wrist position. Also, (3)
more subjects from other groups (such as elderly or
people with restricted mobility) should be added to
the dataset.
The current study only investigated one classifier
with a set of optimized hyperparameters. Despite the
high performance of the current model, it would be
worthwhile to (4) explore effects of different classi-
fiers and more extensive hyperparameter tuning.
The aim of this work was to test different sensor
placements, but for more intuitive usability (5) a real-
time activity recognition as e.g. in (Andreu et al.,
2011) would be an important step to make real use
out of HAR for medical problems.
ACKNOWLEDGEMENTS
The authors would like to thank all volunteers who
participated in the experiment and made it possible in
the first place. This research has been partly funded
by the Federal Ministry of Education and Research of
Germany in the framework of KI-LAB-ITSE (project
number 01IS19066).
REFERENCES
Ahmad, N., Raja Ghazilla, R. A., Khairi, N., and Kasi, V.
(2013). Reviews on various inertial measurement unit
(imu) sensor applications. International Journal of
Signal Processing Systems, 1(2):256–262.
Almaslukh, B., Artoli, A. M., and Al-Muhtadi, J.
(2018). A robust deep learning approach for position-
independent smartphone-based human activity recog-
nition. Sensors (Basel, Switzerland), 18(11).
Altun, K. and Barshan, B. (2010). Human activity recog-
nition using inertial/magnetic sensor units. In Salah,
A. A., Gevers, T., Sebe, N., and Vinciarelli, A., ed-
itors, Human Behavior Understanding, pages 38–51,
Berlin, Heidelberg. Springer Berlin Heidelberg.
Andreu, J., Baruah, R. D., and Angelov, P. (2011). Real
time recognition of human activities from wearable
sensors by evolving classifiers. In 2011 IEEE Inter-
national Conference on Fuzzy Systems, pages 2786–
2793. IEEE.
Atallah, L., Lo, B., King, R., and Guang-Zhong, Y. (2011).
Sensor positioning for activity recognition using wear-
able accelerometers. IEEE transactions on biomedical
circuits and systems, 5(4):320–329.
Banos, O., Galvez, J.-M., Damas, M., Pomares, H., and Ro-
jas, I. (2014). Window size impact in human activity
recognition. Sensors, 14(4):6474–6499.
Bao, L. and Intille, S. S. (2004). Activity recognition
from user-annotated acceleration data. In Interna-
tional conference on pervasive computing, pages 1–
17. Springer.
Bayat, A., Pomplun, M., and Tran, D. A. (2014). A study
on human activity recognition using accelerometer
data from smartphones. Procedia Computer Science,
34:450–457.
Bonomi, A. G., Goris, A. H. C., Yin, B., and West-
erterp, K. R. (2009). Detection of type, duration,
SENSORNETS 2021 - 10th International Conference on Sensor Networks
46

and intensity of physical activity using an accelerom-
eter. Medicine & Science in Sports & Exercise,
41(9):1770–1777.
Bulling, A., Blanke, U., and Schiele, B. (2014). A tuto-
rial on human activity recognition using body-worn
inertial sensors. ACM Computing Surveys (CSUR),
46(3):1–33.
Butterworth, S. (1930). On the theory of filter amplifiers. In
Wireless Engineer (also called Experimental Wireless
and the Wireless Engineer).
Chen, K., Zhang, D., Yao, L., Guo, B., Yu, Z., and Liu, Y.
(2020). Deep learning for sensor-based human activ-
ity recognition: Overview, challenges and opportuni-
ties. arXiv preprint arXiv:2001.07416.
Chen, Y., Wang, J., Huang, M., and Yu, H. (2019). Cross-
position activity recognition with stratified transfer
learning. Pervasive and Mobile Computing, 57:1–13.
Dehghani, A., Sarbishei, O., Glatard, T., and Shihab, E.
(2019). A quantitative comparison of overlapping
and non-overlapping sliding windows for human ac-
tivity recognition using inertial sensors. Sensors,
19(22):5026.
Figueira, C., Matias, R., and Gamboa, H. (2016). Body lo-
cation independent activity monitoring. In Bahr, A.,
Abu Saleh, L., Schr
¨
oder, D., and Krautschneider, W.,
editors, Integrated 16-Channel Neural Recording Cir-
cuit with SPI Interface and Error Correction Code in
130 nm CMOS Technology, pages 190–197, Hamburg
and Set
´
ubal. Technische Universit
¨
at Hamburg Uni-
versit
¨
atsbibliothek and SCITEPRESS - Science and
Technology Publications Lda.
Foerster, F., Smeja, M., and Fahrenberg, J. (1999). Detec-
tion of posture and motion by accelerometry: A vali-
dation study in ambulatory monitoring. Computers in
Human Behavior, 15(5):571–583.
Gao, X., Luo, H., Wang, Q., Zhao, F., Ye, L., and Zhang, Y.
(2019). A human activity recognition algorithm based
on stacking denoising autoencoder and lightgbm. Sen-
sors (Basel, Switzerland), 19(4).
Ghosh, A. and Riccardi, G. (2014). Recognizing human
activities from smartphone sensor signals. In Hua,
K. A., editor, Proceedings of the 2014 ACM Confer-
ence on Multimedia, November 3 - 7, 2014, Orlando,
FL, USA, pages 865–868, New York, NY. ACM.
Huynh, D. T. G. (2008). Human Activity Recognition with
Wearable Sensors. PhD thesis, Technische Universit
¨
at
Darmstadt.
Ignatov, A. (2018). Real-time human activity recognition
from accelerometer data using convolutional neural
networks. Applied Soft Computing, 62:915–922.
Janidarmian, M., Roshan Fekr, A., Radecka, K., and Zilic,
Z. (2017). A comprehensive analysis on wearable ac-
celeration sensors in human activity recognition. Sen-
sors (Basel, Switzerland), 17(3).
Khan, A. M., Lee, Y.-K., Lee, S. Y., and Kim, T.-
S. (2010). A triaxial accelerometer-based physical-
activity recognition via augmented-signal features and
a hierarchical recognizer. IEEE transactions on infor-
mation technology in biomedicine : a publication of
the IEEE Engineering in Medicine and Biology Soci-
ety, 14(5):1166–1172.
Klieme, E., Tietz, C., and Meinel, C. (2018). Beware of
smombies: Verification of users based on activities
while walking. In 2018 17th IEEE International Con-
ference On Trust, Security And Privacy In Computing
And Communications/12th IEEE International Con-
ference On Big Data Science And Engineering (Trust-
Com/BigDataSE), pages 651–660. IEEE.
Krishnan, N. C. and Panchanathan, S. (2008). Analysis of
low resolution accelerometer data for continuous hu-
man activity recognition. In 2008 IEEE International
Conference on Acoustics, Speech and Signal Process-
ing, pages 3337–3340. IEEE.
Mannini, A. and Sabatini, A. M. (2010). Machine learning
methods for classifying human physical activity from
on-body accelerometers. Sensors, 10(2):1154–1175.
Mannini, A., Sabatini, A. M., and Intille, S. S. (2015).
Accelerometry-based recognition of the placement
sites of a wearable sensor. Pervasive and Mobile Com-
puting, 21:62–74.
Mantyjarvi, J., Himberg, J., and Seppanen, T. (2001). Rec-
ognizing human motion with multiple acceleration
sensors. In 2001 IEEE International Conference on
Systems, Man and Cybernetics. e-Systems and e-Man
for Cybernetics in Cyberspace (Cat. No. 01CH37236),
volume 2, pages 747–752. IEEE.
Mohamed, R., Zainudin, M. N. S., Sulaiman, M. N., Peru-
mal, T., and Mustapha, N. (2018). Multi-label classi-
fication for physical activity recognition from various
accelerometer sensor positions. Journal of Informa-
tion and Communication Technology, 17(2):209–231.
Orha, I. and Oniga, S. (2014). Study regarding the opti-
mal sensors placement on the body for human activity
recognition. In 2014 IEEE 20th International Sympo-
sium for Design and Technology in Electronic Pack-
aging (SIITME), pages 203–206. IEEE.
Rickham, P. P. (1964). Human experimentation. code of
ethics of the world medical association. declaration of
helsinki. British medical journal, 2(5402):177.
Rivera, P., Valerezo, E., Choi, M.-T., and Kim, T.-S. (2017).
Recognition of human hand activities based on a sin-
gle wrist imu using recurrent neural networks. Inter-
national Journal of Pharma Medicine and Biological
Sciences, 6(4).
Shoaib, M., Scholten, H., and Havinga, P. (2013). To-
wards physical activity recognition using smartphone
sensors. In Ubiquitous Intelligence and Computing,
2013 IEEE 10th International Conference on and 10th
International Conference on Autonomic and Trusted
Computing (UIC/ATC), pages 80–87. IEEE.
Su, X., Tong, H., and Ji, P. (2014). Activity recognition
with smartphone sensors. Tsinghua Science and Tech-
nology, 19(3):235–249.
Tapia, E. M., Intille, S. S., Haskell, W., Larson, K., Wright,
J., King, A., and Friedman, R. (2007). Real-time
recognition of physical activities and their intensities
using wireless accelerometers and a heart rate moni-
tor. In 2007 11th IEEE international symposium on
wearable computers, pages 37–40. IEEE.
Optimal Sensor Placement for Human Activity Recognition with a Minimal Smartphone–IMU Setup
47

Valarezo, E., Rivera, P., Park, J. M., Gi, G., Kim, T. Y., Al-
Antari, M. A., Al-Masni, M., and Kim, T. S. (2017).
Human activity recognition using a single wrist imu
sensor via deep learning convolutional and recurrent
neural nets. UNIKOM Journal of ICT, Design, Engi-
neering and Technological Science1, 1:1–5.
Wang, W.-z., Guo, Y.-w., Huang, B.-y., Zhao, G.-r., Liu, B.-
q., and Wang, L. (2011). Analysis of filtering meth-
ods for 3d acceleration signals in body sensor net-
work. In International Symposium on Bioelectronics
and Bioinformations 2011, pages 263–266.
Yang, J., Nguyen, M. N., San, P. P., Li, X. L., and Krish-
naswamy, S. (2015). Deep convolutional neural net-
works on multichannel time series for human activ-
ity recognition. In Twenty-Fourth International Joint
Conference on Artificial Intelligence.
Zebin, T., Scully, P. J., and Ozanyan, K. B. (2016). Human
activity recognition with inertial sensors using a deep
learning approach. In 2016 IEEE SENSORS, pages
1–3. IEEE.
Zhang, M. and Sawchuk, A. A. (2012). Usc-had: A daily
activity dataset for ubiquitous activity recognition us-
ing wearable sensors. In Proceedings of the 2012
ACM Conference on Ubiquitous Computing, pages
1036–1043.
Zhou, L., Fischer, E., Tunca, C., Brahms, C. M., Ersoy, C.,
Granacher, U., and Arnrich, B. (2020). How we found
our imu: Guidelines to imu selection and a compar-
ison of seven imus for pervasive healthcare applica-
tions. Sensors, 20(15):4090.
Zhu, C. and Sheng, W. (2009). Human daily activity recog-
nition in robot-assisted living using multi-sensor fu-
sion. In IEEE International Conference on Robotics
and Automation, 2009, pages 2154–2159, Piscataway,
NJ. IEEE.
SENSORNETS 2021 - 10th International Conference on Sensor Networks
48
