
HNAS: Hyper Neural Architecture Search for Image Segmentation
Yassir Houreh
1 a
, Mahsa Mahdinejad
1,2 b
, Enrique Naredo
1,2 c
, Douglas Mota Dias
1,2,3 d
and Conor Ryan
1,2 e
1
University of Limerick, Castletroy, Limerick, Ireland
2
Lero – Science Foundation Ireland Research Centre for Software, Ireland
3
UERJ – Rio de Janeiro State University, Brazil
Keywords:
Neural Architecture Search, Image Segmentation, U-Net.
Abstract:
Deep learning is a well suited approach to successfully address image processing and there are several Neural
Networks architectures proposed on this research field, one interesting example is the U-net architecture and
and its variants. This work proposes to automatically find the best architecture combination from a set of the
current most relevant U-net architectures by using a genetic algorithm (GA) applied to solve the Retinal Blood
Vessel Segmentation (RVS), which it is relevant to diagnose and cure blindness in diabetes patients. Interest-
ingly, the experimental results show that avoiding human-bias in the design, GA finds novel combinations of
U-net architectures, which at first sight seems to be complex but it turns out to be smaller, reaching competitive
performance than the manually designed architectures and reducing considerably the computational effort to
evolve them.
1 INTRODUCTION
Applications of artificial neural networks (ANNs) are
nowadays increasing and covering a wide range of im-
age related problem domains (Geng and Wang, 2020;
Isensee et al., 2019). Particularly, deep neural net-
works are currently state-of-the-art machine learning
systems.
Despite the success of deep learning systems, their
applicability to specific image analysis problems of
end-users is often limited. Two main issues related
to the design of these systems are the computational
cost and the expert knowledge required. The perfor-
mance reached for these systems is at the cost of us-
ing highly complex models and increasing the GPU
power, making them computationally costly. Further-
more, deep learning systems are commonly manually
designed by experience based on past designs.
In this study, we propose to automatically search
neural architectures through an evolutionary algo-
rithm, specifically using a genetic algorithm (GA)
a
https://orcid.org/0000-0002-3451-8583
b
https://orcid.org/0000-0003-4288-3991
c
https://orcid.org/0000-0001-9818-911X
d
https://orcid.org/0000-0002-1783-6352
e
https://orcid.org/0000-0002-7002-5815
applied to solve a retinal blood vessel segmentation
problem. As a baseline for the search space we use the
state-of-the-art convolutional neural network (CNN),
called U-net (Ronneberger et al., 2015a), well known
to get good results on image segmentation problems.
In the evolutionary process, we allow GA to (i) add a
convolutional long short-term memory (ConvLSTM)
cell (Xingjian et al., 2015), (ii) to add a residual (skip)
connection on layer neighbors, or even to (iii) remove
batch normalization (BN) from the architecture.
The original version of U-net is explained in more
detail in Section 2, already uses residual connections
to concatenate early to later layers. We are extend-
ing this functionality applied now to the layers in the
same block. We explore the choice of adding a Con-
vLSTM memory cell in one or more blocks of the
original U-net architecture. Furthermore, we add a bi-
nary choice to either use or not BN in the architecture
design, to experimentally find out if the resulting U-
net decreases its performance without this functional-
ity.
This approach increases the degree of freedom of
the neural architecture search and paves the road to
go in the right direction to smartly get a hyper neural
architecture.
For convenient comparative analysis, we focused
first on manually design architectures. We then use an
246
Houreh, Y., Mahdinejad, M., Naredo, E., Dias, D. and Ryan, C.
HNAS: Hyper Neural Architecture Search for Image Segmentation.
DOI: 10.5220/0010260902460256
In Proceedings of the 13th International Conference on Agents and Artificial Intelligence (ICAART 2021) - Volume 2, pages 246-256
ISBN: 978-989-758-484-8
Copyright
c
2021 by SCITEPRESS – Science and Technology Publications, Lda. All rights reserved
evolutionary approach to automatically find the best
combination of architectures, specifically we use a
GA approach to optimize the U-net architecture.
Our experimental results show that GA success-
fully find U-net architectures, which reach compet-
itive performance against the manually U-net archi-
tecture designs. Furthermore, the automated design
approach using GA finds smaller and less complex
U-net architectures, reducing the computational effort
without compromising their performance.
The remainder of this paper is as follows: Sec-
tion 2 explains the U-net architecture and presents the
three functionalities used to get novel architecture de-
signs, namely ConvLSTM, residual connections, and
BN. In Section 3, we present a summary of the ar-
chitecture search approach, and in Section 4 we in-
troduce our proposed approach. Section 5 introduce
the retina blood vessel segmentation problem and the
dataset used in this work. Section 6 describes the ex-
perimental setup, then Section 7 shows and discusses
the experimental results, and at the end, Section 8
gives the conclusions and outlines the future work.
2 NEURAL ARCHITECTURE
Deep learning (DL) is an important part of the wider
field of machine learning, it is concerned in general
with artificial neural networks, but particularly with
those which use multiple layers in the network.
Among the current state-of-the-art neural net-
works, one of the best architectures to address an
image segmentation problem is U-net (Ronneberger
et al., 2015a). U-net is a type of fully convolutional
neural network (FCN) (Ronneberger et al., 2015a),
and according to their inventors, “it is a network and
training strategy that relies on the strong use of data
augmentation to use the available annotated samples
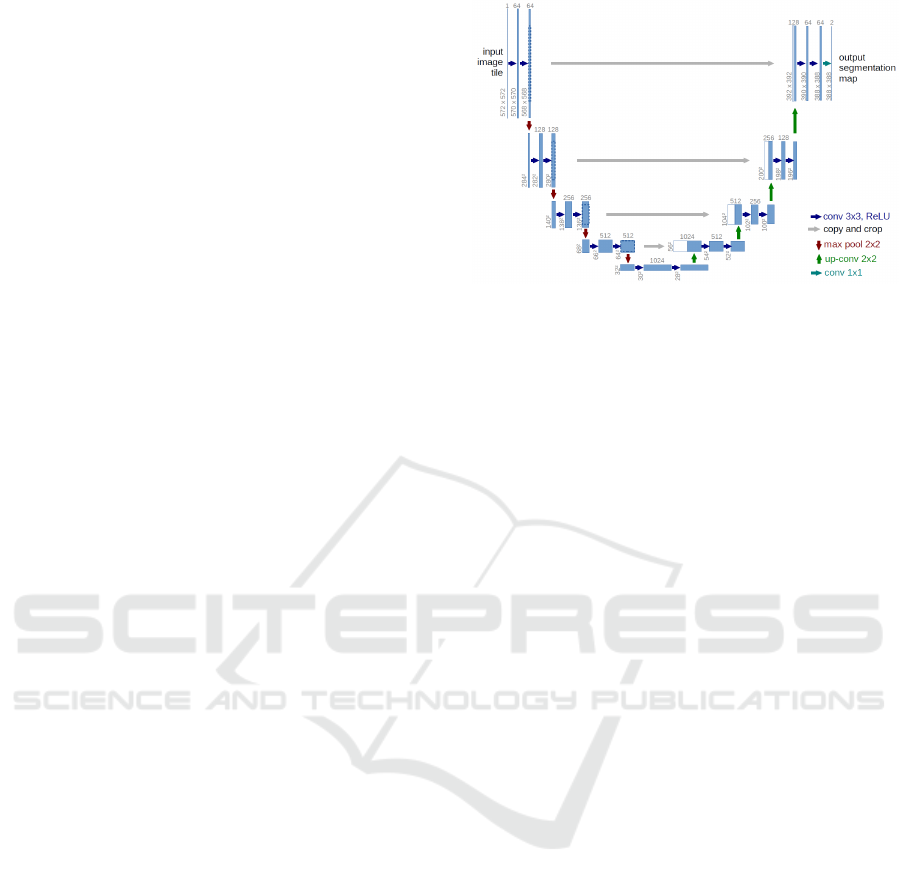
more efficiently.” The original U-net architecture is
shown in Figure 1 and clearly is noted that it has an
‘U’ shape, from where it takes its name.
U-net architecture (Ronneberger et al., 2015a) has
two main parts: the contracting path on the left-hand
side of the architecture, and the expansive path on the
right-hand side. An advantage of this architecture is
its ability to use a wider context to make a prediction
from the actual image pixel by pixel and can specifi-
cally be applied to an image segmentation problem.
The contracting path performs a down-sampling,
whereas the expansive path performs an up-sampling.
Figure 1 is an example which shows a sample of
32 × 32 pixels in the lowest resolution, combined by
an input layer L
in
, and an output layer L
out
, with a
depth D with 5 levels, 25 filters F, 8 max pooling type
Figure 1: Original U-net architecture.
T with a 2 × 2 kernel type K, and a gradient descent
(with momentum) optimizer sgd as an optimizer O.
One important feature to highlight from the U-
net architecture is that it utilizes residual (skip) con-
nections to concatenate early layers to later layers,
which is represented by grey horizontal arrows in Fig-
ure 1. This method is used to skip features from the
contracting path to the expanding path, which helps
to restore spatial information which is lost during
down-sampling. Skip connections strategy helps to
reduce the issue of vanishing gradients in the model
when back-propagating signals across many layers
(Drozdzal et al., 2016). In this work, we use this func-
tionality not only as in the original version, but now
applied to the neighbor layers in the same block as
well.
An interesting functionality used in some neural
networks is the memory cell. Particularly, ConvL-
STM (Xingjian et al., 2015) is a variant of LSTM
(Long Short-Term Memory), which is a type of recur-
rent neural network with an LSTM as a convolution
operation. This functionality helps to better deal with
sequential frames using data that has seen in a previ-
ous stage to make better predictions.
In the design of CNN, general speaking BN is seen
as a required method – for instance the authors in
(Ioffe and Szegedy, 2015) argue that BN allows to ac-
celerate the evolution of a CNN in training by using
much higher learning rates. On the other hand, more
recently the authors in (Gaur et al., 2020) try deep
neural networks without BN. In order to get insight
about the impact of BN in the architecture design, par-
ticularly in the training time, we explore the choice of
using or not BN in the CNN architecture design.
3 ARCHITECTURE SEARCH
One key aspect for the progress of DL is the introduc-
tion of novel neural architectures. Traditionally, the
HNAS: Hyper Neural Architecture Search for Image Segmentation
247
neural architecture design is performed manually by
human experts, following a time consuming trial and
error process.
On the other hand, the design can be performed in
an automated fashion, this process is known as neu-
ral architecture search (NAS). The scope of this work
is not to present all the NAS approaches and perform
an analysis from all of them. Nevertheless, authors in
(Elsken et al., 2019) provide a survey of the current
work related to NAS, classifying them into three di-
mensions: (i) search space, (ii) search strategy, and
(iii) performance estimation strategy.
There are many different search strategies to ex-
plore the space of neural architectures, such as: ran-
dom search (RS), Bayesian optimization (BO), re-
inforcement learning (RL), gradient-based methods
(GM), and evolutionary algorithms.
GA is one of the popular methods used in NAS,
showing the potential to find good hyperparame-
ters/architecture combinations (Montana and Davis,
1989; Ahmed et al., 2020; Laredo et al., 2019) for
image classification (Sun et al., 2020; Kalsi et al.,
2018),and for medical image segmentation (Fan et al.,
2020; Popat et al., 2020). In this work, we use a GA
as the search engine to explore the CNN architecture
space.
4 HNAS
Hyper Neural Architecture Search (HNAS) aims to
automatically design the U-net architecture using GA
to explore the neural network architecture search
space. In this study, we take a U-net as a baseline
for the architecture design and use three functional-
ities choices explained in Section 1: (i) ConvLSTM
cell, (ii) residual connections, and (iii) batch normal-
ization.
In HNAS, the individuals I represent solutions to
a problem which can be defined by three elements:
β is the phenotype, G is the genotype, and S is the
score. The Genotype is a binary string, phenotype is
the neural network architecture, and the score is given
by the fitness function, explained by Equation 4.
The genotype G encodes a set of relevant features
of a neural network architecture by a set of genes
[g
1
, g
2
, ..., g
n
], each g
i
consisting of an array of bits
[b
1
, b
2
, ..., b
k
], where k is the maximum number of
bits used to encode the choices of a given feature.
The phenotype β decodes from G the relevant features
[D, O, P, K, BN, SC,CL] to build a neural network ar-
chitecture.
The structure of the genome to build genotypes
is shown in Table 1, where the list of parameters to
Algorithm 1: HNAS.
Input: G = [g
1
, g
2
, ..., g
n
] // Representation
Output: best I
i
// Best U-Net
1 I
i
← (G, β, S) // S=score
2 β = [D, O, P, K, BN, SC,CL] S = ∅
3 Q
t=0
← I
i
// Initial population
4 while t < m // m = max generations
5 do
6 Evaluate each phenotype β ∈ Q
t−1
7 S(I
i
) ← eval(β
i
) assign fitness score
8 Select parents from Q
t−1
using S
9 Genetic operations on G
i
of selected parents
10 Q
t
← (G, β) offspring (new pop)
11 t ← t +1
12 Return I
i
from Q
t
with the best S.
optimize is: Depth (D), Optimizer (O), Pooling Type
(P), Kernel Type (K), Filter Count (F), Batch Normal-
ization (BN), Skip Connection (SC), and ConvLSTM
Layer (CL). The overall process of HNAS is shown
in Algorithm 1.
5 IRIS SEGMENTATION
We use an image segmentation problem as study case
for our HNAS approach. Particularly, to solve a reti-
nal blood vessel segmentation problem, commonly
used to help detect diabetes, which can cause blind-
ness (Ciulla et al., 2003) or death (Ogurtsova et al.,
2017) all around the world.
Retinal blood vessel segmentation is an image
processing method in deep learning that helps the spe-
cialist to extract blood vessels in retinal images for
diagnosing abnormalities. Diabetic retinopathy (DR)
happens when blood vessels in retinal start to damage
and subnormal growth. Hard exudates near the fovea
is a serious threat to blindness. Screening and diag-
nosis of DR is challenging and time-consuming for
specialists to sight manually the retinal images.
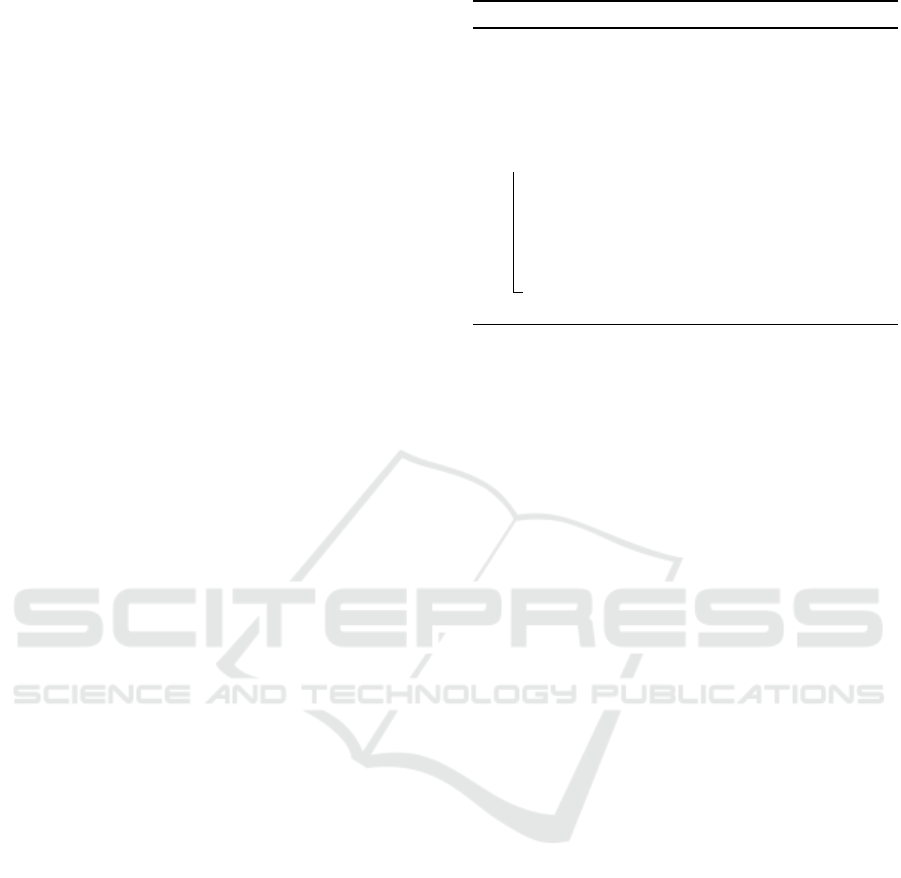
A normal retina is depicted at the left hand in Fig-
ure 2, taken from (Vision, 2020), where we can ob-
serve the blood vessels without any notorious dam-
age. Whereas, at the right hand in Figure 2, we can
observe a typical retina showing the characteristic ab-
normalities related to diabetic retinopathy. The earli-
est signs of this disease are little spots, usually red or
white color, and they can only be detected by a trained
eye from a specialist.
Detecting the pupil boundaries in the eye images
is the first step of the Iris segmentation, next is detect-
ing the iris edges then extracting the iris region.
In this work, we just used the pre-processed im-
ages, but we mention several methods briefly as a
ICAART 2021 - 13th International Conference on Agents and Artificial Intelligence
248
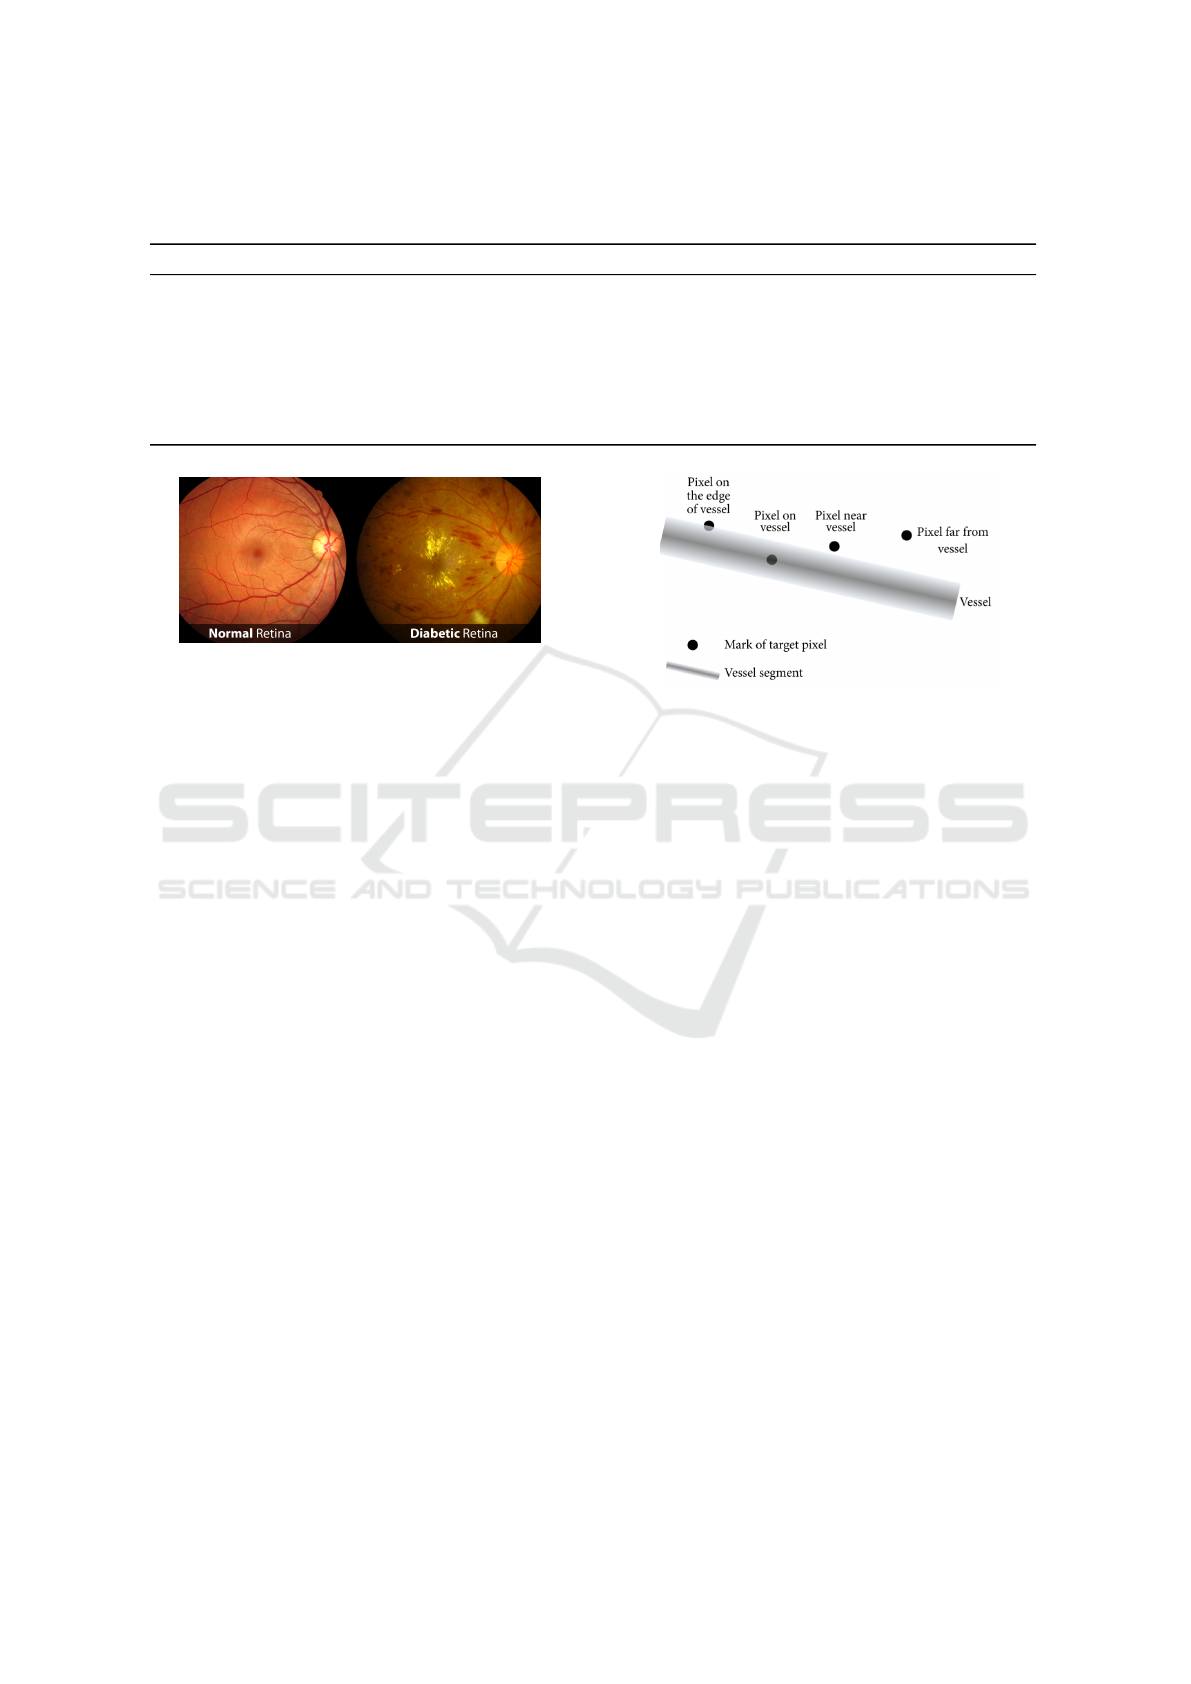
Table 1: Genome composition showing all parameters required to design a U-net architecture, and the genes used for a
genotype representation with a total of 23 bits length.
Parameter Gens Choices Bit-string Bits Qty Size
Depth D { 1, 2, 3, 4 } [b
1
, b
2
] 2 1 2
Optimizer O { sgd, adam, adamax, adagrad } [b
3
, b
4
] 2 1 2
Pooling Type P { MaxPooling, AveragePooling } [b
5
] 1 4 4
Kernel Type K { (3,3), (3,3), (5,5), (7,7) } [b
6
, b
7
] 2 1 2
Filter Size F { 8, 16, 32, 64 } [b
8
, b
9
] 2 1 2
Batch Normaliz. BN { 0, 1 } b
10
1 1 1
Skip Connections SC
1
, ..., SC
9
{ 0, 1 } [b
11
, b
12
, b
13
], ... , [b
17
, b
18
, b
19
] 1 9 9
ConvLSTM layer CL
1
, ..., CL
4
{ 0, 1 } [b
20
, b
21
, b
22
, b
23
] 1 4 4
Figure 2: Images taken from the retina, on the left a normal
retina, and on the right a retina damaged by diabetes.
background which are used for the iris segmenta-
tion, e.g., Boundary-based methods (Roy and Soni,
2016), pixel-based methods (Parikh et al., 2014), ac-
tive contour and circle fitting-based methods (Chai
et al., 2015), and CNN-based methods (Liu et al.,
2016).
After finding the iris region, analyzing the abnor-
mality of the vessels in the retina is the next step. The
normal retina and diabetic retina are shown in Fig-
ure 2 which were taken from (Vision, 2020). As one
can see in the left picture the blood vessels don’t have
any noted damages. In contrast in the right picture,
abnormality related to diabetic retinopathy like red or
white spots are visible. These abnormalities detected
by trained eye images from specialists.
Supervised and unsupervised learning are two
common methods that are used for blood vessel seg-
mentation. In (Moccia et al., 2018) algorithms and
evaluation metrics are presented. In our work, we use
supervised methods to detect the pixel which belongs
to the vessels in eye images or not. The pixels in reti-
nal images are in four categories (Jiang et al., 2017),
as shown in 3: (i) pixel on the boundaries of vessels,
(ii) pixel of the vessel, (iii) pixel close to the vessel,
and (iv) pixel far out of the vessel.
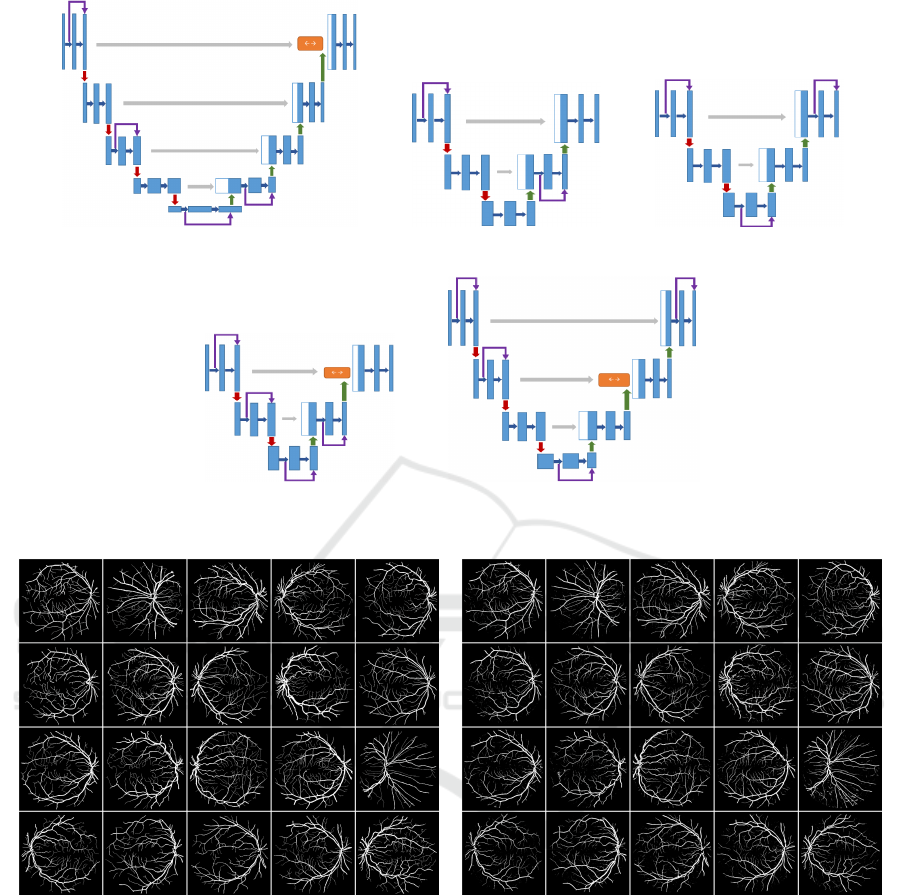
In our experimental setup, we use the Digital Reti-
nal Images for Vessel Extraction (DRIVE, 2020),
consisting of 40 retinal images in total, 20 for training,
and 20 for testing, obtained for a diabetic retinopa-
thy screening program conducted in the Netherlands.
Retinal diseases can be detected by the size, shape,
widening, branching patterns, and angles of vessel
Figure 3: Pictorial representation of the four categories of
pixels when performing a blood vessel segmentation.
tortuosity.
For the training images, a single human segmen-
tation of the vasculature is available. There are two
sets of images manually annotated by one expert each.
Both sets are publicly available, but their segmenta-
tion maps are kept secret. In this work, we follow
the standard strategy of using just one of them as the
ground truth, which is used as the test set in our ex-
periments.
6 EXPERIMENTAL SETUP
We test our HNAS approach to search for suitable U-
net architectures to address the retinal blood vessel
segmentation task using the DRIVE dataset. For con-
venient comparative analysis, we focus first on man-
ually design architectures and then on using HNAS to
automatically find novel U-net architectures.
The manual design of a U-net architecture is not
trivial, this approach is 100% manual and based on
trial and error, as well as on expert knowledge. We
run five manually designed experiments. Following
same strategy as (Alom et al., 2018), we generated
200,000 patches with size (64, 64, 1) from the train-
ing images (20), the activation function for mid lay-
ers is ”relu”, and for output layers is ”sigmoid.” The
parameters used on each experiment are; Number of
epochs: 150, Kernel size: (3,3), Pooling type: ‘Max-
HNAS: Hyper Neural Architecture Search for Image Segmentation
249
(a) Training Set (b) Test Set
Figure 4: Digital RetinalImages for Vessel Extraction: DRIVE dataset. (a) 20 images for training set, and (b) 20 images for
test set, manually annotated by an expert.
Pooling’, and ‘Adam’ as the optimizer with a learning
rate of 0.001.
Exp-1, is the baseline for this set of experiments,
the source code is from (Unet-code, 2019; kerasunet
code, 2019), and it was updated to meet the current
programming language and dependencies require-
ments. Exp-2, without batch normalization. Exp-3,
U-net with residual (skip) connections. Exp-4, U-net
with ConvLSTM. Exp-5, using a residual connection
in each block, convLSTM in every level, and BN. Fig-
ure 5 shows all the U-net architectures for this set of
experiments.
In this set of experiments, we use HNAS to auto-
matically design U-net architectures. The parameters
used for the search engine are shown in Table 2.
In the learning process we use 20 epochs for train-
ing, and at the end of the run we use 150 epochs to
have a fair comparison against the set of manually de-
signed experiments.
Table 2: List of the main parameters used to run GA.
Parameter Value
Runs 1 per exp
Total Generations 20
Population Size 10
Crossover Rate 0.7
Mutation Rate 0.1
Epochs 20 (Training)
Epochs 150 (Best)
Figure 6 shows all the U-net architectures for this
set of experiments.
We evaluated the models from both sets of experi-
ments using several metrics: Accuracy (ACC), Sensi-
tivity, Specificity, Precision. Where TP is the number
of the true positive samples, TN is the number of the
true negative samples, FP is the number of the false
positive samples, FN is the number of the false nega-
tive samples.
Nevertheless, a combination of AUC and ACC is
used to guide the search when using GA, and the Area
Under Curve (AUC) of Receiver Operating Charac-
teristic (ROC) is used to get a comparison with sev-
eral state-of-the-art methods The AUC-ROC curve is
commonly used for classification problems and repre-
sents the degree or measure of separability and shows
how much a model is capable of distinguishing be-
tween classes. The higher the AUC, the better the
model is at predicting. The fitness score is computed
by
AUC
V
=
1
k
k
∑
i=1
AUC(V
k
) (1)
Acc
T
=
1
k
k
∑
i=1
Accuracy(T
k
) (2)
Acc
V
=
1
k
k
∑
i=1
Accuracy(V
k
) (3)
F = |AUC
V
− (|Acc
V
− Acc
T
|)| (4)
where AUC
V
is the score using AUC-ROC with the
validation dataset, Acc
T
is the score using Accuracy
with the training dataset, Acc
V
is the score using Ac-
curacy with the validation dataset, and k is the last
epochs considered, in this case fixed to 5.
The GA fitness score is the absolute difference be-
tween the average of validation AUC-ROC of the last
ICAART 2021 - 13th International Conference on Agents and Artificial Intelligence
250
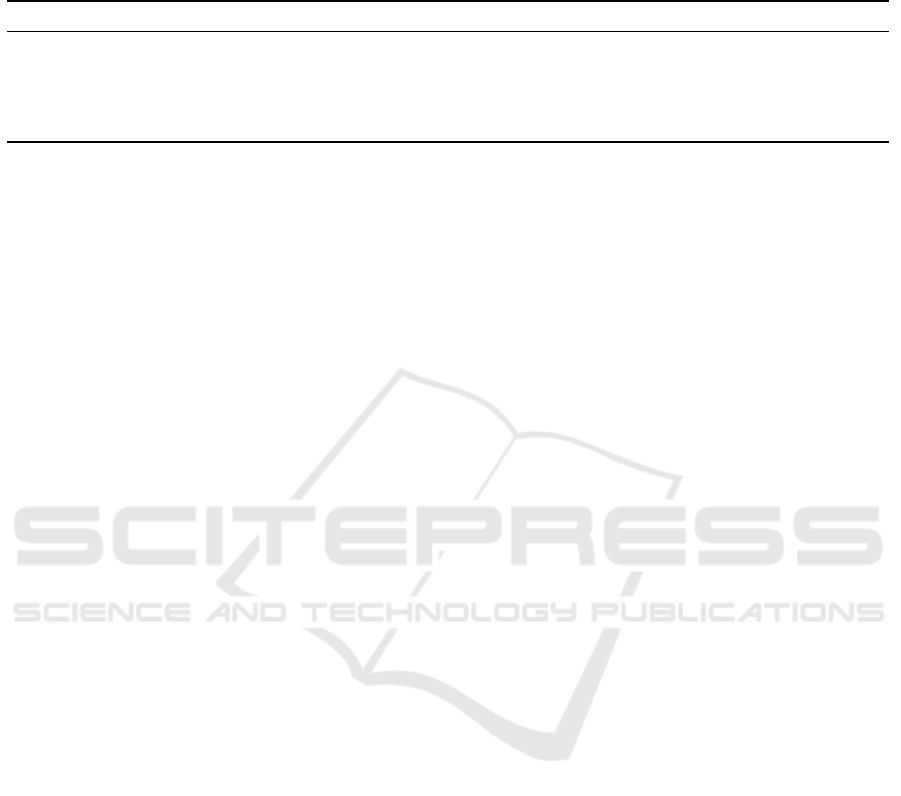
Table 3: U-Net parameters selected automatically by HNAS and related to the genome shown in Table 1. The list of pa-
rameters is: Depth (D), Optimizer (O) with two choices; adam (AD) and adamax (AM), Pooling Type (P) with two choices;
MaxPooling (MP) and AverPooling (AP), Kernel Type (K), Filter Count (F), Batch Normalization (BN) Skip Connection
(SC), ConvLSTM Layer (CL), and the symbol # stands for the parameter not used.
D O P K F BN SC
1
SC
2
SC
3
SC
4
SC
5
SC
6
SC
7
SC
8
SC
9
CL
1
CL
2
CL
3
CL
4
Exp-6 4 AM AP (7,7) 64 1 1 0 1 1 1 1 0 0 0 1 0 0 0
Exp-7 2 AD MP (5,5) 64 1 1 0 0 1 0 # # # # 0 0 # #
Exp-8 2 AM AP (3,3) 64 0 1 0 1 0 1 # # # # 0 0 # #
Exp-9 2 AM AP (7,7) 32 0 1 1 1 1 0 # # # # 1 0 # #
Exp-10 3 AD AP (7,7) 16 1 1 1 0 1 0 0 1 # # 0 1 0 #
5 epochs and the absolute difference between the av-
erage of training accuracy and validation accuracy of
the last 5 epochs. AUC-ROC is one of the most im-
portant metrics for evaluating classification model’s
performance, it’s curve of the performance measure-
ment for classification problem at various thresholds
where the ROC is a probability curve and the AUC
represents degree or measure of separability, higher
AUC means the model is capable of distinguishing
between classes (Bradley, 1997).
The gap difference between validation accuracy
and training accuracy represent the ability of the
model to generalize, the smaller gap is better, when
the gap is big there are two cases: If the training ac-
curacy is greater than the validation accuracy, then we
have over-fitting. If the validation accuracy is lower
than the training accuracy, then we have under-fitting.
By penalising the validation AUC/ROC by the gap
between the validation accuracy and training accu-
racy we are adding the fitting information to the fit-
ness score. If the gap is big then the fitness score will
go down as the targeted model could have a problem
with generalization. The generated models from the
GA have good accuracy with minimum gap between
the training accuracy and validation accuracy, which
represent a good ability to generalize, designing these
kind of models manually is not trivial and it could be
challenging to find the best combinations of hyperpa-
rameters and layers.
The source code used in this work is taken from
(Unet-code, 2019; BCDUNet-code, 2019; kerasunet
code, 2019), we modified these codes to meet our re-
search requirements to build models corresponding to
the GA and evaluating them we are using python 3.8.3
with many libraries like Keras version 2.4.3 and its
dependencies like TensorFlow (Abadi et al., 2016)
version 2.2.0 and TensorFlow-GPU 2.2.0
We used computational resources provided by;
Irish Centre for High-End Computing (ICHEC,
2017). where we run using 1 Node with 2 GPUs;
Nvidia Tesla V100-PCIE-16GB, the Operating Sys-
tem used is Linux. For the HNAS-based experiments,
we used the evolutionary tool; Distributed Evolution-
ary Algorithms (DEAP, 2012) coded in Python and
proposed by (Fortin et al., 2012).
7 RESULTS
In this section, we discuss the results from both sets
of experiments; manual and automatic design of U-
net architectures to address the retinal blood vessel
segmentation task.
A summary of these experimental results is shown
in Table 4, and a comparison against the state-of-the-
art method is shown in Table 5 using the result AUC-
ROC performance from the manually designed Exp-1
and from the Exp-10 using HNAS.
Table 3 shows the skip connections and con-
vLSTM selected by the HNAS-based experiments,
where the first observation is that the skip connections
SC
6
to SC
9
and convLstm CL
3
, CL
4
are not used in
Exp-7, 8, 9 because of D = 2. Exp-6, 7, 8 take high
values for the base filter count F=64 where this num-
ber get doubled in every level down. Exp-10 takes
the smallest values for base filter count F=16. The
skip connections and convLSTM position differ from
model to another, some models do not have convL-
STM layer at all like in Exp-7, 8. The skip connec-
tions look symmetric only in Exp-8, and not symmet-
ric in the rest of the generated models. All the gen-
erated models seem to have a skip connection on the
first block of the U-net.
The results in Table 4 are split into two sections:
Manual and HNAS-based. The HNAS-based results
are obtained from different runs of the GA/GAs. The
results from Sensitivity, Specificity, and Precision are
given as reference, but they were used neither to guide
the search nor to give a comparison against other
methods.
In the automated set of experiments there are two
optimizations happening at the same time; i) parame-
ter optimization using either sgd or adam, and ii) U-
net architecture optimization using GA.
The performance in training is given by Train-
Acc showed in the first column of the Table 4, which
HNAS: Hyper Neural Architecture Search for Image Segmentation
251
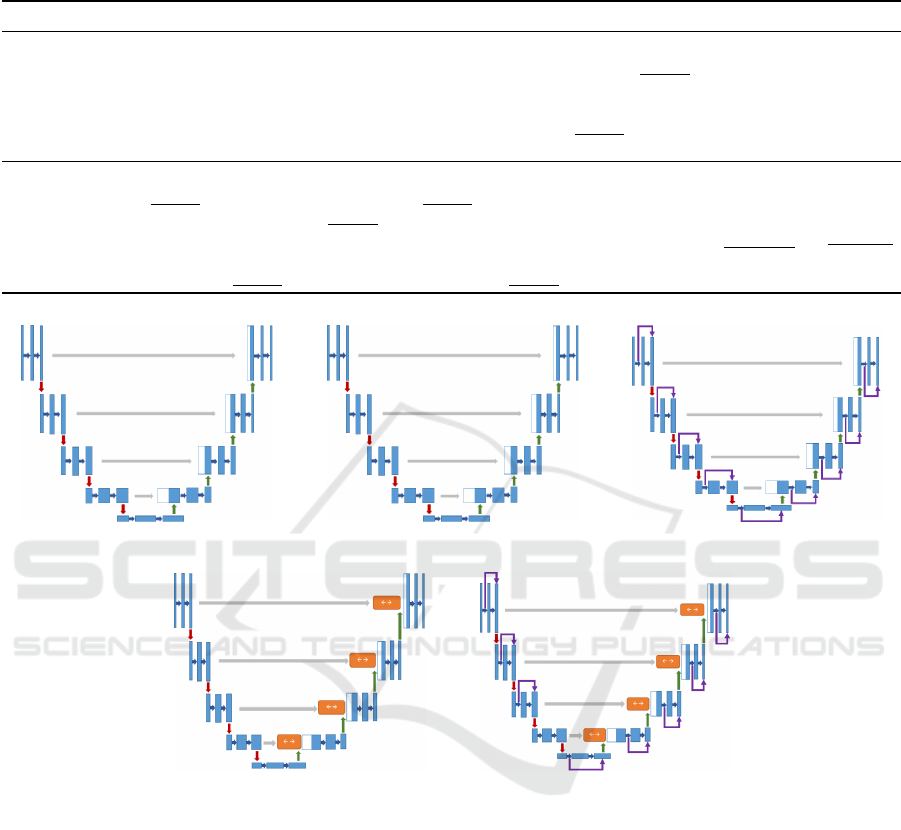
Table 4: Experimental results, bold numbers are the best results in each setup and underlined numbers are the best results
from both set of experiments.
Experiment Train-Acc Test-Acc Sensitivity Specificity Precision AUC F1 Parameters TrainTime
Manual
Exp-1 0.9976 0.9544 0.7782 0.9801 0.8512 0.9732 0.8130 31,028,289 10:02:28
Exp-2 0.9862 0.9512 0.7737 0.9771 0.8310 0.9713 0.8014 31,030,593 10:13:11
Exp-3 0.9935 0.9541 0.7791 0.9796 0.8477 0.9737 0.8120 31,048,257 10:45:03
Exp-4 0.9744 0.9530 0.7780 0.9786 0.8411 0.9759 0.8083 27,397,697 13:36:45
Exp-5 0.9899 0.9522 0.7816 0.9771 0.8329 0.9722 0.8064 27,417,665 14:40:55
HNAS-based
Exp-6 0.9994 0.9542 0.7707 0.9810 0.8553 0.9704 0.8108 157,251,777 62:16:03
Exp-7 0.9956 0.9531 0.7830 0.9779 0.8379 0.9730 0.8095 4,877,633 05:19:36
Exp-8 0.9940 0.9528 0.7701 0.9795 0.8454 0.9714 0.8060 1,861,697 03:36:59
Exp-9 0.9947 0.9539 0.7699 0.9807 0.8536 0.9735 0.8096 2,903,457 10:27:11
Exp-10 0.9890 0.9546 0.7744 0.9809 0.8555 0.9749 0.8129 2,981,265 05:51:37
(a) Exp-1 (b) Exp-2 (c) Exp-3
(d) Exp-4 (e) Exp-5
Figure 5: U-Net architectures manually designed from experiment 1 to 5.
stands for the accuracy performance in training com-
puted using the Equation 4. The score obtained from
the accuracy measure is used as a fitness score from
the best U-net architecture on the HNAS-based exper-
iments.
The Exp-2 got the best training performance from
the manual design experiments, whereas the Exp-6 is
the winner of the HNAS-based experiments, and the
latter is the best from both sets of experiments. But
the difference is not really significant.
The accuracy performance using the test set is
given by Test-Acc showed in the second column of
the Table 4. Exp-2 gets the best test performance from
the manual design experiments, and the Exp-10 gets
better from the HNAS-based, the Exp-10 is the win-
ner, but again by a little margin.
Considering statistics other that accuracy, the U-
net architecture from the Exp-6, gets the overall best
sensitivity performance, the U-net from the Exp-7, is
the best on the specificity, and the U-net from Exp-10
is the best on the precision measure.
Considering the AUC-ROC measure, the U-net
from Exp-10 is the best in the HNAS-based and the
the U-net from Exp-4 is the overall winner with a
small margin.
From the previous analysis we can agree that the
architectures evolved by HNAS show better overall
performance against the U-nets designed manually.
Now, let us analyze the interesting results from
the model size and time shown in the latter columns
ICAART 2021 - 13th International Conference on Agents and Artificial Intelligence
252
(a) Exp-6 (b) Exp-7 (c) Exp-8
(d) Exp-9 (e) Exp-10
Figure 6: U-Net architectures evolved through GA from experiment 6 to 10.
(a) GT-Test Set (b) Exp1 Test Set
Figure 7: Comparison between the Ground Truth (GT) and the images obtained by the U-net in the Exp-1 using the test set.
(a) Test set from DRIVE, (b) prediction on test using the U-net from Exp-1 manually designed.
in the Table 4. The HNAS-based models show small
size models with faster training time comparing to the
manual design models, the only big U-net architecture
in the set of experiments from HNAS is in the Exp-6
where the model has the maximum size for depth 4,
base filter count 64 where this number get doubled
in every depth to reach 1024 filters in the last depth
and the kernel size (7,7), these hyperparameters cause
bigger number of parameters (weights) which leads
to bigger training time. The other HNAS-based ex-
periments were able to find smaller U-net with faster
training time, all the HNAS-based show quick con-
verge with smooth accuracy curves with minimum ac-
curacy gap between training and validation.
As can be noted most of U-net architectures
evolved by HNAS from Exp-7 to Exp-10 are always
smaller than the architecture manually designed. The
U-net from Exp-8 got a reduction of more than 16
times from the original U-net manually designed in
the Exp-1.
This reduction in size is reflected in the computa-
tional effort used as shown in the ’TrainTime’ column
HNAS: Hyper Neural Architecture Search for Image Segmentation
253
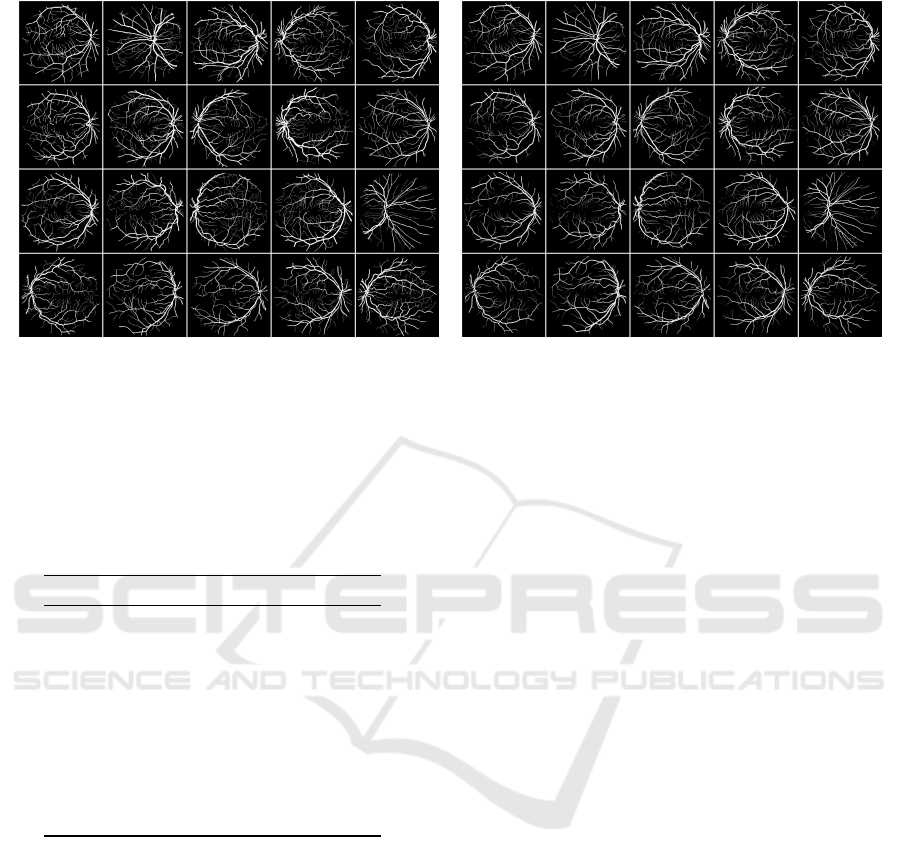
(a) GT-Test Set (b) Exp10 Test Set
Figure 8: Comparison between the Ground Truth (GT) and the images obtained by the U-net in the Exp-10 using the test set.
(a) Test set from DRIVE, (b) prediction on test using the U-net from Exp-10 using the automated HNAS approach.
Table 5: Comparison of the AUC-ROC performance from
the manually designed U-net from Exp-2 and the HNAS-
based from Exp-10 both marked with an asterisk (*) against
different state-of-the-art methods, showing on the top the
best.
Method AUC-ROC
(Ronneberger et al., 2015b) 0.9790
(Liskowski and Krawiec, 2016) 0.9790
Exp-2 (Manual) 0.9759*
Exp-10 (HNAS-based) 0.9749*
(Melin
ˇ
s
ˇ
cak et al., 2015) 0.9749
(Fraz et al., 2012) 0.9747
(Li et al., 2015) 0.9738
(Roychowdhury et al., 2014) 0.9670
(Osareh and Shadgar, 2009) 0.9650
(Soares et al., 2006) 0.9614
(Azzopardi et al., 2015) 0.9614
in Table 4. For instance, the best HNAS-based U-net
found in the Exp-10 took less than the half time com-
paring to best manual design Exp-4 for training, on
the other hand, Exp-8 took around the quarter of the
time of Exp-4 for training with competitive perfor-
mance.
Finally, in Table 5 shows the results from 9 pre-
vious related works using the result AUC-ROC per-
formance taken from (Unet-code, 2019), where the
top results are from (Xiancheng et al., 2018) and
(Liskowski and Krawiec, 2016). It can be noted that
the prediction performance from the HNAS-based
Exp-6 is competitive against those top results.
8 CONCLUSIONS
In this research work, we propose to automatically
search for U-net architectures applied to solve a reti-
nal blood vessel segmentation problem.
The proposed approach HNAS uses a GA as
search engine to explore the neural network architec-
ture search space, specifically in this work we use U-
net as a baseline for the architecture design adding
three functionalities; 1) ConvLSTM cell, 2) residual
connections, and 3) a binary strategy to choose batch
normalization.
we address the retinal blood vessel segmentation
task using the benchmark from the DRIVE images
dataset. Current state-of-the-art approaches all use
some form of NNs which are increasing its complex-
ity, then manually designing them is challenging.
We implemented two sets of experiments; manual
and automated design of U-net architectures. The first
set of experiments; (i) Exp-1, is the baseline, running
a standard U-net, (ii) Exp-2, without batch normal-
ization, (iii) Exp-3, U-net with residual (skip) con-
nections, (iv) Exp-4, U-net with ConvLSTM, and (v)
Exp-5, using all functionalities.
On the other hand, we use HNAS to search for
U-net architectures. This approach can easily be ex-
tended to address other problem domains and could
help to introduce new ANN architects with the right
combination of layers and hyperparameters to fit data
without suffering from over/under-fitting.
The experimental results show that the manually
designed reach good results, but they have room for
improvement, and knowledge expertise and time con-
ICAART 2021 - 13th International Conference on Agents and Artificial Intelligence
254

sumption of trial and error process to find the right
architecture combination. The results from the auto-
mated approach using HNAS strikes a compromise
between the unbias showed by a random search and
the manual search algorithm driven primarily by prior
(human) knowledge. HNAS is able to find even
smaller architectures than the manually designed U-
nets, and getting competitive accuracy performance
against state-of-the-art methods.
For future work, we are planning to introduce
more new layers and increase the size of the popu-
lation and number generations to see if GA is able
to further improve the performance on this problem.
Furthermore, an extension of this work is to apply
GA to evolve U-nets considering different architec-
ture types.
ACKNOWLEDGEMENTS
This work was conducted with the financial sup-
port of the Science Foundation Ireland (SFI) Centre
for Research Training in Artificial Intelligence under
Grant No. 18/CRT/6223, by the research Grant No.
16/IA/4605, and by Lero, the Irish Software Engi-
neering Research Centre (www.lero.ie). The fourth
author is partially financed by the Coordenao de
Aperfeioamento de Pessoal de Nvel Superior - Brasil
(CAPES) - Finance Code 001.
REFERENCES
Abadi, M., Barham, P., Chen, J., Chen, Z., Davis, A.,
Dean, J., Devin, M., Ghemawat, S., Irving, G., Isard,
M., et al. (2016). Tensorflow: A system for large-
scale machine learning. In 12th {USENIX} Sympo-
sium on Operating Systems Design and Implementa-
tion ({OSDI} 16), pages 265–283.
Ahmed, A. A., Darwish, S. M. S., and El-Sherbiny, M. M.
(2020). A novel automatic cnn architecture design
approach based on genetic algorithm. In Hassanien,
A. E., Shaalan, K., and Tolba, M. F., editors, Pro-
ceedings of the International Conference on Advanced
Intelligent Systems and Informatics 2019, pages 473–
482, Cham. Springer International Publishing.
Alom, M. Z., Hasan, M., Yakopcic, C., Taha, T. M., and
Asari, V. K. (2018). Recurrent residual convolutional
neural network based on u-net (r2u-net) for medical
image segmentation.
Azzopardi, G., Strisciuglio, N., Vento, M., and Petkov, N.
(2015). Trainable cosfire filters for vessel delineation
with application to retinal images. Medical image
analysis, 19(1):46–57.
BCDUNet-code (2019). Bi-directional convlstm u-net with
densley connected convolutions. https://github.com/
rezazad68/BCDU-Net. Accessed: 2020-05-07.
Bradley, A. P. (1997). The use of the area under the
roc curve in the evaluation of machine learning algo-
rithms. Pattern Recognition, 30(7):1145 – 1159.
Chai, T., Goi, B., Tay, Y. H., Chin, W., and Lai, Y. (2015).
Local chan-vese segmentation for non-ideal visible
wavelength iris images. In 2015 Conference on Tech-
nologies and Applications of Artificial Intelligence
(TAAI), pages 506–511.
Ciulla, T. A., Amador, A. G., and Zinman, B. (2003). Dia-
betic retinopathy and diabetic macular edema: patho-
physiology, screening, and novel therapies. Diabetes
care, 26(9):2653–2664.
DEAP (2012). Distributed evolutionary algorithms. https://
deap.readthedocs.io/en/master/. [Online; accessed 20-
June-2020].
DRIVE (2020). Digital retinal images for vessel ex-
traction. http://www.isi.uu.nl/Research/Databases/
DRIVE/. Accessed: 2020-06-21.
Drozdzal, M., Vorontsov, E., Chartrand, G., Kadoury, S.,
and Pal, C. (2016). The importance of skip connec-
tions in biomedical image segmentation. In Deep
Learning and Data Labeling for Medical Applica-
tions, pages 179–187. Springer.
Elsken, T., Metzen, J. H., and Hutter, F. (2019). Neural
architecture search: A survey.
Fan, Z., Wei, J., Zhu, G., Mo, J., and Li, W. (2020). Evo-
lutionary neural architecture search for retinal vessel
segmentation.
Fortin, F.-A., Rainville, F.-M. D., Gardner, M.-A., Parizeau,
M., and Gagn
´
e, C. (2012). Deap: Evolutionary al-
gorithms made easy. Journal of Machine Learning
Research, 13(70):2171–2175.
Fraz, M. M., Remagnino, P., Hoppe, A., Uyyanonvara,
B., Rudnicka, A. R., Owen, C. G., and Barman,
S. A. (2012). An ensemble classification-based
approach applied to retinal blood vessel segmenta-
tion. IEEE Transactions on Biomedical Engineering,
59(9):2538–2548.
Gaur, D., Folz, J., and Dengel, A. (2020). Training deep
neural networks without batch normalization.
Geng, Z. and Wang, Y. (2020). Automated design of a con-
volutional neural network with multi-scale filters for
cost-efficient seismic data classification. Nature Com-
munications, 11:3311.
ICHEC (2017). Irish centre for high-end computing. https:
//www.ichec.ie/. [Online; accessed 20-June-2020].
Ioffe, S. and Szegedy, C. (2015). Batch normalization: Ac-
celerating deep network training by reducing internal
covariate shift. CoRR, abs/1502.03167.
Isensee, F., Jger, P. F., Kohl, S. A. A., Petersen, J., and
Maier-Hein, K. H. (2019). Automated design of deep
learning methods for biomedical image segmentation.
Jiang, D., Meng, L., Zhenshen, M., Chao, L., Guang, Z.,
and Zhe, H. (2017). Robust retinal blood vessel seg-
mentation based on reinforcement local descriptions.
BioMed Research International, Hindawi, 2017. Arti-
cle ID 2028946.
HNAS: Hyper Neural Architecture Search for Image Segmentation
255

Kalsi, S., Kaur, H., and Chang, V. (2018). Dna cryp-
tography and deep learning using genetic algorithm
with nw algorithm for key generation. J. Med. Syst.,
42(1):112.
kerasunet code (2019). Helper package with multiple
u-net implementations in keras. https://github.com/
karolzak/keras-unet. Accessed: 2020-06-10.
Laredo, D., Qin, Y., Schtze, O., and Sun, J.-Q. (2019). Au-
tomatic model selection for neural networks.
Li, Q., Feng, B., Xie, L., Liang, P., Zhang, H., and Wang, T.
(2015). A cross-modality learning approach for vessel
segmentation in retinal images. IEEE transactions on
medical imaging, 35(1):109–118.
Liskowski, P. and Krawiec, K. (2016). Segmenting retinal
blood vessels with deep neural networks. IEEE trans-
actions on medical imaging, 35(11):2369–2380.
Liu, N., Li, H., Zhang, M., Jing Liu, Sun, Z., and Tan, T.
(2016). Accurate iris segmentation in non-cooperative
environments using fully convolutional networks. In
2016 International Conference on Biometrics (ICB),
pages 1–8.
Melin
ˇ
s
ˇ
cak, M., Prenta
ˇ
si
´
c, P., and Lon
ˇ
cari
´
c, S. (2015). Reti-
nal vessel segmentation using deep neural networks.
In 10th International Conference on Computer Vision
Theory and Applications (VISAPP 2015).
Moccia, S., Momi], E. D., Hadji], S. E., and Mattos, L. S.
(2018). Blood vessel segmentation algorithms review
of methods, datasets and evaluation metrics. Com-
puter Methods and Programs in Biomedicine, 158:71
– 91.
Montana, D. J. and Davis, L. (1989). Training feedforward
neural networks using genetic algorithms. In Pro-
ceedings of the 11th International Joint Conference
on Artificial Intelligence - Volume 1, IJCAI’89, page
762767, San Francisco, CA, USA. Morgan Kaufmann
Publishers Inc.
Ogurtsova, K., da Rocha Fernandes, J., Huang, Y., Lin-
nenkamp, U., Guariguata, L., Cho, N. H., Cavan, D.,
Shaw, J., and Makaroff, L. (2017). Idf diabetes at-
las: Global estimates for the prevalence of diabetes
for 2015 and 2040. Diabetes research and clinical
practice, 128:40–50.
Osareh, A. and Shadgar, B. (2009). Automatic blood ves-
sel segmentation in color images of retina. SCI-
ENCE AND TECHNOLOGY TRANSACTION B-
ENGINEERING.
Parikh, Y., Chaskar, U., and Khakole, H. (2014). Effec-
tive approach for iris localization in nonideal imaging
conditions. In Proceedings of the 2014 IEEE Students’
Technology Symposium, pages 239–246.
Popat, V., Mahdinejad, M., Dalmau Cedeo, O. S., Naredo,
E., and Ryan, C. (2020). Ga-based u-net architecture
optimization applied to retina blood vessel segmenta-
tion. In ECTA-2020 part of IJCCI, 12th International
Joint Conference on Computational Intelligence.
Ronneberger, O., Fischer, P., and Brox, T. (2015a). U-
net: Convolutional networks for biomedical image
segmentation. CoRR, abs/1505.04597.
Ronneberger, O., Fischer, P., and Brox, T. (2015b). U-
net: Convolutional networks for biomedical image
segmentation. In Navab, N., Hornegger, J., Wells,
W. M., and Frangi, A. F., editors, Medical Image Com-
puting and Computer-Assisted Intervention MICCAI
2015, volume 9351 of Lecture Notes in Computer Sci-
enc, pages 234–241, Munich, Germany. Springer In-
ternational Publishing.
Roy, D. A. and Soni, U. S. (2016). Iris segmentation us-
ing daughman’s method. In 2016 International Con-
ference on Electrical, Electronics, and Optimization
Techniques (ICEEOT), pages 2668–2676.
Roychowdhury, S., Koozekanani, D. D., and Parhi, K. K.
(2014). Blood vessel segmentation of fundus images
by major vessel extraction and subimage classifica-
tion. IEEE journal of biomedical and health infor-
matics, 19(3):1118–1128.
Soares, J. V., Leandro, J. J., Cesar, R. M., Jelinek, H. F., and
Cree, M. J. (2006). Retinal vessel segmentation using
the 2-d gabor wavelet and supervised classification.
IEEE Transactions on medical Imaging, 25(9):1214–
1222.
Sun, Y., Xue, B., Zhang, M., Yen, G. G., and Lv, J.
(2020). Automatically designing cnn architectures
using the genetic algorithm for image classification.
IEEE Transactions on Cybernetics, 50(9):38403854.
Unet-code (2019). Implementation of deep learning frame-
work unet, using keras. https://github.com/zhixuhao/
unet. Accessed: 2020-04-15.
Vision, S. (2020). Diagnosing and treating diabetic
retinopathy in dallas. https://salandvision.com/
eye-conditions/diabetic-retinopathy/. [Online; ac-
cessed 20-June-2020].
Xiancheng, W., Wei, L., Bingyi, M., He, J., Jiang, Z.,
Xu, W., Ji, Z., Hong, G., and Zhaomeng, S. (2018).
Retina blood vessel segmentation using a u-net based
convolutional neural network. In Procedia Computer
Science: International Conference on Data Science
(ICDS 2018), Beijing, China, pages 8–9.
Xingjian, S., Chen, Z., Wang, H., Yeung, D.-Y., Wong, W.-
K., and Woo, W.-c. (2015). Convolutional lstm net-
work: A machine learning approach for precipitation
nowcasting. In Advances in neural information pro-
cessing systems, pages 802–810.
ICAART 2021 - 13th International Conference on Agents and Artificial Intelligence
256
