
In-car Damage Dirt and Stain Estimation with RGB Images
Sandra Dixe
a
, Jo
˜
ao Leite
b
, Sahar Azadi
c
, Pedro Faria
d
, Jos
´
e Mendes
e
,
Jaime C. Fonseca
f
and Jo
˜
ao Borges
g
Algoritmi Center, University of Minho, Guimar
˜
aes, Portugal
Keywords:
Semantic Segmentation, Shared Autonomous Vehicles, Deep Learning, Supervised Learning.
Abstract:
Shared autonomous vehicles (SAV) numbers are going to increase over the next years. The absence of human
driver will create a new paradigm for in-car safety. This paper addresses the problem, presenting a monitoring
system capable of estimating the state of the car interior, namely the presence of damage, dirt and stains. We
propose the use of Semantic Segmentation methods to perform appropriate pixel-wise classification of certain
textures found in the car’s cabin as defect classes. Two methods, U-Net and DeepLabV3+, were trained and
tested for different hiper-parameter and ablation scenarios, using RGB images. To be able to test and validate
these approaches an In-car dataset was created, comprised by 1861 samples from 78 cars, and than splitted in
1303 train, 186 validation and 372 test RGB images. DeepLabV3+ showed promissing results, achieving an
average accuracy for good, damage, stain and dirt of 77.17%, 58.60%, 65.81% and 68.82%, respectively.
1 INTRODUCTION
Shared autonomous vehicles (SAV) present a cost and
safety advantage due to the lack of human driver,
however in-vehicle, car and passenger, safety con-
cerns arise. To guarantee the safety of passengers
and the monitoring of the interior of an SAV, sev-
eral works have been developed. Torres et al. (Tor-
res et al., 2019) proposes a system for monitoring
passengers, using a deep learning strategy to accu-
rately detect the human pose in images captured in-
side a car. Deep learning strategies require a consid-
erable amount of data, thus Borges et al. proposes
tools for automated generation of synthetic (Borges
et al., 2020) and real (Borges et al., 2021) in-car
dataset for human body pose detection. The synthetic
dataset approach provides a personalized in-car en-
vironment, which simulates humans, sensors and car
models. Moreover, the real dataset approach com-
bines optical and inertial based systems to achieve in-
car motion capture.
Quality of service can be directly or indirectly
a
https://orcid.org/0000-0003-4595-3828
b
https://orcid.org/0000-0003-1452-7842
c
https://orcid.org/0000-0001-7002-8496
d
https://orcid.org/0000-0002-4590-3727
e
https://orcid.org/0000-0003-3317-8238
f
https://orcid.org/0000-0001-6703-3278
g
https://orcid.org/0000-0002-5880-033X
hindered by passengers, due to material wear, dam-
age, stain or dirt presence. Thus, there is a need to
develop advanced systems for monitoring the inte-
rior of the car, which ensures the safety of car and
passengers. Moreover, a system capable of estimat-
ing the presence of damage, stain and dirt, will en-
sure the quality of the car, and consequently the ser-
vice provided. There are several studies developed
so far, aimed at classifying damage in many sectors
((Liu et al., 2010); (Montanini, 2010); (Furtado et al.,
2001)), through the most diverse approaches ((Jing
et al., 2013); (Hu, 2014);), however in-car inspection
has not been explored.
The materials of interest in this study are typically
found inside cars, representing an important part, due
to the visual disparities of each class regarding materi-
als. Common materials used in the manufacture of car
interiors are: leather, a noble natural material associ-
ated with high-end car models; courvin, a synthetic
version of leather; knitted fabric, are fabrics coupled
to a foam of different weights, which ensures com-
fort inside the cars; fabric made in the loom, widely
used by the automotive industry, presents an excellent
cost-benefit; knitting, a widely used material, where
different cores and patterns are obtained.
In-car damage, stain and dirt is the result of
certain behaviours that occupants systematically ex-
hibit daily. Car interiors are mostly made of plas-
tic and fabric, with cotton or synthetic fabrics im-
672
Dixe, S., Leite, J., Azadi, S., Faria, P., Mendes, J., Fonseca, J. and Borges, J.
In-car Damage Dirt and Stain Estimation with RGB Images.
DOI: 10.5220/0010228006720679
In Proceedings of the 13th International Conference on Agents and Artificial Intelligence (ICAART 2021) - Volume 2, pages 672-679
ISBN: 978-989-758-484-8
Copyright
c
2021 by SCITEPRESS – Science and Technology Publications, Lda. All rights reserved

itating leather. The factors that can be responsible
for the degradation of materials such as plastics and
leather-like materials tend to be disinfectants, that has
a large amount of ethanol, and sunscreens, which con-
tain chemicals that damage the internal lining of cars.
The car dashboard is usually an area where plastics
predominate, and the fact that this area is quite ex-
posed to the sun causes these plastics to lose their
rigidity and even break. In cars with inferior quality
materials, after just a few years, start to show signs
of wear, the same goes for the upholstery, which can
easily show stains and wear. On carpets, on the other
hand, dirt often accumulates, or signs of rust appear
due to the dampness of shoes in winter. Human sweat
also has properties that, when in contact with the var-
ious materials that make up the seats of cars, cause
premature wear.
To capture such classes inside of the car, RGB
cameras can be used. With this type of images it
is possible, through Deep Learning algorithms, to
estimate the presence of each class. There are al-
ready methods for pixel-wise classification in RGB
images. In this article, two state-of-the-art methods,
U-Net and DeepLabV3+, were studied and fine-tuned
for the selected use-case. In a first stage, an in-car
dataset was created, to be used for algorithmic devel-
opment. In the second stage, both methods were eval-
uated through different input feature formats. In the
third stage, the best methods from the second stage
were evaluated, iteratively, through different hiper-
parameter and ablation configurations. The rest of the
paper is organized as follows. Section 2 presents the
state-of-the-art for different methods in tissue dam-
age detection and localization, as well as the meth-
ods used in this article. Models implementation and
Dataset creation is described in section 3. Experi-
ments are described in section 4, with its correspond-
ing results. Discussed is presented in section 5. In
section 6, the article is concluded.
2 RELATED WORK
Several studies focused on the detection of damages
and defects in the textile fabric have been presented.
One of the most used methodologies in the detection
and classification of defects is based on Gabor filters
((Jing et al., 2013); (Hu, 2014)).
Yapi et al. (Yapi et al., 2018) presents a learning-
based approach for automatic detection of tissue de-
fects, the proposed approach is based on a statisti-
cal representation of tissue patterns using Redundant
Contourlet Transform (RCT). The distribution of the
coefficients RCT model is modelled using a finite
mixture of generalized Gaussians, constituting statis-
tical signatures that distinguish between defective tis-
sues and non defective. In addition to being com-
pact and quick to calculate, these signatures also al-
low the precise localization of defects. The proposed
approach promises to deal with various types of fab-
rics, from the simplest to the most complex. Exper-
iments were based one the Textile Texture-Database
(TILDA), proposed by (SchulzMirbach, 1996), con-
sisting of 3200 images with 8 types of fabrics with
different textures. Moreover, for each type of fabric,
7 classes of error and 1 class without error (i.e. ref-
erence) were defined. In short, there are 8 types of
classes for each type of fabric. The authors showed
that the method produces better results compared to
the more recent ones.
The most recent techniques rely on Machine
Learning (Liu et al., 2019) and Deep learning (Jeyaraj
and Samuel Nadar, 2019) techniques.
Liu et al. (Liu et al., 2019) introduces a new
method for classifying defective tissue in images us-
ing unsupervised segmentation using Extreme Learn-
ing Machine, and promises to balance efficiency and
accuracy in defect recognition. The authors recognise
that in the last three decades, countless methods of de-
tecting tissue defects have been presented, using com-
puter vision techniques and pattern recognition. The
best known and most used methods are Gray’s Rela-
tional Analysis, Wavelet transformation coefficients,
Fourier transformation, Gabor filters and redundant
boundary transformation. These methods recognise
defects by extracting characteristics from the texture
of the fabric, the sensitivity of detection can be af-
fected when the defects are very small and with low
contrast. According to the article, the main challenges
are the detection of defects in certain meshes, as these
include the complexity of the textures. This model
was evaluated using the TILDA dataset and some real
tissue samples. The results demonstrate the effec-
tiveness of the method in detecting defects of several
shapes, sizes and locations. The classification accu-
racy of the presented method is 91.80%, surpassing
state-of-the-art models.
Jeyaraj et al. (Jeyaraj and Samuel Nadar, 2019)
proposed a model that allows to accurately detect the
defective region using Convolutional Neural Network
(CNN), this algorithm classifies defects through un-
supervised learning. In the test phase, the algorithm
was evaluated using the standard TILDA dataset and
tissue samples acquired in real time. In summary,
to numerically validate the effectiveness of the CNN
model, it was compared with three other approaches
commonly used in modern industry (Support Vector
Machine, Gabor Filter and CNN), concluding that the
In-car Damage Dirt and Stain Estimation with RGB Images
673

proposed CNN algorithm detects most fabric defects,
with an accuracy of 96.55%.
Alternative approaches are spatial object detec-
tors. The authors (Girshick et al., 2014; Girshick,
2015; Ren et al., 2016) developed the R-CNN fam-
ily of algorithms to detect different regions of interest
in the image while using a CNN to classify the pres-
ence of the object in that region. More recently, the
YOLO (Redmon et al., 2016) object detection family
presented as YOLOv2 (Redmon and Farhadi, 2017),
YOLOv3 (Redmon and Farhadi, 2018) and YOLOv4
(Bochkovskiy et al., 2020), provide a more accurate
and faster method compared to the R-CNN family.
Another approach is the use of image pixel-
wise segmentation, it is the task of grouping parts
of an image that belong to the same object class.
DeepLabV3+ (Chen et al., 2018) and U-Net (Ron-
neberger et al., 2015), are proposed as powerful se-
mantic segmentation methods.
In the work of Chen et al. (Chen et al., 2018), a
semantic segmentation method was proposed, which
uses the DeepLabV3+ model invented by Google.
The architecture of DeepLabV3+ consists of two
phases: (1) encoding; and (2) decoding. During en-
coding, a pre-trained CNN extracts the essential in-
formation of the input image. For segmentation tasks,
the essential information is the objects present in the
image and their location. In decoding, the informa-
tion extracted from the encoding phase is used to cre-
ate an output with the original size of the input image.
The method makes use of two types of neural net-
works that use a spatial pyramid pooling module and a
encoder-decoder structure for semantic segmentation,
in which the first captures good contextual informa-
tion by grouping the features in different resolutions,
and the second obtains sharp edges of objects.
Ronneberger et al. (Ronneberger et al., 2015),
proposed the U-Net which is a CNN architecture for
the segmentation of Biomedical Images, which con-
sists of two part: (1) the contraction path (i.e. en-
coder), it is used to capture the context of the image,
the encoder is formed by a traditional stack of convo-
lutional and max pooling layers; and (2) the symmet-
ric expansion path (i.e. decoder), which is used to es-
timate the precise location, using transposed convolu-
tions. It can be said that U-Net is an end-to-end Fully
Convolutional Network. U-Net uses data augmenta-
tion, which is very important in the task to teach the
network the much desired properties of invariance and
robustness. The use of data augmentation is important
when faced with a small range of samples available
for training. The author (Ronneberger et al., 2015)
concludes that the U-Net architecture achieves very
good performance in quite different applications of
biomedical segmentation.
3 IMPLEMENTATION
The aim of this work was to detect damage, stain and
dirt classes (i.e. pixel-wise segmentation) from RGB
images capture inside cars. All implementations were
based on the the original DeepLabV3+ and U-Net
models as a starting point.
3.1 Models
DeepLabV3+ (Table 1) used the restnet18 (He et al.,
2016) backbone, with no pre-training. The detector
input resolution was changed according to the exper-
iments requirements, while preserving the 3-channels
from RGB. Pixel-wise segmentation was defined for
4 classes (i.e. good, damage, stain and dirt). In or-
der to cope with future dataset class imbalance, while
performing cross-validation loss, the final pixel clas-
sification layer used class weights.
Table 1: DeepLabV3+ model parameters.
Parameter Value
Backbone resnet18
Classes 4
Input X x Y x 3
The U-Net model (Table 2) had no pre-training, and
allowed for the same input resolution changes has the
DeepLabV3+. Encoding/Decoding depth was also
changed according to the experiments. Output classes
and loss techniques were the same has DeepLabV3+.
Table 2: U-Net model parameters.
Parameter Value
Depth W
Classes 4
Input X x Y x 3
Each model is capable of receiving an RGB image in
order to pixel-wise segment for each class, as shown
in Figure 1.
3.2 Dataset Creation
For the generation of the dataset, MoLa-VI, images
of the interior of cars, available in scrap yards and
dealerships, were collected. Two RGB sensors were
used to capture RGB images, with 3264x2448 and
1920x1080 resolutions and an ultrawide field-of-view
ICAART 2021 - 13th International Conference on Agents and Artificial Intelligence
674
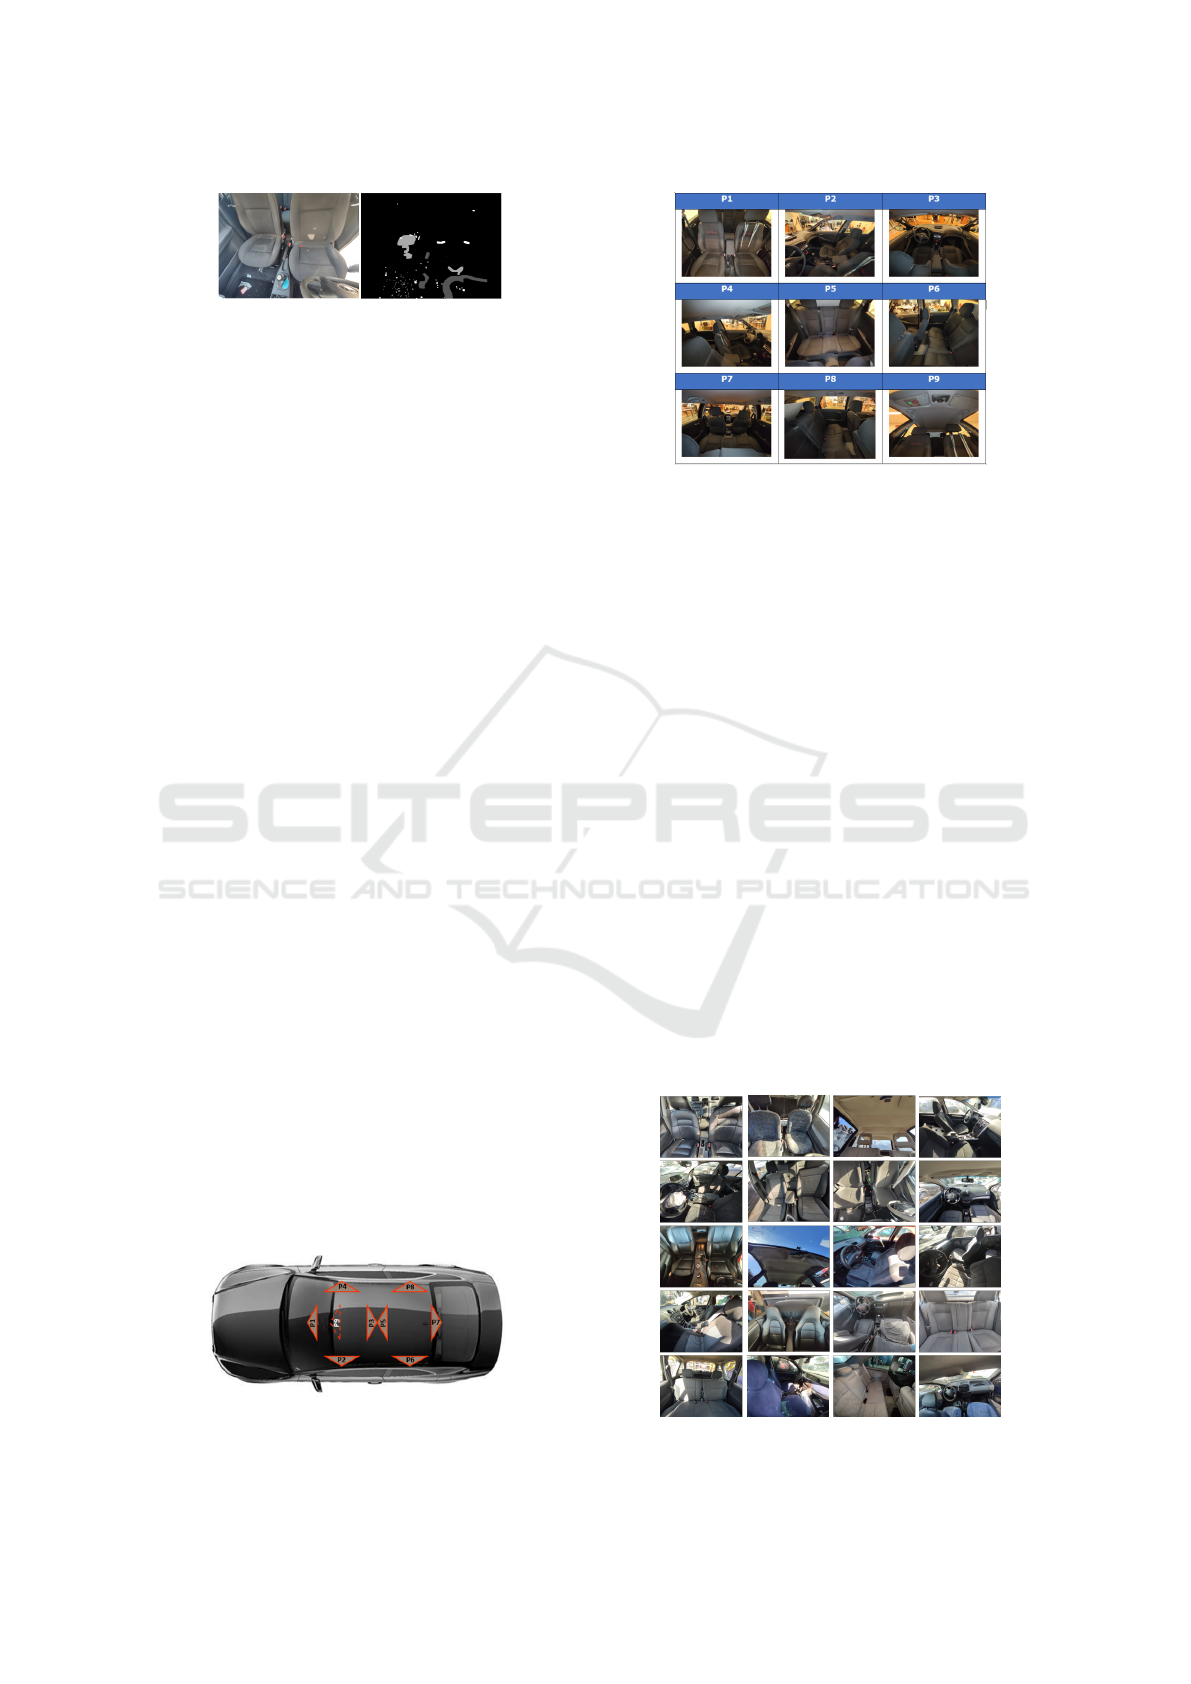
Figure 1: Input and Output images from an inference
pipeline. Left side sample taken from the inside of a car
and used as an input; right side, the inferred image with
good, damage, stain and dirt classes properly identified.
(greater than 110º). The capturing sensor positions
used in each car for the generation of the dataset is
shown in Figure 2. With each being labeled from P1
to P9. Moreover, P1 to P8 represents a downward per-
spective and P9 an upward perspective. The perspec-
tives for all positions, P1 to P9, are shown in Figure
3. In positions P1 and P5, images are captured in 3
different vertical orientations. In total, each car pro-
vides an average of 13 images for each sensor. With
a total of 78 cars, the dataset is comprised by a total
of 1861 images. Of this total, 8 are used cars found
at dealerships (without damage) and the remaining 70
are from scrap yards (with damage).
Dataset car representation is presented below:
• 20 Brands: Renault, Ford, Opel, Fiat, Volvo, Mer-
cedes, BMW, Citroen, Chevrolet, Porsche, Dae-
woo, Subaru, Nissan, VW, Honda, Toyota, Rover,
Lancia, Mazda and Alfa Romeo.
• 9 types of car models: crossover, hatchback, mini-
van, roadster, sedan, SUV and Van.
• The colors of the seats, ceiling and interior plas-
tics vary between: dark blue, black, beige, gray,
dark gray and blue in all cars.
All these data related to the dataset are stored in an
excel.
The images of the dataset were properly organized
by car and sensor position (P1 to P9). For each car,
an extra image of the car exterior is captured, to fa-
cilitate its identification if necessary. An automated
script generated a JSON file, which stores all the in-
formation for each car, such as the number assigned to
the car, brand, model, year, colour, fuel and segmenta-
tion. With this structure, it is possible to increase the
dataset at any time. Figure 4 shows an overview of
some samples from the dataset. In order to provide
Figure 2: Inspection configuration of the cameras used in
each car to generate the MoLa-VI dataset.
Figure 3: Example of perspectives captured by RGB sen-
sors at positions P1 to P9 inside each car.
the dataset with the required segmentation, related
with each captured image, a labelling process was
performed manually for the 1861 images. To perform
this task, the Ground Truth Labeler application, avail-
able in MATLAB version R2019b, was used. The ap-
plication allows you to label data in sequences of im-
ages or videos. When creating the dataset, we chose
to do pixel-wise labeling (Figure 5), as it is the most
versatile class assignment form (i.e. can be expanded
to bounding-boxes, heatmaps, etc). After perform-
ing the labelling process, a mask is created for each
image, in which each class receives a different pixel
id value (Figure 1). For the global process 3 classes
were defined: (damage) representing broken, wear,
and cuts; (stain) representing stained materials; and
(dirt) representing garbage, dirt over materials. More-
over, no size restrictions were defined.
4 EXPERIMENTS
The U-Net and DeepLabV3+ networks were trained
and tested in the Mola-VI, which was splitted for train,
Figure 4: Samples from MoLa-VI dataset.
In-car Damage Dirt and Stain Estimation with RGB Images
675
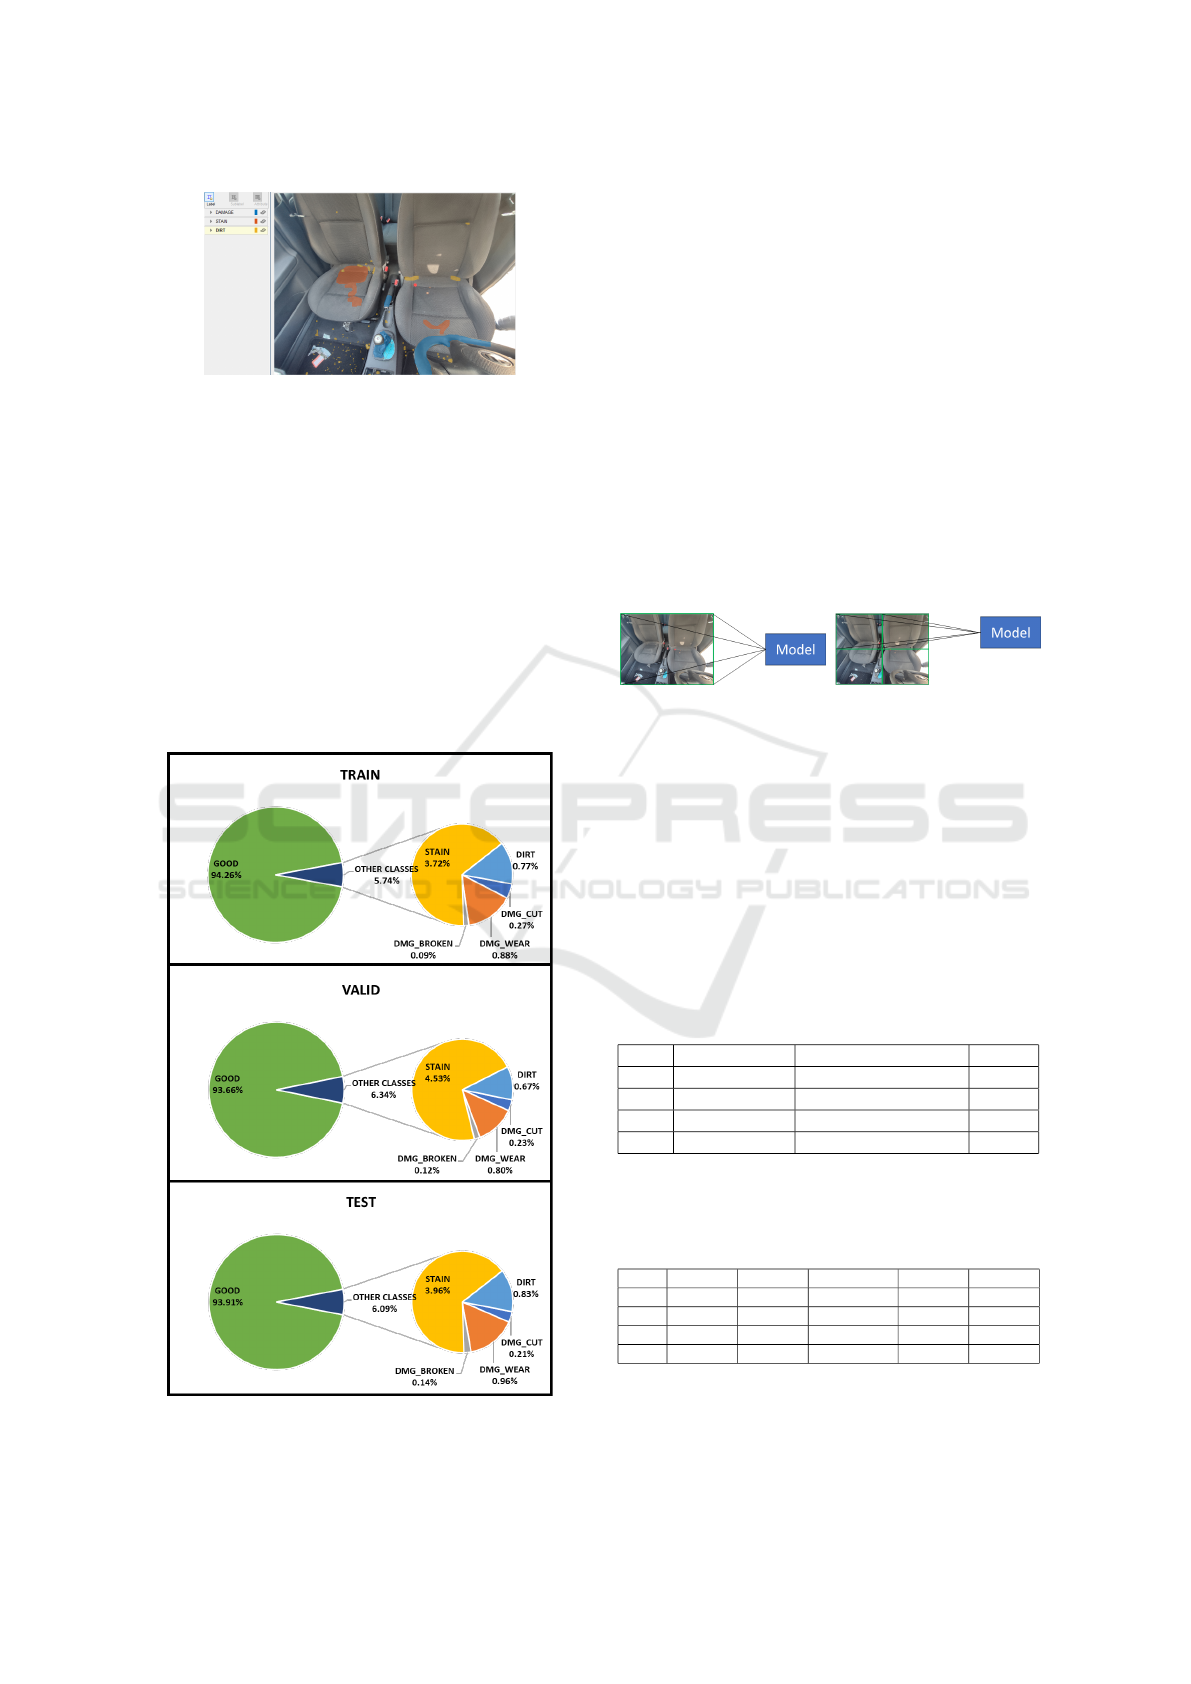
Figure 5: Example of the labelling process performed in the
Ground Truth Labeler application in MATLAB. On the left
side of the figure are the classes created for our dataset, in
which a colour is assigned to each class, then the labelling
process is performed manually with the brush tool in the
image.
valid and test, with a percentage of random samples
of the entire dataset. The division consisted of 70%,
10% and 20%, respectively. Per-pixel class distribu-
tion on each set is shown in Figure 6.
All tests were performed using MATLAB R2019b
source code and performed on an Intel (R) proces-
sor Xeon (R) Gold 6140 CPU 2.30Ghz, with 128GB
RAM and GPU of NVIDIA Tesla V100-PCIE-16GB
computing.
Figure 6: Presentation of the percentages of each class in
each training set.
4.1 Input Configuration
To better understand the best input configuration for
each of the models, two evaluation scenarios were de-
fined, Full and Tiled, for each model, as shown in Fig-
ure 7 and Table 3.
• EV1: Evaluates the DeepLabV3+ model with full
resolution input images at 1080x1920;
• EV2: Evaluates the DeepLabV3+ model input
images at 1200x1200 being tiled to 4 images at
600x600;
• EV3: Evaluates the U-Net model with full resolu-
tion input images at 1080x1920;
• EV4: Evaluates the U-Net model with input im-
ages at 1200x1200 being tiled to 4 images at
600x600;
Figure 7: Full and Tiled evaluations. Left image shows
the full in-car image being feed to the model. Right im-
age shows the full image being splitted in four parts, to be
feed sequentially to the model.
All tests were performed using similar hiper-
parameters: 100 epochs, cross-validation, ADAM op-
timizer, 0.001 learning rate, learning rate drop factor
of 30% at each 10 epochs, and a validation loss pa-
tience of 10 epochs. Batch size for DeepLabV3+ and
U-Net was 2 and 4, respectively. Result are shown in
Table 4.
Table 3: Initial evaluation of DeepLabV3+ and UNET net-
works in our dataset, comparing different configurations of
network input size image.
Model Input Depth
EV1 DeepLabV3+ Full at 1080x1920x3 -
EV2 DeepLabV3+ Tiled at 600x600x3 -
EV3 U-Net Full at 1080x1920x3 3
EV4 U-Net Tiled at 600x600x3 3
Table 4: Input configuration test results for DeepLabV3+
and U-Net. Bold lines represent best results for each model.
Performance is accessed in mean Accuracy (mAC,%), and
individual class accuracy.
mAC GOOD DAMAGE STAIN DIRT
EV1 35.95% 89.62% 6.95% 21.41% 25.87%
EV2 26.10% 91.88% 3.99% 6.48% 2.05%
EV3 29.77% 94,20% 0.25% 24.61% 0%
EV4 27.55% 80.71% 10.86% 15.88% 2.78%
ICAART 2021 - 13th International Conference on Agents and Artificial Intelligence
676
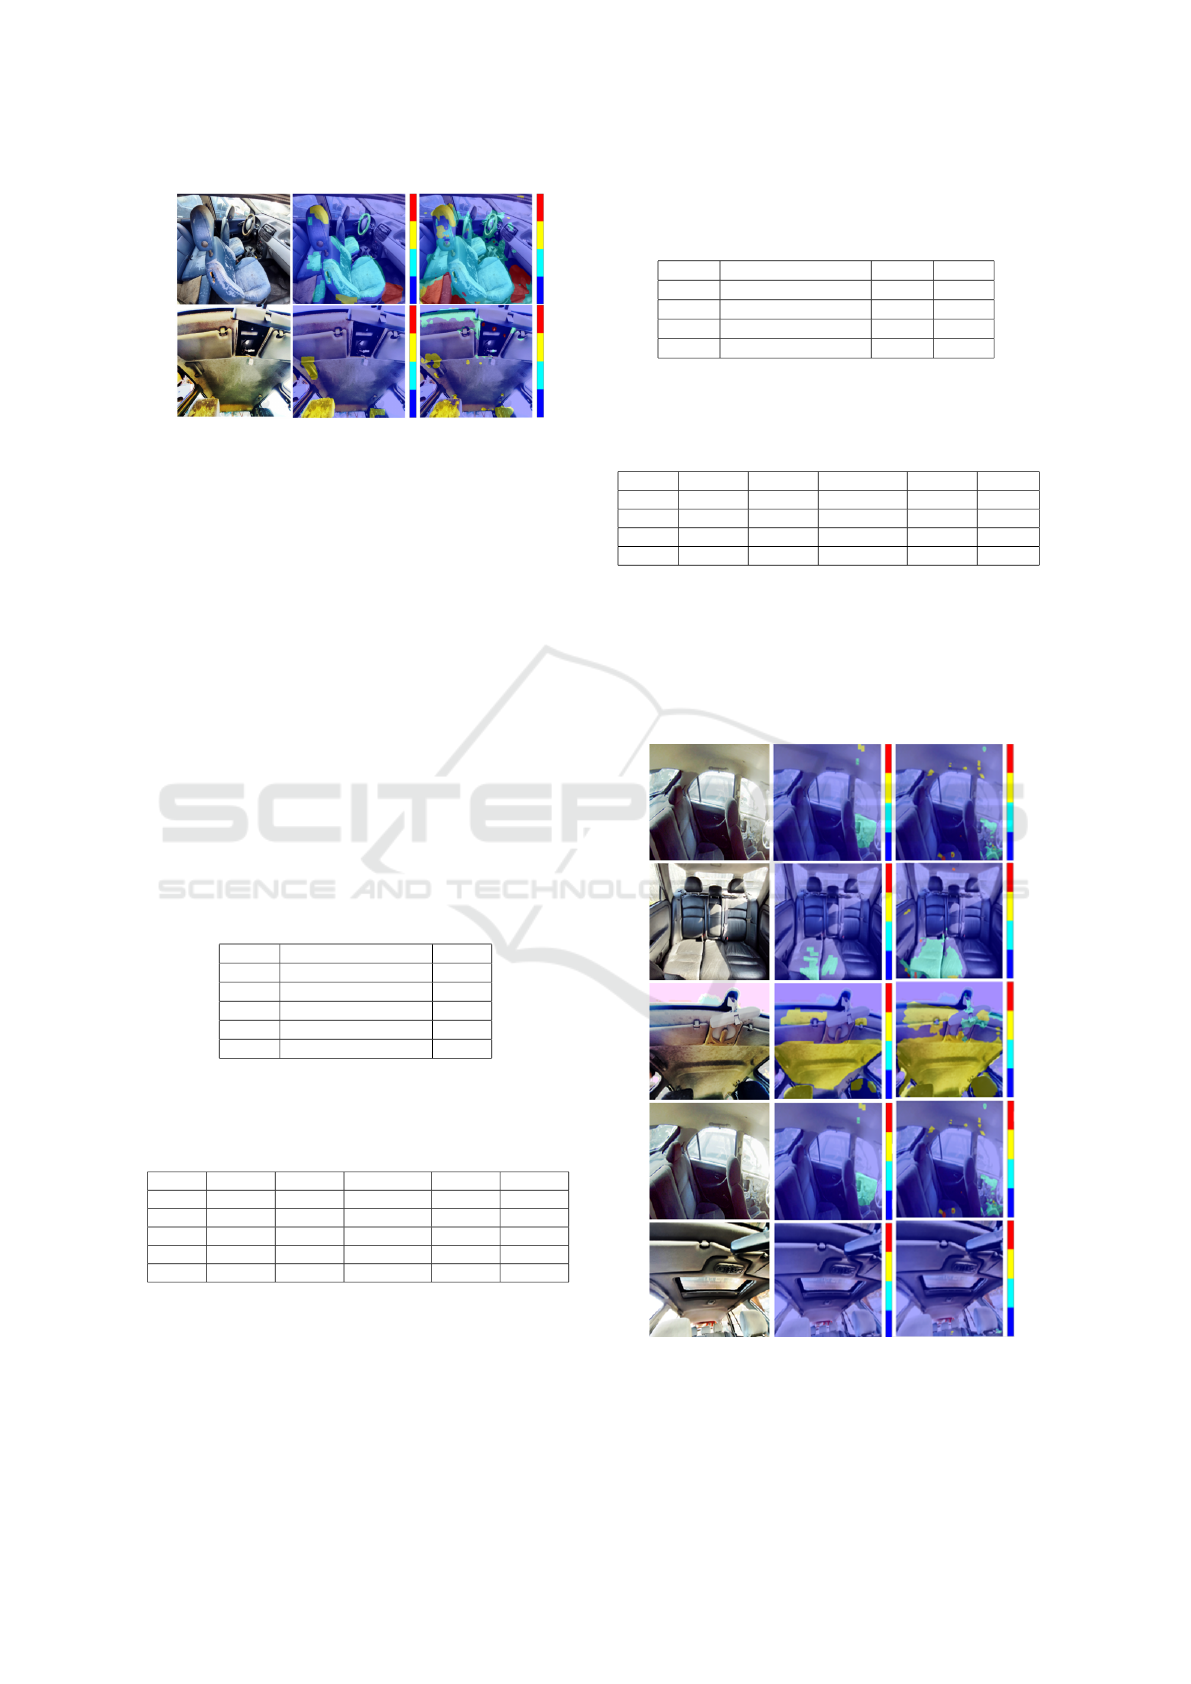
Figure 8: Bad qualitative results of EV1.4. Classes with less
dataset representation show bad generalization results. Left
image represents input image, center image represents la-
beled image, and right image represents inference. (red):
DIRT, (yellow): STAIN, (cyan): DAMAGE, and (blue):
GOOD.
4.2 Ablation and Hyperparameters
After evaluating the results from Table 4, the two best
input configurations from each model were selected,
i.e. EV1 and EV4. Moreover, further ablation and
hyperparameter studies were performed on both. For
DeepLabV3+ extra input size and batch evaluations
were performed (Table 5), iteratively taking into ac-
count their results (Table 6). Qualitative results for
some bad (Figure 8) and good (Figure 9) examples
are shown.
Table 5: Ablation and Hyperparameter study for the
DeepLabV3+ from EV1. Evaluations were performed it-
eratively to find the best values, which are highlighted in
bold.
Input Batch
EV1.1 Full at 1024x1024x3 2
EV1.2 Full at 512x512x3 2
EV1.3 Full at 512x512x3 4
EV1.4 Full at 512x512x3 8
EV1.5 Full at 512x512x3 16
Table 6: Ablation and hyperparameter test results for
DeepLabV3+. Bold line represents best results. Perfor-
mance is accessed in mean Accuracy (mAC,%), and indi-
vidual class accuracy.
mAC GOOD DAMAGE STAIN DIRT
EV1.1 34.03% 92.96% 20.43% 14.62% 8.11%
EV1.2 45.07% 82.62% 29.65% 45.53% 22.47%
EV1.3 60.79% 77.82% 47.06% 58.81% 59.47%
EV1.4 67.60% 77.17% 59.60% 66.81% 68.82%
EV1.5 67.52% 75.05% 62.86% 64.67% 67.54%
For U-Net extra Tiled resolution, depth and batch val-
ues were used and evaluated (Table 7), while taking
into account their results (Table 8). Tiled resolution
of 512x512x3 represents 4 tiles from a 1024x1024x3
input image, and a Tiled resolution of 256x256x3 rep-
resents 16 tiles from a 1024x1024x3 input image.
Table 7: Ablation and Hyperparameter study for the U-Net
from EV4. Evaluations were performed iteratively to find
the best values, which are highlighted in bold.
Input Depth Batch
EV4.1 Tiled at 512x512x3 3 4
EV4.2 Tiled at 256x256x3 3 4
EV4.3 Tiled at 512x512x3 4 4
EV4.4 Tiled at 512x512x3 3 8
Table 8: Ablation and hyperparameter test results for U-
Net. Bold line represents best results. Performance is ac-
cessed in mean Accuracy (mAC,%), and individual class
accuracy.
mAC GOOD DAMAGE STAIN DIRT
EV4.1 27.97% 80.71% 10.86% 15.88% 2.78%
EV4.2 25.18% 96.34% 2.42% 1.56% 0.38%
EV4.3 27.80% 80.56% 12.8% 15.17% 2.67%
EV4.4 28.37% 71.50% 19.24% 18.43% 4.15%
5 DISCUSSION
This paper proposed the use of state-of-the-art seg-
mentation methods to detect damage, stains, and dirt
Figure 9: Good qualitative results of EV1.4. High accuracy
estimation for all classes. Left image represents input im-
age, center image represents labeled image, and right image
represents inference. (red): DIRT, (yellow): STAIN, (cyan):
DAMAGE, and (blue): GOOD.
In-car Damage Dirt and Stain Estimation with RGB Images
677

inside cars. For this purpose, a dataset was created
with images of the interior of 78 cars (total of 1861
images), under different perspectives. Labeling of
good, damage, stain, and dirt classes was performed
manually at pixel-level, for all of the dataset images.
Once the dataset was created, there was a need
to train and evaluate two segmentation methods,
DeepLabV3+ and U-Net, using our dataset.
Initially, the two networks were trained under two
primary approaches, one with Full image as input, and
the other with Tiled patches of an image. Results (Ta-
ble 4) showed that DeepLabV3+ achieves higher ac-
curacy when using Full image, EV1, in contrast U-
Net performed better with Tiles, EV4. From these
two methodologies, an ablation and hyperparameter
study was carried out (Tables 5 and 7) for each one,
to achieve the best possible accuracy. Results showed
(Table 8) that U-Net achieved highest accuracy in
EV4.4, with Tiled input at 512x512x3, depth 3 and
batch 8, reaching 28.37%, 71.50%, 19.24%, 18.43%,
and 4.15% for mean, good, damage, stain and dirt ac-
curacy, respectively. Moreover, DeepLabV3+ outper-
formed U-Net considerably in EV1.4 (Table 6), with
Full image input at 512x512x3 and batch 8, reaching
67.60%, 77.17%, 59.60%, 66.81%, and 68.82% for
mean, good, damage, stain and dirt accuracy, respec-
tively. Regarding DeepLabV3+, after a brief com-
parison between options of input resolutions, it was
concluded that the approach that obtained the best
metrics was the 512x512x3 instead of 1024x1024x3,
is influenced by the loss of class pixel information
when reducing resolution, thus helping in training
convergence (Figure 9). Although the class estima-
tion is generally good, sometimes there is a swapped
between the damaged classes (Figure 8) when the
distinction among them is not so apparent, in real-
ity, even the visual distinction for humans is difficult
since the appearance of some classes can be very sim-
ilar depending on the type of fabric.
In the case of U-Net, despite the ablation study
and the different training being also carried out, it was
found that in this type of approach and study, this net-
work presents a much lower accuracy in relation to
DeepLabV3+.
6 CONCLUSIONS AND FUTURE
WORK
In this paper, we have shown how to repurpose two
deep learning segmentation methods, for the task of
estimating in-vehicle defects. The objective of such
study is to investigate and monitor the integrity of the
interior of the car in terms of Damage, Stain, and Dirt
that may appear with the use of the car interior space
by passengers. This paper presents the creation of an
in-car dataset, Mola-VI, with images of the interior of
cars.
For this purpose, DeepLabV3+ and U-Net were
trained. The DeepLabV3+ method showed the best
results, with 67.60% mean accuracy, being presented
as a good solution for future implementations in in-
vehicle defect detection. U-Net showed to be more
difficult to develop for this use-case, showing mean
accuracy values around 28%, in all evaluation scenar-
ios.
For future work, we intend to expand the in-car
dataset, trying to add more samples and more diver-
sity at the level of cars and classes found in this con-
text. In addition, we also intend to try other networks
and methods for evaluating this issue in our in-car
dataset.
ACKNOWLEDGEMENTS
This work is supported by: European Structural
and Investment Funds in the FEDER component,
through the Operational Competitiveness and Interna-
tionalization Programme (COMPETE 2020) [Project
nº 039334; Funding Reference: POCI-01-0247-
FEDER-039334].
REFERENCES
Bochkovskiy, A., Wang, C.-Y., and Liao, H.-Y. M. (2020).
YOLOv4: Optimal Speed and Accuracy of Object De-
tection.
Borges, J., Oliveira, B., Torres, H., Rodrigues, N., Queir
´
os,
S., Shiller, M., Coelho, V., Pallauf, J., Brito, J. H.,
Mendes, J., and Fonseca, J. C. (2020). Automated
generation of synthetic in-car dataset for human body
pose detection. In VISIGRAPP 2020 - Proceedings of
the 15th International Joint Conference on Computer
Vision, Imaging and Computer Graphics Theory and
Applications, volume 5, pages 550–557. SciTePress.
Borges, J., Queir
´
os, S., Oliveira, B., Torres, H., Rodrigues,
N., Coelho, V., Pallauf, J., Brito, J. H. H., Mendes, J.,
and Fonseca, J. C. (2021). A system for the generation
of in-car human body pose datasets. Machine Vision
and Applications, 32(1):1–15.
Chen, L.-C., Zhu, Y., Papandreou, G., Schroff, F., and
Adam, H. (2018). Encoder-decoder with atrous sep-
arable convolution for semantic image segmentation.
In The European Conference on Computer Vision
(ECCV).
Furtado, H., Gonc¸alves, M., Fernandes, N., Paulo, ., and
Gonc¸alves, S. (2001). Estudo dos Postos de Trabalho
de Inspecc¸
˜
ao de Defeitos da Industria T
ˆ
extil. Techni-
cal report.
ICAART 2021 - 13th International Conference on Agents and Artificial Intelligence
678

Girshick, R. (2015). Fast r-cnn. In The IEEE International
Conference on Computer Vision (ICCV).
Girshick, R., Donahue, J., Darrell, T., and Malik, J. (2014).
Rich feature hierarchies for accurate object detection
and semantic segmentation. In The IEEE Conference
on Computer Vision and Pattern Recognition (CVPR).
He, K., Zhang, X., Ren, S., and Sun, J. (2016). Deep resid-
ual learning for image recognition. Proceedings of the
IEEE Computer Society Conference on Computer Vi-
sion and Pattern Recognition, 2016-December:770–
778.
Hu, G. H. (2014). Optimal ring Gabor filter design for tex-
ture defect detection using a simulated annealing al-
gorithm. In Proceedings - 2014 International Confer-
ence on Information Science, Electronics and Electri-
cal Engineering, ISEEE 2014, volume 2, pages 860–
864. Institute of Electrical and Electronics Engineers
Inc.
Jeyaraj, P. R. and Samuel Nadar, E. R. (2019). Computer vi-
sion for automatic detection and classification of fab-
ric defect employing deep learning algorithm. Inter-
national Journal of Clothing Science and Technology.
Jing, J., Zhang, H., Wang, J., Li, P., and Jia, J. (2013). Fabric
defect detection using Gabor filters and defect classi-
fication based on LBP and Tamura method. Journal
of the Textile Institute, 104(1):18–27.
Liu, J., Yang, W., and Dai, J. (2010). Research on thermal
wave processing of lock-in thermography based on
analyzing image sequences for NDT. Infrared Physics
and Technology, 53(5):348–357.
Liu, L., Zhang, J., Fu, X., Liu, L., and Huang, Q. (2019).
Unsupervised segmentation and elm for fabric defect
image classification. Multimedia Tools and Applica-
tions, 78(9):12421–12449.
Montanini, R. (2010). Quantitative determination of subsur-
face defects in a reference specimen made of Plexiglas
by means of lock-in and pulse phase infrared thermog-
raphy. Infrared Physics and Technology, 53(5):363–
371.
Redmon, J., Divvala, S., Girshick, R., and Farhadi, A.
(2016). You only look once: Unified, real-time ob-
ject detection. In Proceedings of the IEEE Computer
Society Conference on Computer Vision and Pattern
Recognition, volume 2016-Decem, pages 779–788.
Redmon, J. and Farhadi, A. (2017). Yolo9000: Better,
faster, stronger. In The IEEE Conference on Computer
Vision and Pattern Recognition (CVPR).
Redmon, J. and Farhadi, A. (2018). YOLOv3: An Incre-
mental Improvement.
Ren, S., He, K., Girshick, R., and Sun, J. (2016). Faster
r-cnn: Towards real-time object detection with region
proposal networks. In Cortes, C., Lawrence, N. D.,
Lee, D. D., Sugiyama, M., and Garnett, R., editors,
Advances in Neural Information Processing Systems
28, pages 91–99. Curran Associates, Inc.
Ronneberger, O., Fischer, P., and Brox, T. (2015). U-
net: Convolutional networks for biomedical image
segmentation. In Lecture Notes in Computer Science
(including subseries Lecture Notes in Artificial Intel-
ligence and Lecture Notes in Bioinformatics), volume
9351, pages 234–241. Springer Verlag.
SchulzMirbach, H. (1996). Technische Universit
at Hamburg-Harburg Ein Referenzdatensatz zur
Evaluierung von Sichtpr ufungsverfahren f ur Tex-
tilober achen. page 11.
Torres, H. R., Oliveira, B., Fonseca, J., Queirós,
S., Borges, J., Rodrigues, N., Coelho, V., Pallauf, J.,
Brito, J., and Mendes, J. (2019). Real-Time Human
Body Pose Estimation for In-Car Depth Images. In
IFIP Advances in Information and Communication
Technology, volume 553, pages 169–182. Springer
New York LLC.
Yapi, D., Allili, M. S., and Baaziz, N. (2018). Automatic
Fabric Defect Detection Using Learning-Based Lo-
cal Textural Distributions in the Contourlet Domain.
IEEE Transactions on Automation Science and Engi-
neering, 15(3):1014–1026.
In-car Damage Dirt and Stain Estimation with RGB Images
679
