
Smartphone Glass Inspection System
Sergey Turko
1
, Liudmila Burmak
1
, Ilya Malyshev
1
, Stanislav Shtykov
1
, Mikhail Popov
1
,
Pavel Filimonov
2
, Alexandr Aspidov
1,2
and Andrei Shcherbinin
1
1
Samsung R&D Institute Russia, 12 Dvintsev Str., Moscow, Russia
2
Bauman Moscow State University, 5 2
nd
Baumanskaya Str., Moscow, Russia
Keywords:
Glass Inspection, Optical Inspection, Dark-field Imaging, U-Net, Imbalanced Data, Nested Weights, Semantic
Segmentation, Image Processing.
Abstract:
In this paper we address the problem of detection and discrimination of defects on smartphone cover glass.
Specifically, scratches and scratch-like defects. An automatic detection system which allows to detect
scratches on the whole surface of a smartphone’s cover glass without human participation is developed. The
glass sample is illuminated sequentially from several directions using a special ring illumination system and
a camera takes a dark-field image at each illumination state. The captured images show a variation of the
defect image intensity depending on the illumination direction. We present a pipeline of detecting scratches
on images obtained by our system using convolutional neural networks (CNN) and particularly U-net-like
architecture. We considered the scratch detection problem as a semantic segmentation task. The novel loss
technique for solving the problem of imbalance, sparsity and low representability of data is presented. The
proposed technique solves two tasks simultaneously: segmentation and reconstruction of the provided im-
age. Also, we suggest a nested convolution kernels to overcome the problem of overfitting and to extend the
receptive field of the CNN without increasing trainable weights.
1 INTRODUCTION
Currently, visual inspection is the main technique for
detecting macro defects (scratches, scuffs, cracks) on
smartphone cover glasses (Fig. 1) during mass pro-
duction. Quality and speed of visual inspection is
highly dependent on the human factor. Each human
inspector has different experience and visual sensitiv-
ity. So the result of visual inspection is subjective.
Also, in mass production, the sample inspection time
is strongly limited. This leads to defects skipping and
thus low inspection accuracy. Visual inspection re-
quires a lot of human and time resources, which re-
sults in the final product cost increase. Development
and implementation of an automatic inspection sys-
tem that would reduce the inspection time and cost,
increase inspection accuracy and exclude subjectiv-
ity is an actual task and a big challenge. Here, we
present hardware and software solution for automated
smartphone glass inspection. The developed system
provides fast and more objective judgment on a glass
sample quality.
In hardware we used a white light dark-field ap-
proach which is proposed for visual inspection of op-
tical elements in standard [ISO 14997:2017 Optics
Figure 1: Smartphone cover glass. Image is taken from
[htt ps : //www.ushio.co. jp].
and photonics — Test methods for surface imperfec-
tions of optical elements] as the most appropriate for
tiny defect detection. In our system glass sample is il-
luminated sequentially from different directions and a
dark-field image is taken at each state of illumination.
The captured images show a variation of the defect
image intensity depending on the direction of illumi-
nation.
Inspired by recent success of CNNs in many tasks,
we utilize artificial intelligence for our image process-
ing solution. Images obtained in our setup are pro-
Turko, S., Burmak, L., Malyshev, I., Shtykov, S., Popov, M., Filimonov, P., Aspidov, A. and Shcherbinin, A.
Smartphone Glass Inspection System.
DOI: 10.5220/0010223306550663
In Proceedings of the 13th International Conference on Agents and Artificial Intelligence (ICAART 2021) - Volume 2, pages 655-663
ISBN: 978-989-758-484-8
Copyright
c
2021 by SCITEPRESS – Science and Technology Publications, Lda. All rights reserved
655

vided to the CNN input. As output, CNN produces a
probability map of scratches. In most cases, scratches
occupy a very small sample area, below 0.1%. In or-
der to train a network with such extremely imbalanced
data, we introduce special loss techniques. Then to
aggregate pixels in a consistent object, we used a clas-
sification method like DBSCAN (Ester et al., 1996).
Below, we present a detailed description of our op-
tical system, type of data and related problems, net-
work architecture and software solutions.
2 RELATED WORK
In recent years, many machine vision systems for
fast automatic glass surface inspection have been pro-
posed. Most of them utilize dark-field imaging.
For example (Tao et al., 2015), combined dark-
field and bright-field imaging for inspection of large
aperture optical components are used. Dark-field
imaging system consists of linear light source and
line scan camera. It fastly scans the whole area of
the inspected sample and detects possible defects’ lo-
cation. After the dark-field scanning is finished, a
bright-field imaging system comprising coaxial light
source and area camera with microscopic lens moves
sequentially to the coordinates of possible defects and
takes a magnified bright-field images. These images
are used for defects measuring and classification. The
system is capable of defect and dust distinction, no
information about distinguishing between defects and
stains is provided. The second pass to capture micro-
scopic images may take too long (especially if there
are many defects), which is unacceptable for mass
production. Besides, weak scratches are barely vis-
ible in bright-field images. Later authors (Tao et al.,
2016) use only dark-field approach accompanied by
air dust/fiber remover and morphological features for
stain/scratch/residual dust distinguishing.
Another approach to inspection system illumina-
tion which is partially based on dark-field is demon-
strated (Yue et al., 2019). The authors use patterns of
bright and dark fringes as a source of diffused light
and analyze the modulation of light reflected from the
inspected specular surface. The article describes the
possibility of defects and contaminants detection us-
ing this method but not distinguishing between them.
It is hard to evaluate the sensitivity of this system as
the authors use scratch samples with substantial depth
of 2 µm.
Dark-field based approach is described in litera-
ture (Sch
¨
och et al., 2018). The system comprises a
dome of LEDs over a sample in the center and an area
camera. The dome with camera can rotate around
sample in two orthogonal axes. The system is de-
signed to inspect small flat or curved optical compo-
nents and does not allow to distinguish real defects
from dust and stains.
Among commercially available inspection equip-
ment, AGROS system from Dioptic (Etzold et al.,
2016) and OptiLux SD from RedLux Ltd. (RedLux,
2005) can be highlighted. Both apply dark-field ap-
proach. AGROS system comprises dome-shaped il-
luminators including individually enabled LEDs with
line or area cameras. The system is available in dif-
ferent implementations and mainly operates with ro-
tationally symmetric flat or curved optical compo-
nents. OptiLux system consists of uniform dome-
shaped LED illuminator and area camera and operates
with flat surfaces. Both systems use only morpholog-
ical features analysis and therefore have limitations in
terms of defects and surface contaminations distinc-
tion. Dioptic declares detection of defects and con-
taminations without specifying defects and contami-
nation types.
All aforementioned systems are not suitable for
fast automated inspection in smartphone cover glass
mass production. They are either too slow, or not
sensitive enough, or do not reliably distinguish real
defects from contaminants. The latter is especially
important. Even human inspectors experience diffi-
culties with distinguishing between real defects and
contaminants. They use mechanical wiping for this
purpose, which can produce additional defects. In
this paper, we present feasible solution for fast auto-
mated non-contact smartphone cover glass inspection
allowing distinguish real defects from contaminants
reliably enough. It utilizes the principle of directional
light scattering on real defects to highlight scratches
on dark field images.
In tasks of detecting and discriminating defects in
images two categories of algorithms are usually used.
The first one is algorithms based on neural networks,
and another is handcrafted algorithms, which usually
used with classical machine learning.
In work (Wang et al., 2019a) a double threshold
segmentation algorithm based on area threshold and
gray threshold is presented to extract defects from
background. Then for each defect the features of
shape and geometry are calculated. Based on these
features a binary tree classifier is constructed to clas-
sify defects. Coarse-to-fine strategy for the detection
of weak scratches in dark-field images of optical ele-
ments is proposed (Tao et al., 2016). Detected pos-
sible scratch segments are connected into complete
scratches by line segment detector, defects are classi-
fied by GIST (Torralba et al., 2006) features. Another
method (Jiang et al., 2018) suggests a multi-scale line
ICAART 2021 - 13th International Conference on Agents and Artificial Intelligence
656
detector, which combines all recalls at different scales
and then utilizes morphological operations to get the
full consistent area of scratches.
Another pool of algorithms comprises neural net-
work approach. One of them (Tao et al., 2018) pro-
poses a cascaded autoencoder designed for localiza-
tion of defects on the metallic surfaces. The output is
a probability mask based on semantic segmentation.
Then, it leverages compact CNN, which executes fi-
nal classification. Recent work (Song et al., 2019)
solves the tasks of scratch detection on metal surfaces
as semantic segmentation task, utilizing deep CNN.
It uses U-net-based (Ronneberger et al., 2015) archi-
tecture. Another one (Yuan et al., 2018) focused on
defects of an infrared radiation hole of a smartphone
glass. It also consider this task as semantic segmen-
tation problem. They propose a generation process of
data based on generative adversarial networks (Good-
fellow et al., 2014) for extending a training set.
Handcrafted and machine learning algorithms do
not have enough accuracy and are not flexible, more-
over the proceeding time depends on the amount of
defects and sometimes it achieves significant time.
Moreover, changes in technical production may lead
to changes in the types of defects, which will make it
necessary to change the algorithm. In the case of neu-
ral networks, all you need to do is gather a dataset and
train the model. We have made our choice in favor
of neural networks and based on the previous experi-
ences developed our own CNN which we adjusted for
solving problem related with specific of our tasks and
problems.
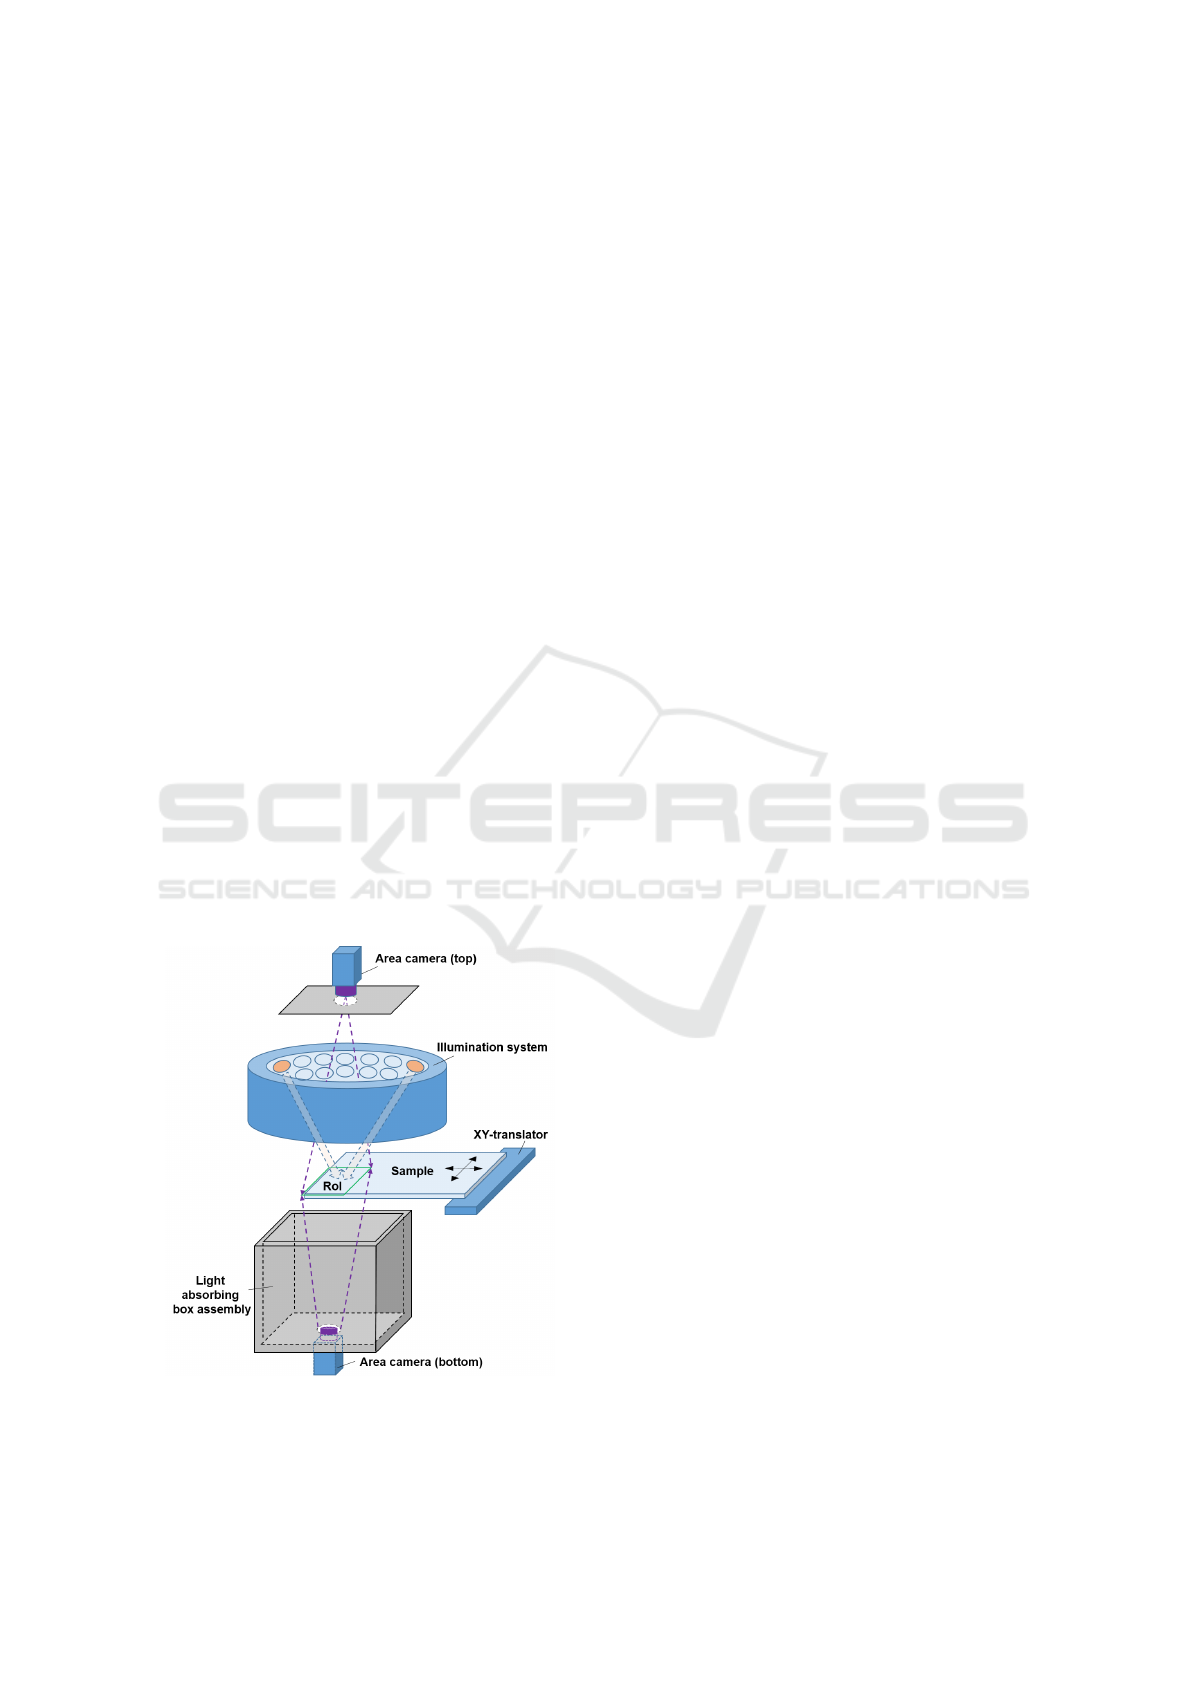
Figure 2: Layout of inspection system hardware.
3 SYSTEM SETUP DESCRIPTION
The developed inspection system is based on the
principle of darkfield imaging, i.e. observation of
scattered light from inhomogeneities of fine polished
transparent optical elements. The system layout is
shown on the Fig. 2. It comprises area cameras with
lens, an illumination system (ring-shape illuminator)
consisting of several paired opposite LED groups, a
light absorbing box assembly and two-coordinate XY -
translator for an inspected sample providing its trans-
lation for zone-by-zone inspection. Both transmission
and reflection layouts are available, but it was found
that in case of curved edge samples transmission lay-
out is more preferable due to less parasitic glare on
images.
Illumination system consequently switches on and
off opposite LED groups arranged in a circle provid-
ing discrete change of illumination direction. LEDs
in a group are designed in such a way to ensure illu-
mination uniformity at inspected zone (region of in-
terest, RoI) in each state of illumination. Cameras are
triggered by illuminators and capture one dark-field
image of a inspected sample’s RoI in each state of
illumination. Light absorbing box assembly blocks
both a parasite light from illumination system to cam-
era and a scattered light from mechanical parts of the
system hardware to enhance image contrast.
On a dark-field image, a smooth inspected surface
without any defects looks almost black since specu-
lar reflection is directed out of the camera aperture.
In case of an irregularity on the surface which scat-
ters light into the camera, it appears bright. The volu-
metric distribution of light scattering on irregularities
correlates with its topography and direction of illumi-
nation. Usually contaminants scatter light uniformly
in all directions, while scattering on scratches is more
directional. Therefore, scratches on dark-field images
in our system will be either brighter or weaker de-
pending on the direction of illumination and its pro-
file. For the most common scratches with “triangular”
surface profile, the highest brightness is obtained at
lighting direction perpendicular to the scratch. How-
ever, scratches with a “rugged” profile shows more
specific brightness variation vs illumination direction.
Consequently, a higher brightness variation of scat-
tered light from a defect vs. illumination direction is
the key feature we used to distinguish scratches from
other types of defects.
Fig. 3 shows the typical scattered light intensity
variation depending on illumination angle for main
defects and contaminants image points. These graphs
were obtained experimentally by rotating the illumi-
nator around a sample located in the center with 2
◦
ro-
Smartphone Glass Inspection System
657
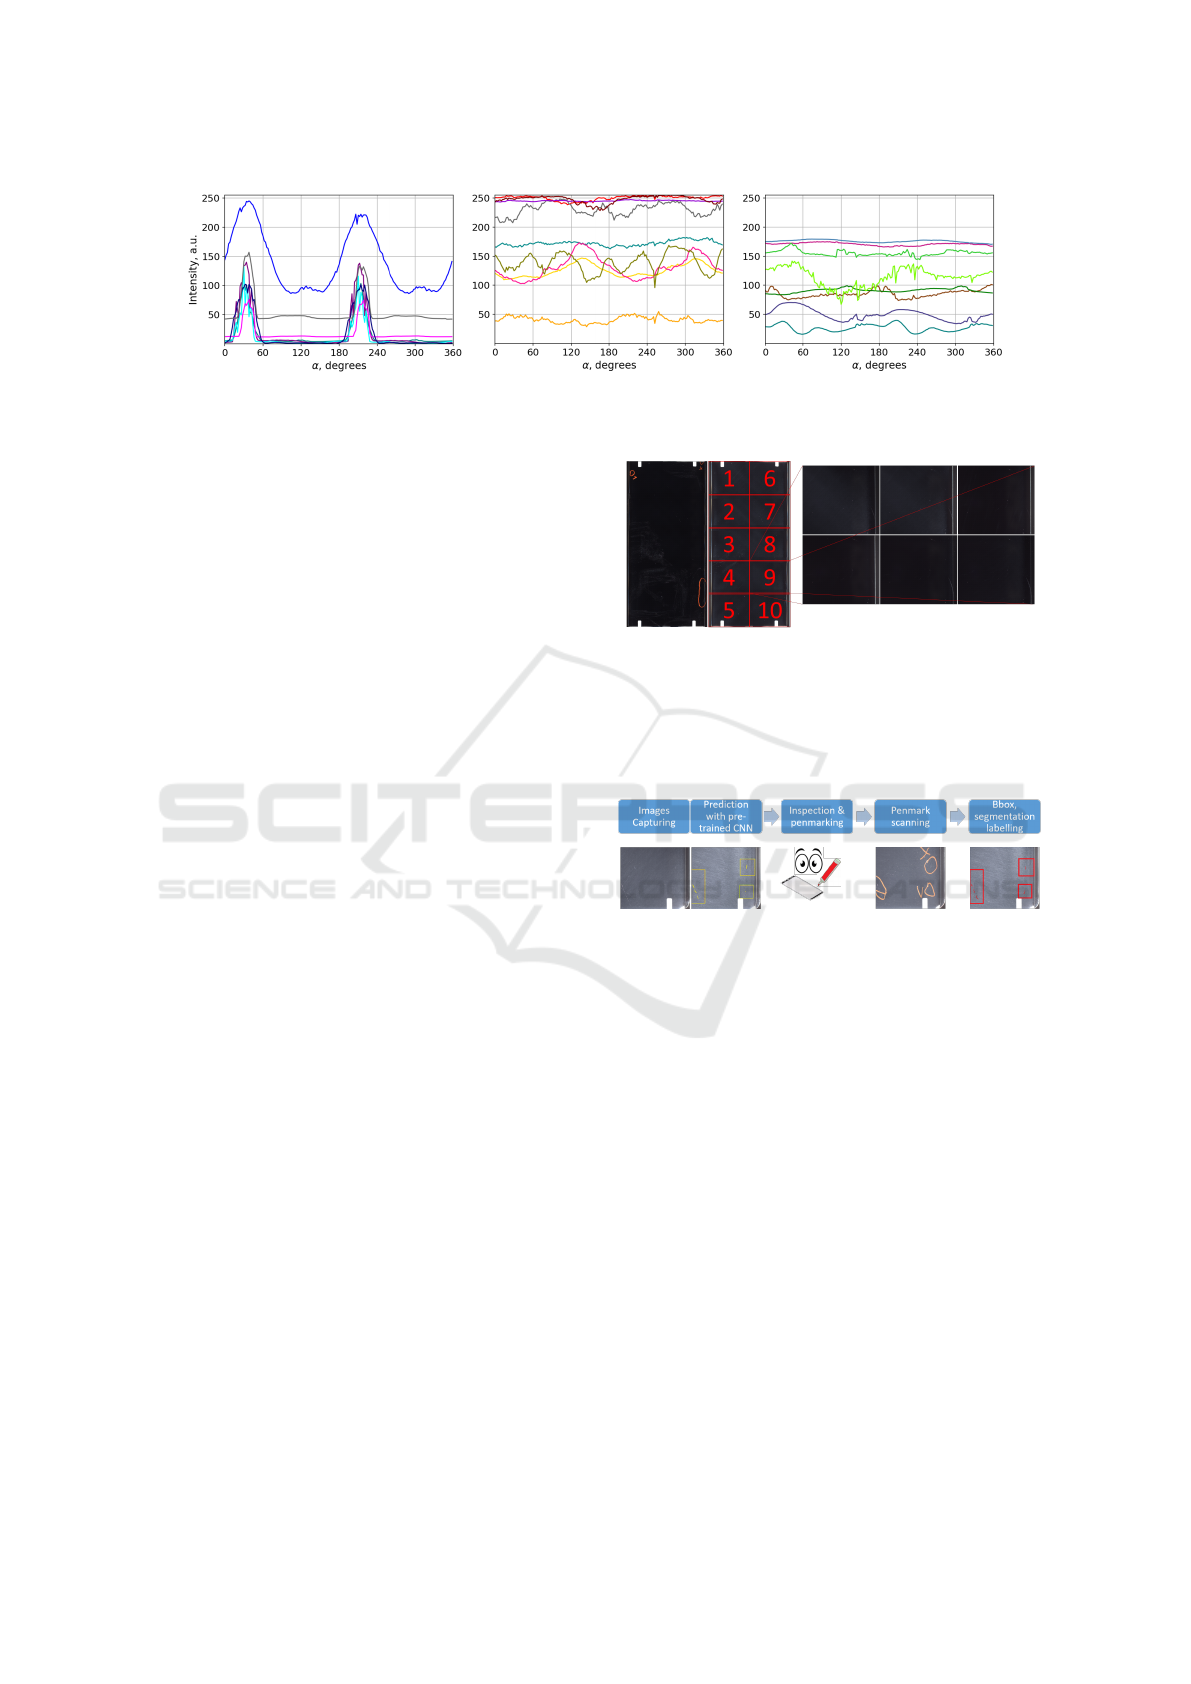
Figure 3: Intensity of defects and contaminants image points vs angular direction of illumination: scratch (left), dust (center),
stain (right).
tation step. The general behavior most of the defects
corresponds to the presented plots: scratches show
sharp intensity modulation peaks; dust and stains have
weak intensity modulation and are often oversatu-
rated. These graphs can be used as a design rules for
illumination system configuration – number of direc-
tions and lamps, collimation.
In our system, the ring-shaped illumination sys-
tem is custom-designed and comprises 12 tilted
facets, i.e. 6 pairs of opposite facets arranged in a cir-
cle with a constant angular pitch. Each facet consists
of 3 rows and 3 columns (9 totally) of white LEDs.
Each LED has 3W power and 25
◦
±3
◦
FWHM of an-
gular distribution (collimated for better system effi-
ciency). Number of LED groups was chosen to fit
the required inspection time, size of RoI and system
dimensions. Both transmission and reflection optical
layouts use color cameras and lenses of 35 mm fo-
cal length. The sample inspected zone size (RoI) is
40x35 mm
2
. It was defined by required system reso-
lution and dimensions.
The developed inspection system is able to detect
typical scratches with dimensions of order of microns
(>1 µm) width and tens nanometers (>30 nm) depth.
4 DATASET DESCRIPTION
In our system, there are 10 RoIs in the sample, which
are inspected sequentially (see Fig. 4). Sample is
moving in XY direction by the translator. 6 images
with different illumination directions are captured by
camera in each sample’s position. To avoid problems
of non-robust predictions on images near the edge ev-
ery zone overlapped on ∼256 pixels (∼2 mm).
In order to train CNN model, high quality la-
beled dataset with different types of possible defects
is needed. Dataset gathering process is illustrated in
Fig. 5. It includes following steps. First of all, an
image of a clean sample after washing and drying is
captured. Next, the baseline model predicts possible
defects and shows the result to the skilled human in-
Figure 4: Illustration of capturing process.
spector. Then a human inspector checks the entire
sample and regions with the predicted possible de-
fects and marks found real defects on sample with pen
marker.
Figure 5: Illustration of labeling process.
It sometimes happened that the thin scratches were
not recognized by the human eye, but in the images
from our inspection system they were clearly seen.
Since the sample can be rejected from the produc-
tion line for even one scratch and skipping defects
is not allowed, we needed to reduce the number of
non-labeled true defects. For such cases we wiped a
sample to see if the possible defect is gone or not and
sometimes used a microscope to check it. This step
increases labeling quality - false positive defects are
eliminated at this stage. Labeling time ranged from 1
minute in simple cases up to 10 minutes in complex
ones. In contentious cases with microscope measure-
ments labeling time sufficiently increased up to 30
minutes per sample.
After human inspection the image of glass sam-
ple with marked real defects is captured and labeled
manually with bounding boxes using labeling soft-
ware. High precision of moving translator guarantees
repeatable position between two captured images (be-
fore and after human inspection) with sufficient toler-
ICAART 2021 - 13th International Conference on Agents and Artificial Intelligence
658
ance and allows using labeling made in the second
image for the first image of clean sample. In the end,
final segmentation masks of scratches are obtained by
merging bounding boxes with masks, obtained by a
pre-trained model.
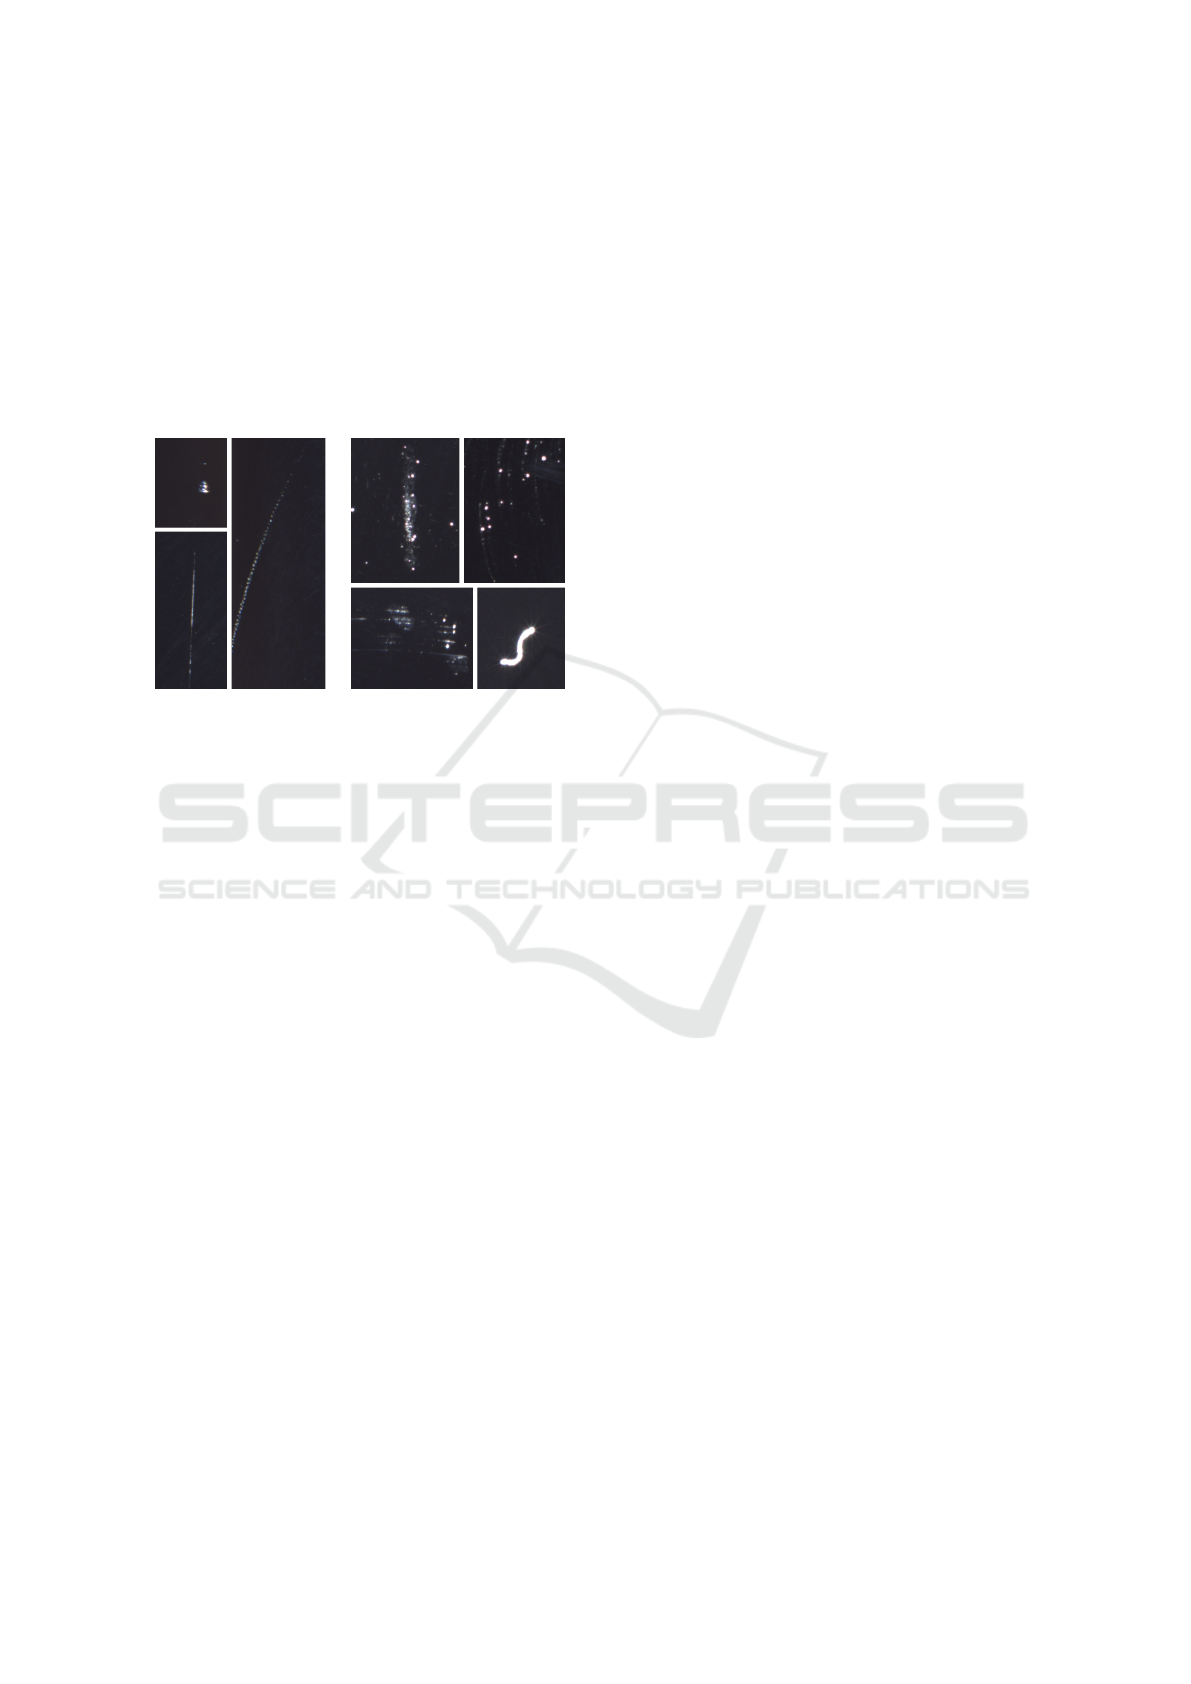
In general, camera captured images and human’s
eye perception have very good correlation that guar-
antees labeling will have relevant accuracy for busi-
ness metrics. Examples of defects are shown on Fig.
6.
Figure 6: Examples of defects, (left) - scratches, (right) -
stains and dust.
The collected dataset contains ∼10000 glass samples
for train (95%) and validation (5%) and additionally
1000 samples for test. Every sample includes 10 se-
ries with 6 RAW 12-bit 3504x3120px images with
Bayer pattern (Bayer, 1976) GRGB. Dataset includes
8735 scratches for train and validation and 391 for
test. The mean relation of scratch area to sample area,
i.e. dataset imbalance, was less than 0.05%.
5 ALGORITHM
Currently there are well working architectures like
DeepLabV3+ (Chen et al., 2018), ResNeSt (Zhang
et al., 2020), HR-Net (Wang et al., 2019b), but we
focus on architecture to check easy interpretable fea-
tures - U-Net (Ronneberger et al., 2015). The U-
Net family becomes classic in semantic segmenta-
tion with a huge number of features that allows it
to train networks with more accurate solutions. U-
Net shows good results in some segmentation tasks of
tiny objects like roads detection on satellite aerial im-
ages (Ulmas and Liiv, 2020), (Venkatesh and Anand,
2019). Additional U-net advantages are flexibility and
a lot of options that allow making experiments.
5.1 Common Architecture
Proposed network consists of encoder and asymmet-
ric decoder. Decoder is usually used for restoring an
accurate segmentation map, but in our case it is more
important to detect the presence of a scratch rather
than its accurate location, so our decoder has lower
number of convolution layers on each level. Encoder
consists of 6 scale levels, including 2, 2, 3, 3, 4, 5
convolution layers with kernel size 3x3 respectively
on each level. It has at each level 96, 128, 196, 256,
512, 768 features respectively. The large amount of
features at the first level is based on requirement large
information capacity of high-resolution images due
to tiny scratch width. Decoder has 192, 96, 48, 24,
8 features respectively and only 2 convolution layers
per level. We used max pooling 2x2 for decreasing
resolution of features and ELU with slope = 1 as ac-
tivation function. Experiments with ReLu activation
showed that most neurons die due training and model
doesn’t converge. The architecture of our model is
presented on Fig. 7. The reason of using tanh as out-
put activation function is described below.
5.2 Nested Weights
As a rule, to make a network to learn more com-
plex tasks, number of model parameters is increased.
On the one hand, large number of weights gives a
large network capacity and ability to learn more com-
plex features, but on the other hand, the model be-
comes prone to overfitting, especially in case of data
with common features and low information content.
Sometimes, it is inevitable if you need to maintain
a high resolution of the input data and to provide a
proper receptive field. In our case, we need to provide
both parameters: high resolution of input images, be-
cause all scratches are very tiny; and receptive field
for processing long scratches or spots that can reach
significant dimensions on the image.
We suggest novel approach with nested weights
of convolution, which helps to solve both described
problems. In our approach each convolution of the
encoder (except for the first two) takes weights from
shared pool of weights. Illustration of this method is
shown on the Fig. 8.
The first convolution converts feature map ten-
sor with depth 256 to tensor with depth 512 and the
second one converts tensor with 512 depth to 512.
Weight’s tensor has shape 256x512xK
2
in the first
case (red line in the picture), and 512x512xK
2
(green
line) for the second case, where K
2
is the kernel size.
Such an approach allows usage a lot of convolu-
tion layers and significantly increases receptive field
Smartphone Glass Inspection System
659
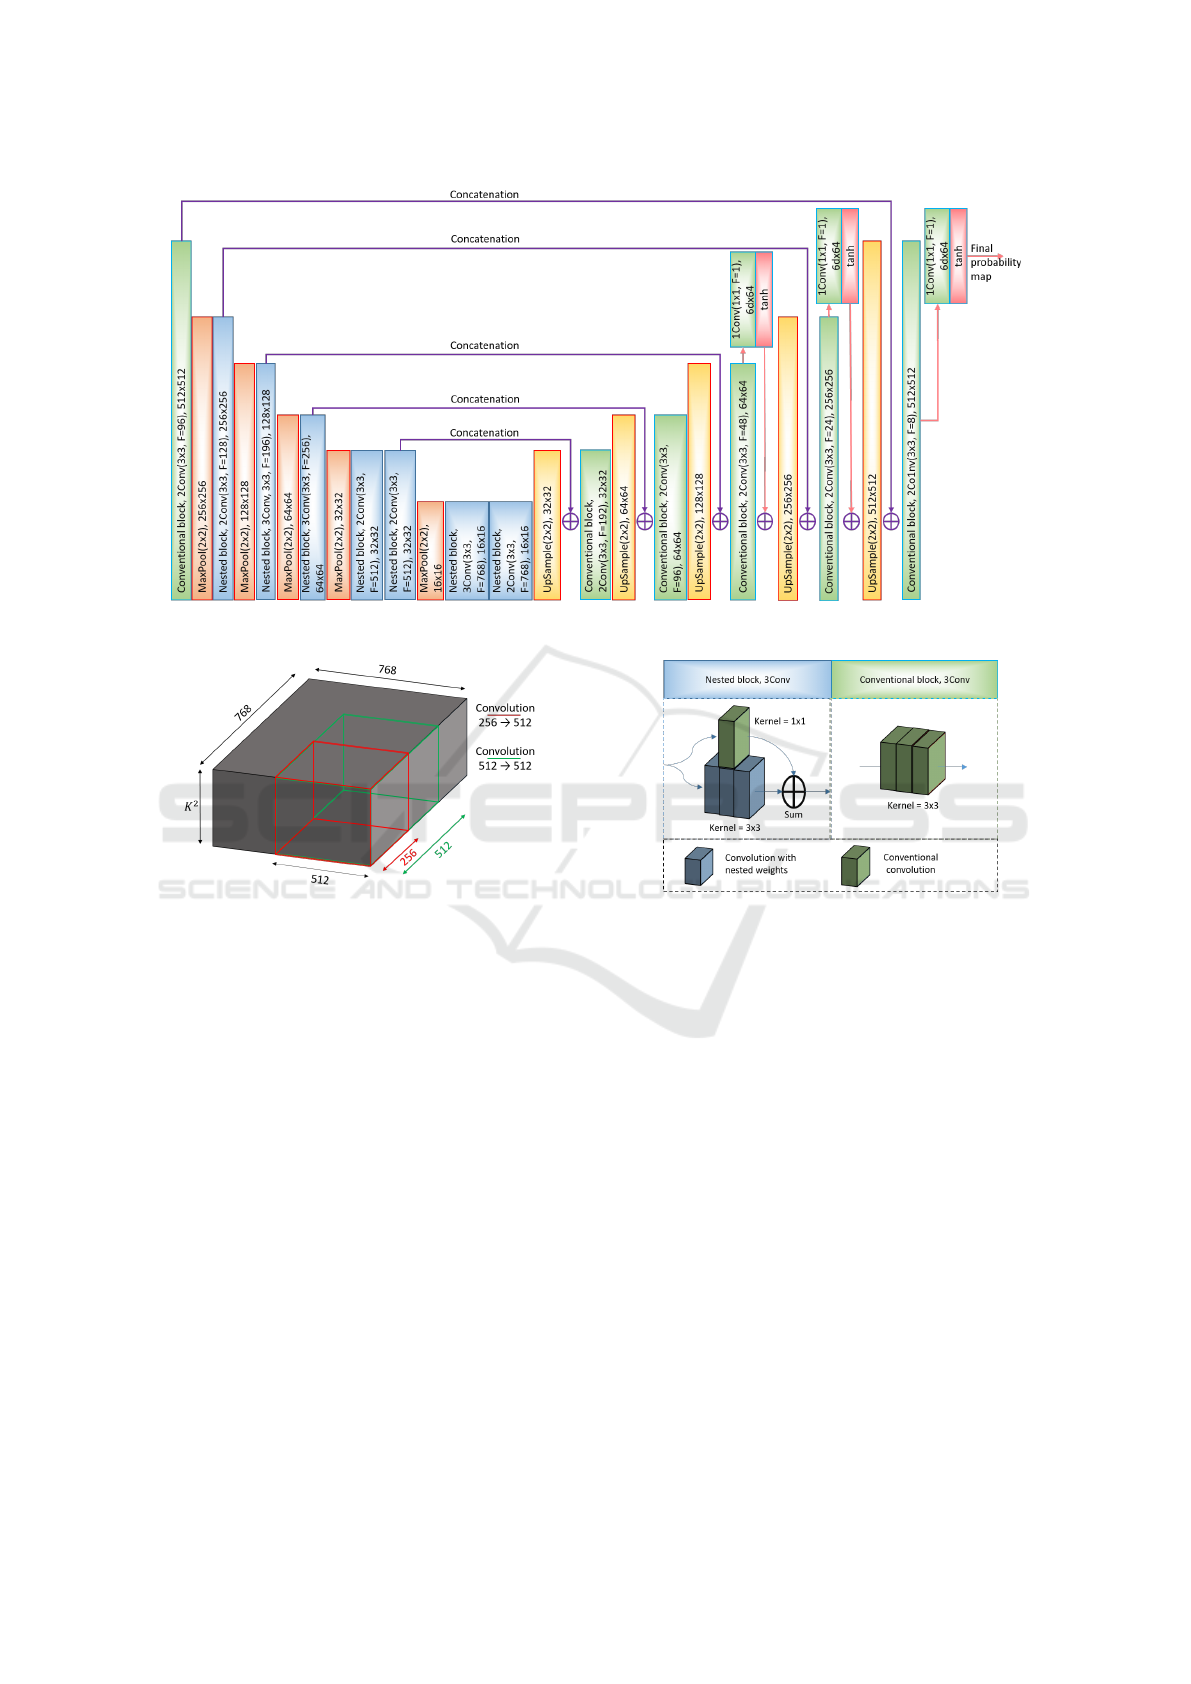
Figure 7: Common architecture of model.
Figure 8: Illustration of applying nested convolution ker-
nels.
without increasing number of weights. Another ad-
vantage of nested convolution layers is consistency of
large-range details (in case of large scratches, this is
highly important). While processing its scale, each
nested kernel provides fractal self-similarity clues for
the next scale. In this way, the same set of kernel
weights could be used for processing different scales
of image.
Also we added ResNet (He et al., 2015) shortcut
connections with 1x1 convolution which apply their
own weights, to reduce training time and to avoid gra-
dient’s vanishing problem. Building blocks of pro-
posed CNN are shown on the Fig. 9.
Eventually, our network with nested weights has
13,9 millions parameters, whereas a network without
nested weights has 44,4 millions parameters.
5.3 Space to Depth
Due to large resolution of our images (input patch
resolution is 1024x1024), to increase receptive field
Figure 9: Building blocks of model.
more, we apply space to depth technique (Sajjadi
et al., 2018), which extracts shifted low-resolution
grids from the image and places them into the channel
dimension. The operator can be described as follows:
S
q
(I)
i,j,k
= I
qi + k%q, qj + (k/q)%q, k/q
2
(1)
where % is modulus and / is integer division.
So, as input we use a patch with size 512x512x24,
where 24 channels are a stack of 6 RAW Bayer im-
ages. In the same time, label ground truth is rescaled
from 1024x1024 to 512x512 with max pooling 2x2.
Eventually, taking in account all convolution layers,
the receptive field covers the whole patch.
5.4 Loss Function
Another problem related to our data is extremely high
imbalance between objects and background. It is not
trivial to make a network to converge with such data.
A network tends to find trivial solution, which is the
image all pixels belong to the background. In this
ICAART 2021 - 13th International Conference on Agents and Artificial Intelligence
660
case to make a model to converge, we have to set the
proper amount of patches with scratches in the batch.
We need at least 15% patches with scratches to obtain
result with binary cross-entropy loss in case of usage
sigmoid as output activation function. But we have a
relation of amount patches with scratches to patches
without scratches is less than 0.01, and in that way we
can’t cover the whole our dataset uniformly.
To avoid these problems, we suggest the novel
“autoencoder L
2
-loss”. We force our network to pre-
dict scratches and also to restore other defects and
background by using tanh activation function. Every-
thing except scratches was restored with an inverse
sign as it increases the gap at feature space between
scratches and other objects. Label ground truth, we
want to restore is:
ˆ
Y =
(
1,i f gt = 0
max
i
I
i
,i f gt = 1
(2)
where I
i
is image of i stage of illumination, gt is bi-
nary mask of scratches; max
i
I
i
is image, where each
pixel is maximum along depth (illumination state) di-
mension.
Then we introduce L
2
= (y −
ˆ
Y )
2
loss striving to
restore the label ground truth.
This approach allows varying the amount of
patches with scratches in batch, and setting it to min-
imal value, to cover more fake-defects (spots, stains,
dust and so on) other than scratches. Now, it’s only
one patch with scratch in the batch. We compared
conventional L
2
loss, binary cross-entropy and our
“auto-encoder” loss. The plots of convergence are
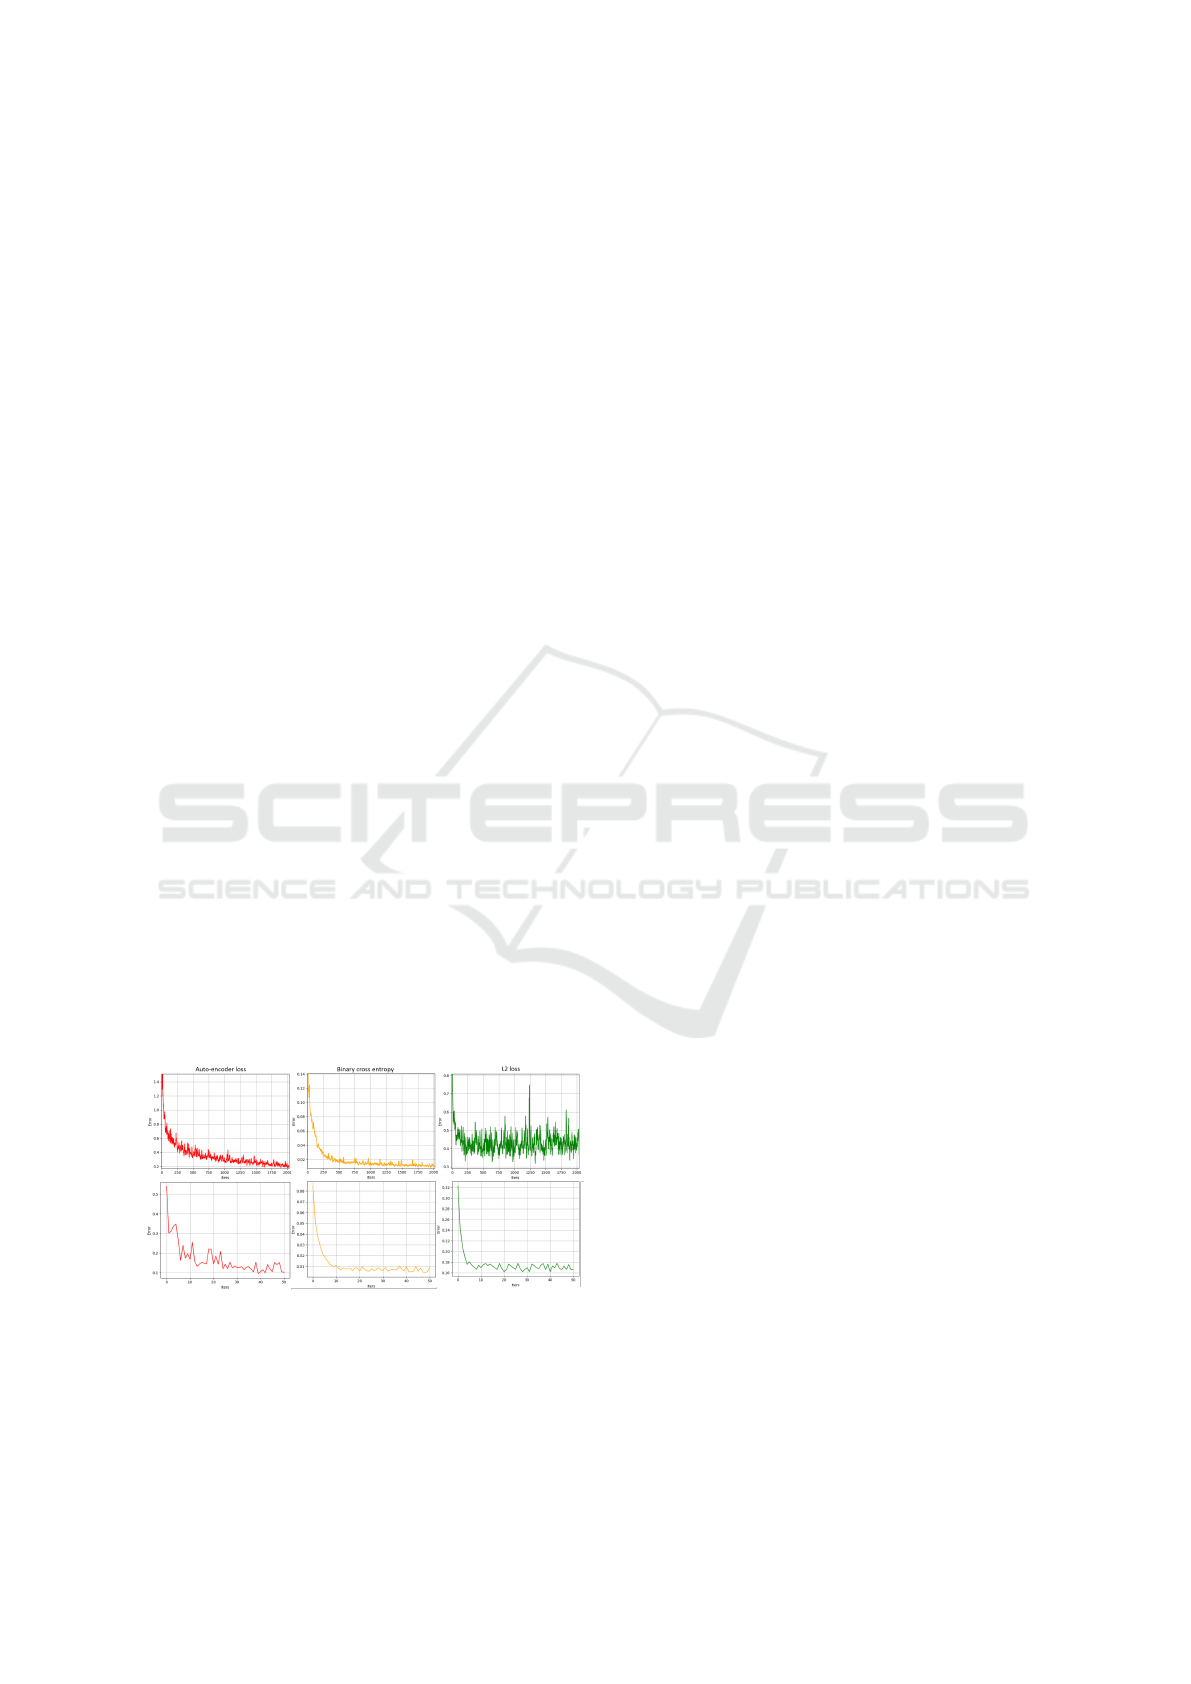
shown in Fig. 10. Conventional L
2
loss finds trivial
solution and does not converge at all. Cross-entropy
has fast convergence, but accuracy is low (see perfor-
mance accuracy in the Results section).
Figure 10: Plots of training (upper row) and validation (bot-
tom row) error. “Auto-encoder” loss (left), binary cross-
entropy (center) and simple L2 loss (right).
To have more control of results and regulate FP (False
Positive) and FN (False Negative) rate, we used coef-
ficient alpha [0...1]:
L = α ∗ f p + (1 − α) ∗ f n (3)
where f p = max(0, (y −
ˆ
Y ))
2
and f n = max(0, (
ˆ
Y ) −
y)
2
. Our study shows that optimal value of α = 0, 7.
All losses are calculated on three different scales
of tanh outputs. The final loss is:
Loss =
3
∑
i=1
L
i
(4)
5.5 Post-processing
To aggregate obtained probability in a united con-
sistent object at image space domain and to get
bounding boxes, we applied a two-step threshold-
ing strategy with DBSCAN clustering. Firstly, the
probability map was thresholded with a low value
of threshold T
low
. Then the DBSCAN clustering
method was launched. Actually, that sort of clus-
tering has so large complexity (O
2
), and to reduce
processing time, we accomplish clustering in low
resolution (8 times smaller than original). Then,
each class C
i
, where maximal probability is lower
than T
high
(max
j
p
j
(C
i
)<T
high
; p
j
(C
i
) - probability of
scratch for j-pixel which belong to the class C
i
) was
discarded. Each remaining class is single scratch. In
our study we used value T
low
= 0.25, T
high
= 0.75 and
for DBSCAN clustering the maximum distance be-
tween two samples for one to be considered as in the
neighborhood of the other is 25, and minimal amount
of points to be considered as separate class is 16.
5.6 Implementation Details
The model was implemented in MXNet framework
(Chen et al., 2015) and trained during 50 epochs (each
epoch is 4k patches) on four Nvidia GeForce GTX
2080 Ti GPU with a batch size of 16 using Adam
(Kingma and Ba, 2014) with the learning rate 10
−4
and b
1
= 0.5, b
2
= 0.9, eps = 10
−8
. Weights were
initialized by Xavier initializer (Glorot and Bengio,
2010) with uniform type of distribution and the scale
of random number range is 3.
Images were augmented by adding Gaussian and
“salt, pepper” noise. To rotate images we used the
approach of bayer pattern augmentation (Liu et al.,
2019), to not corrupt Bayer pattern. The Albumenta-
tion library (Buslaev et al., 2018) was utilized. The
patches which hadn’t any information (without any
spots, only background) were discarded.
Smartphone Glass Inspection System
661
Table 1: The quantitative results of models.
M Model 1 Model 2 Model 3 Model 4
Error level Sample Image Sample Image Sample Image Sample Image
FP 31,9% 21,5% 31,9% 22,6% 45,7% 31,3% 31,3% 21,2%
FN 2,4% 5,1% 2,6% 5,2% 1,9% 3,8% 2,4% 5,1%
6 RESULTS
To evaluate the performance of our model 1000 addi-
tional samples were gathered, which were evaluated
by a skilled human inspector. The ∼ 30% of sam-
ples has scratches. Model quality performance calcu-
lations based on a sample level (decision for sample)
and image (decision for each position) level.
Since our model consists of several contributions,
we performed three experiments and obtained the fol-
lowing models: without nested weights with pro-
posed “auto-encoder” loss (1), model with ResNet-
34 as a backbone (2), full model with nested weights
and cross-entropy loss (3) and full model with nested
weights and “auto-encoder” loss (4). The quantita-
tive results of FP and FN of applying each model are
shown in Table 1. Model 1, 2 and 4 show practically
the same results, but proposed model has a smaller
amount of weights, what helps to avoid overfitting.
Total estimated time needed to check one sample
is about 8 seconds. For the inference we used the
same GPU. Note that in the production line a human
inspector spends ∼20 seconds to check one sample,
and one sample is checked 5 times. For the produc-
tion line the FN ratio is more important, because a
product with defects in no case should go to the con-
sumer. And there is no so big cost to reproduce an
overkilled (FP) sample.
Therefore, although our model doesn’t give abso-
lute accuracy, it allows to reduce the amount of times
which needed to check one sample and the final cost
of the product.
7 CONCLUSION
We have presented full pipeline of smartphone cover
glass surface inspection. Our solution consists of a
setup based on directional illumination to highlight
scratches on dark field images, which allows us to
distinguish scratches from contaminants, and CNN-
based method for scratch detection. The dataset of
cover glass samples images was gathered and labeled
(∼ 11000). We have utilized a special loss technique,
to overcome problem of extremely high data imbal-
ance. Nested convolution kernels approach, which al-
lows to reduce the amount of weights and achieve re-
ceptive field covered full patch during training with-
out any risk of overfitting was presented. Our system
was tested in real production line. The results show
that our solution really may help to reduce resources
which are needed for sample inspection.
REFERENCES
Bayer, B. (1976). Color imaging array.
Buslaev, A. V., Parinov, A., Khvedchenya, E., Iglovikov,
V. I., and Kalinin, A. A. (2018). Albumenta-
tions: fast and flexible image augmentations. CoRR,
abs/1809.06839.
Chen, L., Zhu, Y., Papandreou, G., Schroff, F., and Adam,
H. (2018). Encoder-decoder with atrous separable
convolution for semantic image segmentation. CoRR,
abs/1802.02611.
Chen, T., Li, M., Li, Y., Lin, M., Wang, N., Wang, M.,
Xiao, T., Xu, B., Zhang, C., and Zhang, Z. (2015).
Mxnet: A flexible and efficient machine learning li-
brary for heterogeneous distributed systems. CoRR,
abs/1512.01274.
Ester, M., Kriegel, H.-P., Sander, J., and Xu, X. (1996).
A density-based algorithm for discovering clusters in
large spatial databases with noise. pages 226–231.
AAAI Press.
Etzold, F., Kiefhaber, D., Warken, A., W
¨
urtz, P., Hon,
J., and Asfour, J.-M. (2016). A novel approach to-
wards standardizing surface quality inspection. page
1000908.
Glorot, X. and Bengio, Y. (2010). Understanding the diffi-
culty of training deep feedforward neural networks. In
In Proceedings of the International Conference on Ar-
tificial Intelligence and Statistics (AISTATS’10). Soci-
ety for Artificial Intelligence and Statistics.
Goodfellow, I., Pouget-Abadie, J., Mirza, M., Xu, B.,
Warde-Farley, D., Ozair, S., Courville, A., and Ben-
gio, Y. (2014). Generative adversarial nets. In Ghahra-
mani, Z., Welling, M., Cortes, C., Lawrence, N. D.,
and Weinberger, K. Q., editors, Advances in Neu-
ral Information Processing Systems 27, pages 2672–
2680. Curran Associates, Inc.
He, K., Zhang, X., Ren, S., and Sun, J. (2015). Deep
residual learning for image recognition. CoRR,
abs/1512.03385.
Jiang, X., Yang, X., Ying, Z., Zhang, L., Pan, J., and Chen,
S. (2018). Segmentation of shallow scratches im-
age using an improved multi-scale line detection ap-
proach. Multimedia Tools and Applications, 78.
Kingma, D. P. and Ba, J. (2014). Adam: A
method for stochastic optimization. cite
ICAART 2021 - 13th International Conference on Agents and Artificial Intelligence
662

arxiv:1412.6980Comment: Published as a con-
ference paper at the 3rd International Conference for
Learning Representations, San Diego, 2015.
Liu, J., Wu, C., Wang, Y., Xu, Q., Zhou, Y., Huang, H.,
Wang, C., Cai, S., Ding, Y., Fan, H., and Wang, J.
(2019). Learning raw image denoising with bayer pat-
tern unification and bayer preserving augmentation.
CoRR, abs/1904.12945.
RedLux (2005). The completely objective, automated
scratch dig measurement and optical surface verifica-
tion system.
Ronneberger, O., Fischer, P., and Brox, T. (2015). U-net:
Convolutional networks for biomedical image seg-
mentation. CoRR, abs/1505.04597.
Sajjadi, M. S. M., Vemulapalli, R., and Brown, M.
(2018). Frame-recurrent video super-resolution.
CoRR, abs/1801.04590.
Sch
¨
och, A., Bach, C., Ziolek, C., Perez, P., and Linz-
Dittrich, S. (2018). Automating the surface inspection
on small customer-specific optical elements. page 38.
Song, L., Lin, W., Yang, Y., Zhu, X., Guo, Q., and Xi, J.
(2019). Weak micro-scratch detection based on deep
convolutional neural network. IEEE Access, PP:1–1.
Tao, X., Xu, D., Zhang, Z., Zhang, F., Liu, X.-L., and
Zhang, D.-P. (2016). Weak scratch detection and de-
fect classification methods for a large-aperture optical
element. Optics Communications, 387.
Tao, X., Zhang, D., Ma, W., Liu, X., and Xu, D. (2018). Au-
tomatic metallic surface defect detection and recogni-
tion with convolutional neural networks. Applied Sci-
ences.
Tao, X., Zhang, Z., Zhang, F., and Xu, D. (2015). A novel
and effective surface flaw inspection instrument for
large-aperture optical elements. IEEE Trans. Instrum.
Meas., 64(9):2530–2540.
Torralba, A., Oliva, A., Castelhano, M., and Henderson, J.
(2006). Contextual guidance of eye movements and
attention in real-world scenes: The role of global fea-
tures in object search. Psychological review, 113:766–
86.
Ulmas, P. and Liiv, I. (2020). Segmentation of satellite im-
agery using u-net models for land cover classification.
CoRR, abs/2003.02899.
Venkatesh, R. and Anand, M. (2019). Segmenting ships
in satellite imagery with squeeze and excitation u-net.
CoRR, abs/1910.12206.
Wang, C., Li, C., Huang, Y., and Zhang, X. (2019a). Surface
defect inspection and classification for glass screen of
mobile phone. page 43.
Wang, J., Sun, K., Cheng, T., Jiang, B., Deng, C., Zhao,
Y., Liu, D., Mu, Y., Tan, M., Wang, X., Liu, W.,
and Xiao, B. (2019b). Deep high-resolution rep-
resentation learning for visual recognition. CoRR,
abs/1908.07919.
Yuan, Z.-C., Zhang, Z., Su, H., Zhang, L., Shen, F., and
Zhang, F. (2018). Vision-based defect detection for
mobile phone cover glass using deep neural networks.
International Journal of Precision Engineering and
Manufacturing, 19:801–810.
Yue, H., Fang, Y., Wang, W., and Liu, Y. (2019). Structured-
light modulation analysis technique for contamination
and defect detection of specular surfaces and transpar-
ent objects. Optics express, 27:37721–37735.
Zhang, H., Wu, C., Zhang, Z., Zhu, Y., Zhang, Z., Lin, H.,
Sun, Y., He, T., Mueller, J., Manmatha, R., Li, M.,
and Smola, A. J. (2020). Resnest: Split-attention net-
works. CoRR, abs/2004.08955.
Smartphone Glass Inspection System
663
