
Numerical Simulated Concept and Mechanical Proof of Concept
for a Transmission OCT (tOCT)
Andreas Drauschke
1
, Katharina Dettelbacher
1
, Michaela Kienberger
1
, Sarah Nagl
1
and Christian Milz
2
1
Department Life Science Engineering, UAS Technikum Wien, H
¨
ochst
¨
adtplatz 6, Vienna, Austria
2
Faculty of Physics, TU Wien, Wiedner Hauptstraße 8–10, Vienna, Austria
Keywords:
Medical Imaging, Biomedical Optics, OCT.
Abstract:
Optical coherence tomography is a very powerful tool in imaging methods, but its practical use is limited due
to the shallow scan depth. A concept draft of a transmission OCT is presented, which eliminates the greatest
limitation of the OCT – the small penetration depth. The functional principle, based on the basic structure of
a Mach–Zehnder interferometer, is developed in a numerical simulation in OpticStudio. The numerical setup
includes beam expander and beam compressor systems to maximize the contrast generated in the interference
pattern and the design of an A–scan to realize a depth scan. As the result, the numerical simulation of the
complete setup is presented and the concept is then demonstrated in a simplified mechanical setup without an
A–scan.
1 INTRODUCTION
Imaging processes play a central role in medical diag-
nostics and in assisted surgical interventions (Bush-
berg et al., 2012; Webster et al., 2000; Drexler and
Fujimoto, 2015). Among other things, this is due to
the fact that modern medical imaging processes have
made enormous progress in recent years and not only
have the quality of existing diagnostic processes and
assistance systems been optimized, but a large num-
ber of new areas of applications has been established
as well (Samei and Peck, 2019). Some of the most
frequently used imaging procedures are listed in table
1. The methods are compared with one another with
regard to three important characteristics: the depth of
penetration in tissue, the achievable lateral and depth
resolution and the distinction between invasive and
non-invasive techniques. In addition, some typical ap-
plications of the respective processes are listed.
Optical coherence tomography is mostly used as
a non–invasive optical imaging technique with which
near–surface tissue structures can be imaged in three
dimensions or as two–dimensional cross–sections in
high resolution (Fercher et al., 2003a; Brezinski,
2006; Drexler and Fujimoto, 2015; Fujimoto and
Swanson, 2016). OCT is most commonly used in
ophthalmology, for example to make diagnostic scans
of the retina.
The OCT is based on the realization of a Michel-
son interferometer. The backscattered light is used in
the sample arm. The penetration depth is limited to
a maximum of 3 mm (Drexler and Fujimoto, 2015),
due to the physical principle of using backscattered
light, which considerably limits the use of the OCT.
An interesting aspect of OCT is that the lateral and ax-
ial resolution can be influenced independently of one
another. The generated images usually have a high
resolution and are only exceeded in terms of lateral
resolution by microscopy techniques, which lack ax-
ial penetration depth.
In order to overcome the essential limitation of
OCT, the evaluation of the forward–scattered light ap-
pears to be effective. Since no light is scattered an-
tiparallel to the illumination in such a setup in the
sample arm, the basic structure of a Michelson in-
terferometer can no longer be used. It makes sense
to use a Mach–Zehnder interferometer (Demtr
¨
oder,
2009) as an alternative interferometric setup for the
forward–scattered light, in which the interference pat-
tern is not generated by interference with reflected or
backscattered light, but in the transmitted or forward–
scattered light. Since this corresponds to an OCT
setup in transmission, it is referred to as a transmis-
sion OCT (tOCT).
The assignment of an interference pattern to a
specific point in the analyzed tissue is more com-
Drauschke, A., Dettelbacher, K., Kienberger, M., Nagl, S. and Milz, C.
Numerical Simulated Concept and Mechanical Proof of Concept for a Transmission OCT (tOCT).
DOI: 10.5220/0010198500230031
In Proceedings of the 9th International Conference on Photonics, Optics and Laser Technology (PHOTOPTICS 2021), pages 23-31
ISBN: 978-989-758-492-3
Copyright
c
2021 by SCITEPRESS – Science and Technology Publications, Lda. All rights reserved
23

Table 1: Comparison of different imaging techniques in terms of resolution, scan depth and invasive or non–invasive interven-
tion and applications. Computed tomography (CT), positron emission tomography (PET), single-photon emission computed
tomography (SPECT), magnetic resonance imaging (MRI), ultrasound (US), optical coherence tomography (OCT) and vari-
ous microscopy techniques (Bushberg et al., 2012; Webster et al., 2000; Vo-Dinh, 2003; Drexler and Fujimoto, 2015; Hoppert,
2003; Fujimoto and Swanson, 2016; Guggenheim et al., 2017; Rathod et al., 2015; Sch
¨
utzenberger et al., 2019).
imaging technique invasive/non–
invasive
resolution
[axial/lateral]
scanning
depth of
penetration
examples of
application
CT invasive/ionizing
radiation
0.5 mm/0.6 mm whole body Imaging of the brain,
heart, lung, abdomen,
tumors, complicated
bone fractures,
angiography
PET invasive/ionizing
radiation
5 mm/5 mm whole body Oncology,
neuroimaging,
cardiology
SPECT invasive/ionizing
radiation
10 mm/10 mm whole body Myocardial
scintigraphy, skeletal
scintigraphy, brain
perfusion scintigraphy,
oncology
MRI non–invasive 0.9 mm/0.9 mm whole body Neuroimaging,
cardiovascular
imaging,
musculoskeletal
imaging, angiography,
liver and
gastrointestinal
imaging
MRI invasive/contrast
agent
0.9 mm/0.9 mm whole body Detection of
inflammations or
tumors or the
higher-contrast
imaging of vessels
US non–invasive 10 µm/300 µm 20 cm Imaging of muscles,
tendons, and most
internal organs
OCT non–invasive 1–15 µm/5 µm 2–3 mm Ophthalmology,
dermatology (early
cancer diagnosis)
OCT invasive/in
combination with
endoscopic
methods
1–15 µm/5 µm 2–3 mm Imaging of blood
vessels, heart,
intestines, bladder,
cancer diagnosis (early
stage), follow-up
treatment and
diagnosis of a heart
attack
various microscopic
techniques
non–invasive –/50 nm
(superresolution)
200 nm (classical)
0 mm Imaging on surfaces or
transparent tissue,
ophthalmology,
imaging in cell cultures
various microscopic
techniques
invasive/in
combination with
endoscopic
methods
–/50 nm
(superresolution)
200 nm (classical)
0 mm Imaging on surfaces of
blood vessels, heart,
bladder
PHOTOPTICS 2021 - 9th International Conference on Photonics, Optics and Laser Technology
24
plicated in forward–scattered light, since unscattered
light would be directly superimposed on scattered
light. Therefore, the scattered light offset with regard
to the illumination path will have to be analyzed.
In the presented work the design of a tOCT is real-
ized as a numerical concept and its fundamental capa-
bility for generating an interference pattern is demon-
strated. The basic suitability for the realization of an
A–scan is demonstrated in the numerical simulation.
The suitability of a Mach–Zehnder interferometer
is then shown in a simplified setup that does not in-
clude an A–scan. For this purpose, an interference
pattern is generated as a result of the superposition of
the reference beam with forward-scattered light in the
sample arm.
The proofs of concepts, both the numerical simu-
lation and the practical implementation in the demon-
strator, prove the basic suitability of the setup for the
implementation of a transmission OCT.
2 MATERIALS & METHODS
2.1 Physical Principles
The conceptual transmission OCT is intended to an-
alyze the depth information of a tissue by means of
the evaluation of forward–scattered light in contrast to
classic OCT, in which backscattered light is analyzed.
The greater scan depth of the tOCT is explained by the
larger forward scatter in relation to the back scatter of
the light. Due to the complexity of biological tissue,
an analytical description of the overall physical sit-
uation is not possible. The theory of Mie scattering
(Mie, 1908; Born and Wolf, 2005; Bhandari et al.,
2011) can be used to estimate the ratio of the forward
to backscattering. For this it is assumed that the light
is scattered by approximately spherical particles, as
shown in figure 1.
This is a very rough approximation because, on
the one hand, the particles in biological tissue are usu-
ally not spherical and, on the other hand, the distance
between the scattering particles is small enough that
there is a direct interaction between the scattering par-
z
P
ϑ
~r
a
Direction of Propagation
~
E
i
x
ε
I
ε
II
Figure 1: Basic geometry for describing the scattering of
light on spherical particles (Mie scattering) according to
Born & Wolf (Born and Wolf, 2005).
-90°
-30°
-20°
-10°
0°
10°
20°
30°
90°
180°
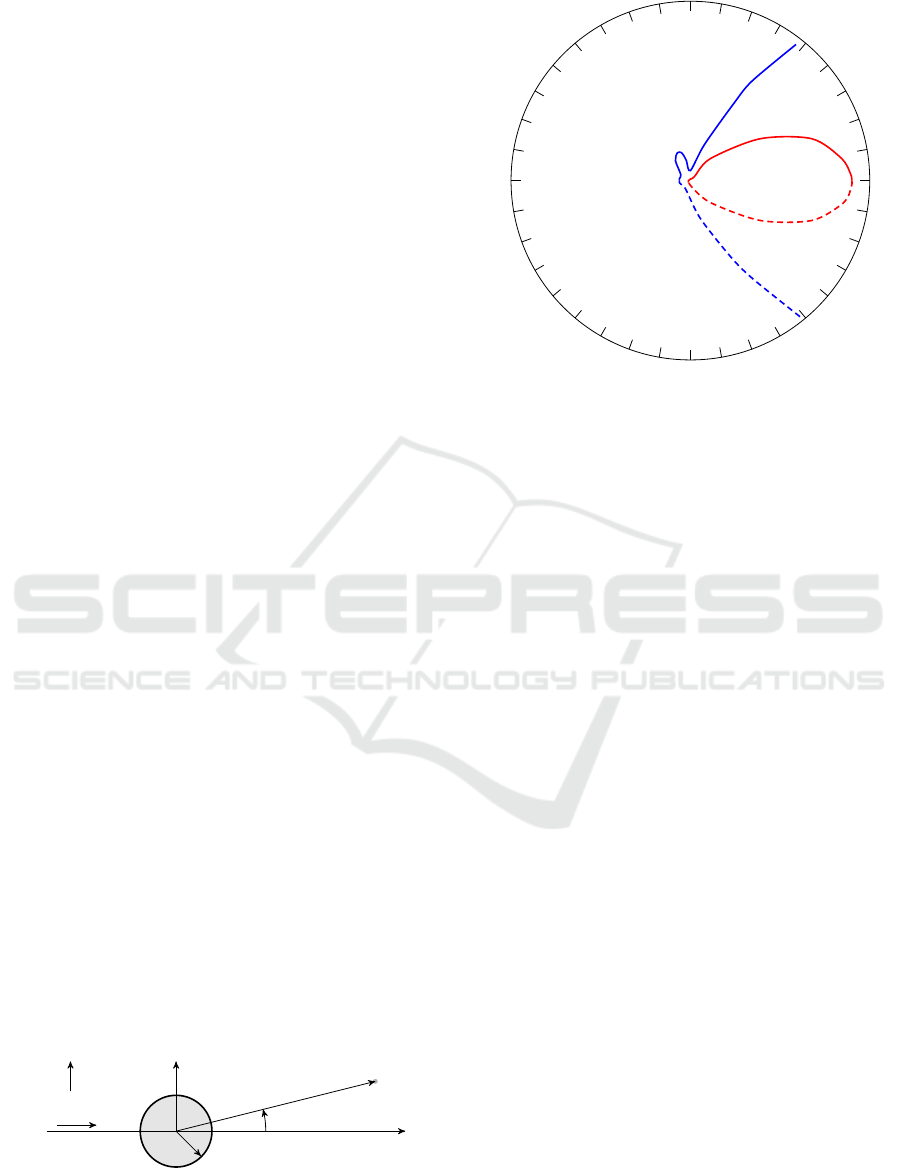
Figure 2: Scattering by a spherical water droplet with drop
radius of a = 260 nm (red line), a = 2600 nm (blue line)
with n = 1.33 + i10
−8
illuminated by visible light of wave-
length λ = 550 nm according to figure 4.9 from Bohren &
Huffman (Bohren and Huffman, 1983). Linear scale; solid
line: perpendicular polarization direction, dashed line: par-
allel polarization direction.
ticles. However, the estimate shows at least the rough
tendency of the expected scatter distribution.
An analysis of the scattered light distribution takes
place in the graphic evaluation of the scatter ampli-
tude as a function of the scatter angle. The asso-
ciated graphic representation is referred to as a po-
lar diagram as shown in figure 2. The result of the
Mie theory is that the forward scattering tends to in-
crease with increasing particle size, while at the same
time the scattering amplitude of the backward scatter-
ing tends to decrease (Bohren and Huffman, 1983).
In backscattering, a local maximum of the amplitude
can be found at a scattering angle of 180 deg under
certain physical conditions. With sufficiently large
particles (far from the Rayleigh domain) one always
finds a local maximum in forward scattering, the am-
plitude of which is significantly greater than that of
backward scattering. For this reason, light in forward
scattering can generally achieve a higher scan depth
than in backward scattering with the same absorption.
Since these effects are wavelength–dependent, it will
be necessary to determine the optimal wavelength for
use in the tOCT.
It is assumed here that light, which is scattered
only once, emerges from the sample at a certain an-
gle. As a further approximation, the tissue is initially
assumed to be a plane–parallel plate as shown in fig-
ure 3, so that the geometric relationships for analyzing
the scattered light are further simplified.
Numerical Simulated Concept and Mechanical Proof of Concept for a Transmission OCT (tOCT)
25
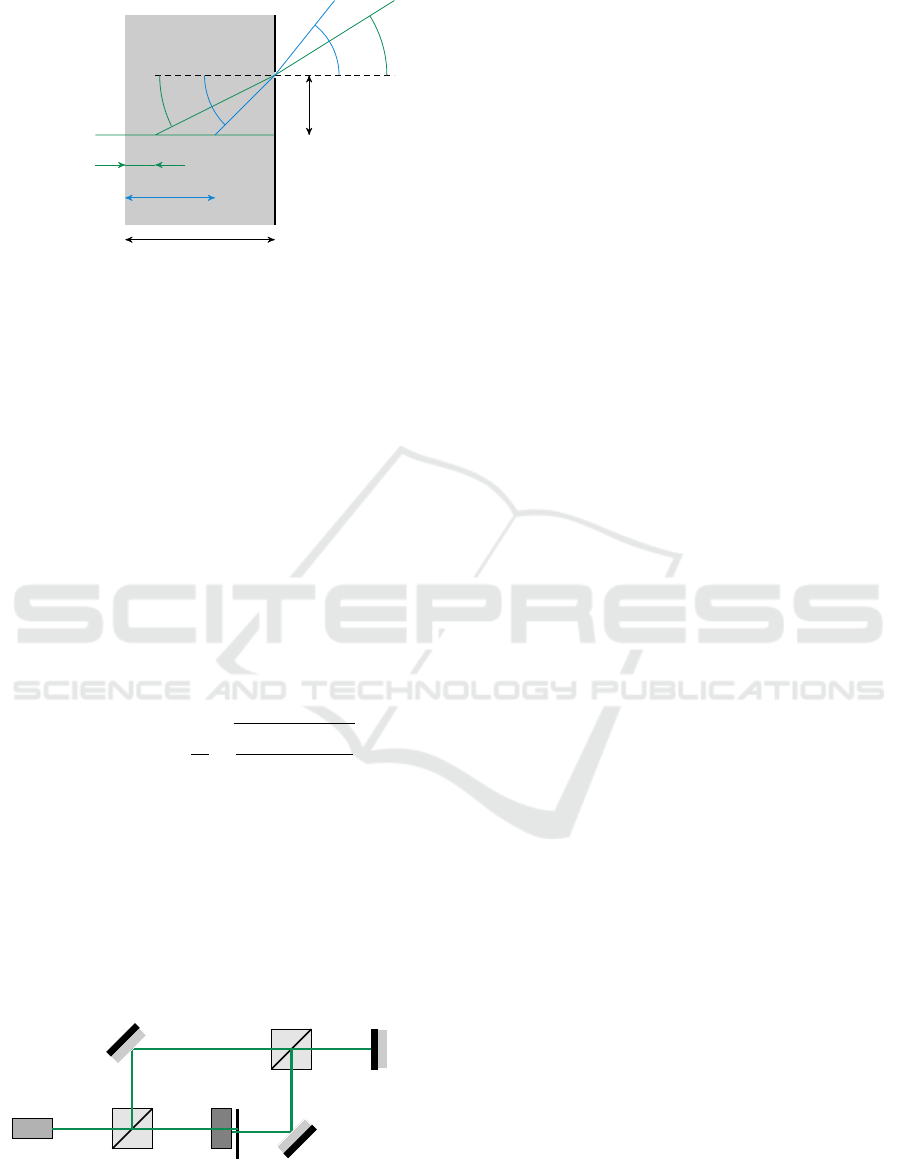
x
L
2
D
L
1
pinhole (black)
ϑ
1
ϑ
2
Sample (gray area)
ϕ
1
ϕ
2
n
1
n
2
Figure 3: Sketch for determining the correlation between
penetration depth L
n
and transmission angle ϕ
n
.
Both approximations of the plane–parallel arrange-
ment of the boundary surfaces most likely lead to
inaccuracies in the signal at large exit angles, while
the approximation of the single scattering most likely
leads to inaccuracies in the interference pattern for
small scattering angles. In practice, both errors will
become noticeable as a decreasing contrast of the in-
terference pattern.
By applying the two approximations, a direct cor-
relation between the exit angle of a beam – offsetted
to the illuminating beam – and the depth–localization
of the scattering location in the tissue can be derived.
An A–scan is therefore converted into an exit angle
spectrum. The physical conditions are shown in fig-
ure 3. Simple geometrical considerations and the ap-
plication of the law of refraction at the point of beam
exit lead to
ϕ
n
(L
n
) = sin
−
1
n
1
n
2
s
x
2
(D − L
n
)
2
+ x
2
!
. (1)
An amplitude scan (A–scan) describes the basic form
of a depth–scan (Fercher et al., 2003b). This term
most commonly appears in the field of ultrasonogra-
phy but, can be applied to other imaging modalities
such as OCT and tOCT in the same manner. For the
A–scan the magnitude of the signals, which in reflec-
tive setups results from echoes returning from a differ-
ent depth within the tissue, are displayed as a function
Light Source
Beamsplitter
Beamsplitter
Flat Mirror in
Reference Arm
Flat Mirror in
Sample Arm
Detector
Sample
Pinhole
Figure 4: General setup of the Mach–Zehnder interferom-
eter without A–scan for the realization of a transmission
OCT according to Demtr
¨
oder (Demtr
¨
oder, 2009).
of distance (Dance et al., 2014).
In the case of tOCT the more general explanation
of the A-scan, as a scan along one axis, is needed.
However, the analysis of this A-scan differs from that
of reflective setups. While imaging tools such as ul-
trasonography detect the depth information along one
axis at a single detector element, the scan is trans-
formed to a detection along several detector elements
for tOCT. This is due to the exiting angle being a
function of penetration depth thus transferring depth-
information to an axis perpendicular to the incident
light.
The basis of the conceptual transmission OCT is
a Mach–Zehnder interferometer, as shown in figure 4.
The unmodified reference arm of the classical Mach–
Zehnder interferometer is adopted, while a pinhole is
added in the sample arm next to the test sample. With
the help of this pinhole, those rays scattered in the
test sample can be selected. Since the scattered rays
do not run parallel to the illuminating beam, it is to be
expected in this setup that the structure only leads to
an interference pattern on the receiver for small exit
angles. Therefore, for the proof of concept, the pin-
hole was only shifted by approximately 1 mm so that
the illuminating beam was just faded out, but the scat-
tered beam was still propagated almost parallel to the
illuminating beam. Due to the small angle, it is to be
expected that a slightly distorted interference pattern
will be generated.
Since only nearly parallel rays generate an in-
terference pattern after passing through the second
beam splitter cube, the generated angle spectrum must
be transformed into a bundle of parallel rays. The
simplest method of parallelizing rays emitted from a
point is to place a concave mirror or converging lens
at the distance of the focal length to the exit point. To
avoid aberrations, a parabolic mirror or an aspherical
lens must be used. We decided to use an aspherical
lens for the construction in the full setup as shown
in figure 5. The A–Scan is thereby converted into
a bundle of parallel light beams, with different dis-
tances between the light beams and the unscattered
beam representing different depths of scattering in the
tissue.
2.2 Numerical Design
The concept of the transmission OCT was examined
in a numerical simulation. For this purpose, in ad-
dition to a simulation of the scattering properties of
the samples, an aspherical lens was integrated into the
structure that implements the A–scan. Additionally, a
beam expander was set into the reference arm so that
all the beams generated of the A–scan overlap with
PHOTOPTICS 2021 - 9th International Conference on Photonics, Optics and Laser Technology
26
100 mm
a
b
c
d e
f
g
h i
j
k
m
n
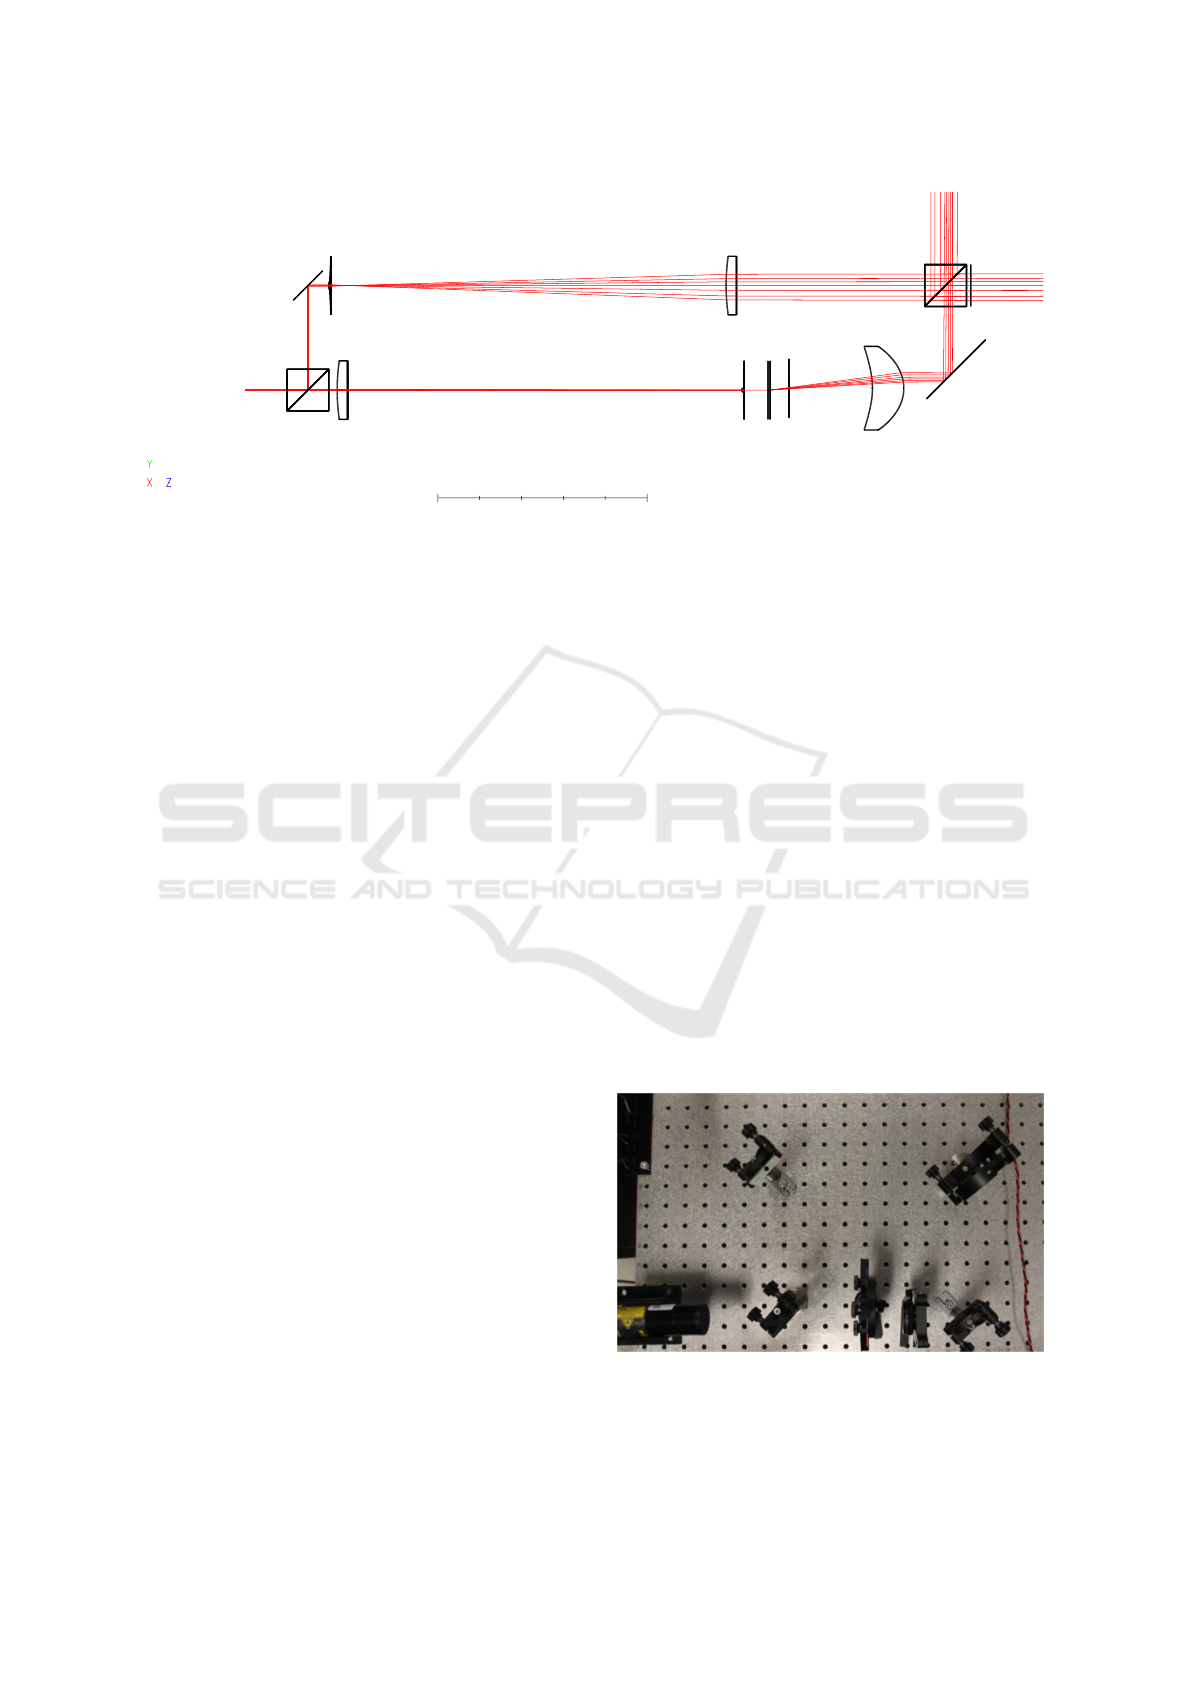
Figure 5: Numerical simulation of the Mach–Zehnder interferometer including A–Scan using OpticStudio (ZEMAX LLC,
2020). Some parameters of the components are listed in table 2: (a) coherent light source, (b) & (k) beam splitter cube,
(c) & (m) redirection mirror, (d) & (e) lenses for simulation of a beam expander, (f) & (g) lenses for simulation of a beam
compressor, (h) test sample, (i) pinhole, (j) collimator lens, and (n) possible detector position.
beams in the reference arm and thus generate a corre-
sponding interference pattern. In order to determine
the location of the scattering in the sample more pre-
cisely and to achieve a higher intensity of the beams
in the sample arm, a beam compressor was integrated
into the sample arm.
The scatter in the sample can in principle be simu-
lated in different ways. In the analyses, Lambert scat-
tering on the one hand and Gauss scattering on the
other hand were examined. It turned out that the sim-
ulation with a Gauss scattering produced more realis-
tic results, so that in the end a simulation with a Gauss
scattering with σ = 0.2 was carried out.
Two scattering angles were simulated: 3.52 deg
and 6.15 deg. A radius of 1.5 mm was assumed for
the reference sphere. Both scattering angles generate
an interference pattern on the detector. The interfer-
ence pattern were determined using a Jones calculus.
The two angles were then collimated with an as-
pherical lens. This special aspherical lens was de-
signed for this in order to minimize aberrations. In
practice, the lens will have to be adapted to the condi-
tions of manufacture. However, the minimization of
the aberrations will also be essential for a lens in a real
setup in order to keep the reduction of the contrast in
the interference pattern as low as possible.
Since only two relatively small angles were simu-
lated, no total internal reflection occurred at the in-
terface between the tissue and the surrounding air.
Total internal reflection is to be expected for larger
scattering angles and limits the scanning depth of the
method. The total internal reflection could be reduced
or even completely prevented by adding a transparent
contact gel with an adapted refractive index and a field
lens at the level of the pinhole at the interface between
tissue and surrounding air.
2.3 Proof of Concept in Mechanical
Setup
In order to provide the proof of concept by means of a
generated interference pattern, the simplified mechan-
ical setup from figure 4 was implemented. In addition,
only a very small offset of the pinhole by 1 mm could
be implemented. If the offset was greater, the inten-
sity of the scattered beam dropped significantly, so
that the interference pattern could no longer be gen-
erated. This effect was reinforced by the increasing
deviation from the parallel beam.
The implemented setup is shown in figure 6. A
helium–neon laser at a wavelength of 632.8 nm was
used for illumination. Non–polarizing beam splitter
plates with split ratios of 50:50 were used for beam
splitting. Due to the sharp drop in intensity in the
A B C D E
F
G
Figure 6: Mechanical setup for the proof of concept. (A)
helium–neon laser at a wavelength of 632.8 nm, (B) beam-
splitter, (C) sample, (D) pinhole, (E) flat mirror, (F) flat mir-
ror, (G) beamsplitter.
Numerical Simulated Concept and Mechanical Proof of Concept for a Transmission OCT (tOCT)
27

Table 2: Parameters of the components of the Mach–Zehnder interferometer design. The numbering corresponds to that
shown in figure 5.
Component Position
(y, z)
[mm]
Radius
1
[mm]
Conic
1
[mm]
Thickness
[mm]
Radius
2
[mm]
Conic
2
[mm]
Material
Beamsplitter (b) (0,20) ∞ – 10 ∞ – N–BK7
Flat mirror (c) (50,30) ∞ 0 0 – – Silver
Beamexpander lens (d) (50,40) 5 0 1 ∞ 0 N–BK7
Beamexpander lens (e) (50,190) 97.75 0 – ∞ 0 N–BK7
Beamcompressor lens (f) (0,44) 97.75 0 5 ∞ 0 N–BK7
Beamcompressor lens (g) (0,237) 1 0 – ∞ 0 N–BK7
Sample (h) (0,250) ∞ – 1 ∞ – scattering
surfaces
Pinhole (i) (0.9,260) – – 0 ∞ – N–BK7
Collimator lens (j) (0.9,300) −36.549 −7.721 15 −18.79 -0.607 N–BK7
Beamsplitter (k) (50,325) ∞ – 10 ∞ – N–BK7
flat mirror (m) (10,340) ∞ 0 0 – – Silver
sample arm, a split ratio of 90:10 would have been
more suitable, with the 90% being localized in the
sample arm. The new split ratio will additionally im-
prove the contrast in the interference pattern.
A thin preparation of artificially grown cells was
used as sample. The used sample consisted of skeletal
muscle–like constructs. The tissue was grown from
myoblasts that were embedded in a fibrin hydrogel
and mechanically stimulated in a bioreactor (Heher
et al., 2015). Due to the small thickness of the prepa-
ration, multiple scattering with significantly different
optical paths could be practically excluded. With the
selected setup no A–Scan could be realized. However,
the structure made it easier to generate an interference
pattern.
3 RESULTS
3.1 Numerical Simulation
The numerical simulation was carried out in accor-
dance with the illustration from figure 5 in OpticStu-
dio (ZEMAX LLC, 2020). The most important op-
tical properties of the used components are listed in
table 2. N–BK7 was used for all transmissive optical
components. In practice, different materials may be
used.
Beam expander and beam compressor were de-
signed manually. In the final setup, these will be re-
placed by commercial beam expander systems. In the
simulation the selection of the different scan depths
takes place by using two scatter points located at a dis-
tance of one millimeter from one another. In a practi-
cally implemented setup, the interference patterns of
the scattering points of different depths (A–Scan) are
possibly recorded sequentially by a movable pinhole
in the sample arm in front of the beam splitter cube (k)
in figure 5. This is not necessary in the simulation be-
cause the generated interference patterns are located
sufficiently distant from one another.
The corresponding simulated interference patterns
are shown in figure 7. Two sharply separated ring pat-
terns of the two scattering points, situated at different
depths, can clearly be seen.
The simulation basically demonstrates that the
theoretical setup is suitable for reconstructing an A–
Scan from the recorded interference patterns. It
should be noted that the interference patterns will
overlap in practice. A separation can be achieved via
a pinhole in the sample arm in front of the beam split-
ting cube (k). In order to accelerate the A–scan, a
line of pinhole diaphragms is recommended, which
generates separate interference patterns from differ-
Y coordinate value
3.72
2.58
0
-1.44
-2.56 0 2.58
X coordinate value
150.8
135.7
120.6
105.6
90.5
75.4
60.3
45.2
30.2
15.1
0
Coherent
Irradiance
Figure 7: Simulation of the generated interference patterns
for two different depths 1 mm apart in the sample.
PHOTOPTICS 2021 - 9th International Conference on Photonics, Optics and Laser Technology
28

ent sample depths, but which are relatively far apart.
By moving the pinhole line over the distance between
two holes, the entire scan is obtained in the time T /m,
where T is the duration for a scan with shifting one
pinhole and m is the number of used pinholes.
Due to the different optical paths, the two interfer-
ence patterns are different, as expected. The center of
the interference pattern is shifted, so that the center
of the ring–shaped interference pattern in the upper
image of the figure 7 lies in the center of the sensor,
while the center of the ring–shaped interference pat-
tern is shifted upwards for the second depth, shown
in the lower image of figure 7. Using a larger sensor
allows the center points of the interference patterns to
remain searchable, which is necessary for the inter-
pretation of the A–scan.
Basically, the simulation proves that the scattering
from both tissue depths leads to an angular spectrum
of the exiting rays which can be converted into paral-
lel rays by means of the lens (j). The distance between
the rays corresponds to the scan depth, starting with
the point of entry of the light ray into the tissue up to
a maximum scanning depth, which is limited on the
one hand by the total internal reflection occurring at
the exit surface and on the other hand by the NA of
the lens (j) used. Both effects could be minimized in
practice by using a contact gel between the tissue (h)
and the pinhole (i) and a field lens that is positioned
in the pinhole.
3.2 Experimental Proof of Concept
In order to provide the proof of concept in a simpli-
fied experimental version, all components for the re-
alization of an A–scan were removed from the setup.
The setup as shown in figures 4 and 6 was realized.
Therefore, a simplified design as shown in figure 4
was used. The implemented setup is shown in figure
6.
In order to minimize the absorption of the light
beam in the sample, a thin preparation should be used.
More precisely, tissue with low absorption should be
chosen. Artificially grown skeletal muscle cells in a
thin–layer preparation were therefore used as a sam-
ple. These show a significant forward scatter.
Since no lens was used in the setup to parallelize
the scattered rays, only small scattering angles could
be detected, which are scattered almost parallel to the
illumination light beam. At the same time, it had to
be guaranteed that the illuminating beam would be ab-
sorbed as completely as possible. Since the waist of
the illumination beam is approximately 0.5 mm, the
pinhole behind the sample was shifted by 1 mm com-
pared to the illumination beam. This guarantees that,
Figure 8: Measurement of the generated interference pat-
terns for nonscattered light (A) and light scattered at a mus-
cle cell sample (B).
on the one hand, only scattered rays can pass through
the aperture, but the illuminating beam is absorbed
and, on the other hand, the transmitted light has only
a small angle with respect to the illuminating beam.
This deviation in parallelism should be reflected in a
distorted interference pattern.
With the simplified setup, the interference pattern
shown in figure 8 was recorded. Figure 8 (A) shows
the undistorted interference pattern generated at the
output of a Mach–Zehnder interferometer. The setup
did not contain a test sample or a pinhole, so that the
interference pattern corresponds to that of an undis-
turbed Mach–Zehnder interferometer.
Figure 8 (B) shows the generated interference pat-
tern after adding the test sample and the offset pin-
hole. The distortion in the interference pattern can be
seen as a deformed envelope. However, the interfer-
ence fringes can also be clearly detected in the sim-
plified setup. The location of the scattering cannot be
exactly determined due to the small thickness of the
preparation and the lack of a lens for separating the
various rays of the A–scan.
Since this setup is a pure proof of concept, no fur-
ther measurement of the interference pattern was car-
ried out. The setup proved to be very sensitive to vi-
brations. In addition, the relatively low intensity of
the illumination laser used proved to be limiting.
4 DISCUSSION
The relatively shallow scan depth is the greatest limit-
ing factor in optical coherence tomography. OCT can
be used to create both laterally and in depth high reso-
lution, three–dimensional scans of tissue, without the
use of ionizing radiation. The achievable scan depth is
limited by the usable light source intensity, the wave-
length and the type of tissue to be scanned.
In order to reduce this limiting factor, but at the
same time provide the advantageous properties of the
OCT, in particular the independence from the scanned
Numerical Simulated Concept and Mechanical Proof of Concept for a Transmission OCT (tOCT)
29

tissue and the high, achievable resolution, a transmis-
sion version of the OCT was designed.
The Michelson interferometer usually used in
classical OCT, with which backscattered light is an-
alyzed interferometrically, is replaced by a Mach–
Zender interferometer in which forward scattered
light is to be analyzed.
In order to generate interference patterns with a
sufficiently high contrast, some approximations must
be fulfilled. On the one hand, the once scattered rays
of the sample beam must be dominant over the multi-
ple scattered rays. The setup in use also assumes that
the examined tissue can be approximated as a plane–
parallel plate.
The approximation that only single scattering can
be measured limits the achievable result, since for
multiple scattered light the formula 1 is no longer
valid. Multiple scattering would result in the wrong
depth of the scattering point, so that a clear assign-
ment of the scattering point is no longer possible. This
would manifest itself in a decrease in the contrast in
the generated interference image. With a sufficiently
large scattering angle, however, as can be seen in fig-
ure 2, it can be assumed that the amplitude of the mul-
tiple scattered light drops sufficiently quickly so that
the reduction in the achievable contrast still allows the
result to be clearly interpreted.
In a numerical simulation it was shown that the
proposed setup is suitable for generating interference
from rays that are scattered at different depths of the
tissue. In addition, the proof of concept was provided
that the proposed design for carrying out an A–scan
works in principle. However, the tissue cannot be
scanned in full depth, since, above a certain depth,
scattered rays are totally reflected on the exit surface.
In addition, the NA of the A–Scan–lens limits the
measurable range of the representable scattered rays.
In a simplified experimental setup, the proof of
concept was achieved and demonstrated that interfer-
ence patterns can be generated with scattered rays
in transmission in a Mach–Zehnder interferometer.
Therefore this method is in principle able to function
as the core of a tOCT.
5 CONCLUSION & FURTHER
CHALLENGES
Possibilities for optimization were identified in both
the numerical and the experimental setup.
The scan depth is limited by the total reflection
occurring and by the NA of the A–scan lens. The for-
mer can be reduced by using a contact gel, similar to
ultrasound, and the latter appears to be reducible by
using a field lens in the position of the pinhole. In
addition, a numerical analysis should be carried out
with more realistic dissemination models for tissue
obtained from laboratory experiments. The Gaussian
model used in the current simulation may not reflect
reality adequately.
The influence of different split ratios of the beam
splitter should be examined and optimized numeri-
cally and there is still no tolerance analysis of the
components used.
In the next step, a tOCT including a complete
A–scan will be implemented experimentally. In this
setup it is to be examined how the A–scan can be
implemented in practical application. The possible
choice of a second pinhole in front of the beam splitter
(k) from figure 5 and the scanning speed will depend
on this.
Furthermore, it has to be analyzed in experimen-
tal investigations whether the back–calculation is also
possible from the generated interference patterns for
the illuminated structure. This analysis will be based
on measurements of scattered light on tissue samples.
The maximum depth of penetration will depend
on the wavelength used, the intensity of the light used
and the tissue being screened. These examinations are
to be carried out in the future.
In addition, the usability of different light sources,
especially with regard to the desired wavelength
used, should be investigated. Multi–wavelength scans
could significantly improve the resolution of the scans
generated.
REFERENCES
Bhandari, A., Hamre, B., Frette, O., Stamnes, K., and
Stamnes, J. J. (2011). Modeling optical properties of
human skin using mie theory for particles with dif-
ferent size distributions and refractive indices. Op-
tics Express, 19(15):14549–14567. https://doi.org/10.
1364/OE.19.014549.
Bohren, Craig F. and Huffman, Donald R. (1983). Absorp-
tion and Scattering of Light by Small Particles. John
Wiley & Sons, Inc, Clearance Center, 222 Rosewood
Drive, Danvers, MA 01923.
Born, M. and Wolf, E. (2005). Principles in Optics. Perg-
amon Press LTD., Headington Hill Hall, Oxford 4 &
5 Fitzroy Square, London W.1., Great Britain, 7
th
edi-
tion.
Brezinski, Mark E. (2006). Optical Coherence Tomogra-
phy – Principles and Applications. Elsevier Inc., 84
Theobald’s Road, London WC1X 8RR, UK.
Bushberg, Jerold T., Seibert, J. A., Leidholdt, Edwin M.,
and Boone, John M., editors (2012). The Essential
Physics of Medical Imaging. Lippincott Williams &
Wilkins, a Wolters Kluwer business, Two Commerce
PHOTOPTICS 2021 - 9th International Conference on Photonics, Optics and Laser Technology
30

Square, 2001 Market Street, Philadelphia, PA 19103
USA, 3
rd
edition.
Dance, David R., Christofides, S., Maidment, A. D. A.,
Mclean, I. D., and Ng, K. H., editors (2014). Diagnos-
tic Radiology Physics: A Handbook for Teachers and
Students. International Atomic Energy Agency, Vi-
enna international Centre. Po box 100. 1400 Vienna,
Austria.
Demtr
¨
oder, W. (2009). Experimentalphysik – Band 2: Elek-
trizit
¨
at und Optik. Springer–Verlag Berlin Heidelberg,
5
th
edition.
Drexler, W. and Fujimoto, James G., editors (2015). Opti-
cal Coherence Tomography – Technology and Appli-
cations. Springer Cham Heidelberg New York Dor-
drecht London, 2
nd
edition.
Fercher, A. F., Drexler, W., Hitzenberger, Christoph K., and
Lasser, T. (2003a). Optical coherence tomography –
principles and applications. Rep Prog Phys, 66:239–
303. https://doi.org/10.1088%2F0034-4885%2F66%
2F2%2F204.
Fercher, A. F., Drexler, W., Hitzenberger, Christoph K.,
and Lasser, T. (2003b). Optical coherence tomogra-
phy – principles and applications. Rep Prog Phys,
66(2):239–303. https://doi.org/10.1088/0034-4885/
66/2/204.
Fujimoto, J. and Swanson, E. (2016). The development,
commercialization, and impact of optical coherence
tomography. IOVS, Special Issue, 57(9). https://www.
readcube.com/articles/10.1167/iovs.16-19963.
Guggenheim, Emily J., Lynch, I., and Rappoport, Joshua
Z. (2017). Imaging in focus: Reflected light imag-
ing: Techniques and applications. Int J Biochem Cell
Biol, 83:65–70. https://doi.org/10.1016/j.biocel.2016.
12.008.
Heher, P., Maleiner, B., Pr
¨
uller, J., Teuschl, A. H.,
Kollmitzer, J., Monforte, X., Wolbank, S., Redl, H.,
R
¨
unzler, D., and Fuchs, C. (2015). A novel biore-
actor for the generation of highly aligned 3d skele-
tal muscle-like constructs through orientation of fib-
rin via application of static strain. Acta Biomater,
24:251–26. https://doi.org/10.1016/j.actbio.2015.06.
033.
Hoppert, M. (2003). Microscopic Techniques in Biotech-
nology. WILEY–VCH Verlag GmbH & Co. KGaA,
Weinheim, Germany.
Mie, G. (1908). Beitr
¨
age zur Optik tr
¨
uber Medien,
speziell kolloidaler Metall
¨
osungen. Annalen der
Physik, 4(25):377–445. https://doi.org/10.1002/andp.
19083300302.
Rathod, K. S., Hamshere, S. M., Jones, D. A., and Mathur,
A. (2015). Intravascular ultrasound versus optical co-
herence tomography for coronary artery imaging –
apples and oranges? Interv Cardiol, 10(1). https:
//doi.org/10.15420/icr.2015.10.1.8.
Samei, E. and Peck, Donald J., editors (2019). Hendee’s
Physics of Medical Imaging. JohnWiley & Sons, Inc.,
9600 Garsington Road, Oxford, OX4 2DQ, UK, 5
th
edition.
Sch
¨
utzenberger, K., Pfister, M., Messner, A., Fr
¨
ohlich,
V., Garh
¨
ofer, G., Hohenadl, C., Schmetterer, L.,
and Werkmeister, R. M. (2019). Comparison of
optical coherence tomography and high frequency
ultrasound imaging in mice for the assessment of
skin morphology and intradermal volumes. Sci-
entific Reports, 9(13643). https://doi.org/10.1038/
s41598-019-50104-4.
Vo-Dinh, T., editor (2003). Biomedical Photonics Hand-
book. CRC Press LLC, 2000 N.W. Corporate Blvd.,
Boca Raton, Florida 33431, USA, 1
st
edition.
Webster, John G., Ritenour, E., Tabakov, S., and Ng, K.,
editors (2000). Webb’s Physics of Medical Imaging.
CRC Press Taylor & Francis Group, 6000 Broken
Sound Parkway NW, Suite 300, USA, 2
nd
edition.
ZEMAX LLC (2020). Opticstudio
®
. https://www.zemax.
com/products/opticstudio.
Numerical Simulated Concept and Mechanical Proof of Concept for a Transmission OCT (tOCT)
31
