Metrology and Standardization of High Speed Pluggable Optical
Interconnects
Robert Ferguson
1
, Irshaad Fatadin
1
, Ka-Ming Liu
1
, Irene Barbeito
1
, Christian Hart
1
, Richard Pitwon
2
and David Robinson
3
1
National Physical Laboratory, Teddington, TW11 0LW, U.K.
2
Resolute Photonics, Northover House, 132a Bournemouth Road, Chandlers Ford, Eastleigh, SO53 3AL, U.K.
3
Arden Photonics, Royston House, 267 Cranmore Blvd, Shirley, Solihull, B90 4QT, U.K.
rpitwon@resolutephotonics.com, david.robinson@ardenphotonics.com
Keywords: Electro Optical Circuit Board (EOCB), Polymer Waveguides, Attenuation, Encircled Flux, BER.
Abstract: This paper describes research carried out under EURAMET project 14IND13 on the characterization of short-
range optical interconnect technology. This paper aims to disseminate to the wider communications sector the
primary importance of metrology and the need for standards associated with these emerging technologies.
The focus of the research is the functional performance of embedded polymer waveguides. The results of
various crucial parameters are described and their relevance and influence upon existing national and
international standards discussed.
1 INTRODUCTION
Continuing high growth in the world’s data traffic has
led to many improvements in fibre and detector
technologies (Hogan, 2017). Along with these
developments has been the need to develop optical
short range or ‘intra-rack’ links within data centres to
reduce the bandwidth bottleneck thereby providing
seamless connectivity from external optical
networks/data centres through to inter pod, cluster
and rack level (Senko, 2020). Optical links on a
pluggable daughter board offer vastly improved data
transfer speeds compared with copper based electrical
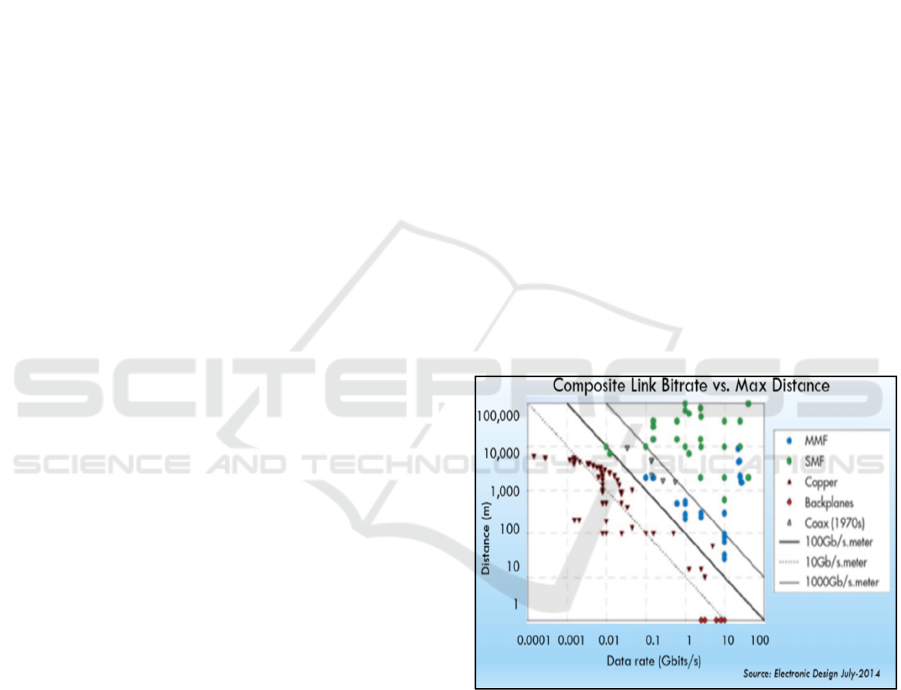
interfaces which are fundamentally limited in terms
of bitrate over distance to ~100Gb/s/m compared to
optical interfaces (>1000Gb/s/m). These optical links
can be incorporated into PCB boards and are known
as electro-optical circuit board (EOCB’s).
Broadly EOCBs fall within three categories:
Fibre-optic laminate, polymer waveguides (Ingham et
al., 2006) and planar glass waveguides (Pitwon,
2016). In the work presented in this paper, we focused
on the characterisation of the polymer waveguides
and studied the thermal impact on three key
parameters; namely EF, total attenuation and bit error
ratio (BER).
Figure 1: Technology Summary of Link Bitrate vs
Distance.
2 INDUSTRIAL NEED
As the technology rapidly develops there is a
corresponding need to provide characterisation of
these boards for the key operational parameters such
as attenuation, isolation (crosstalk) and BER as well
as a need to provide standardisation through the
activities of international standards bodies. The
market research firm CIR states, ‘…the lack of
Ferguson, R., Fatadin, I., Liu, K., Barbeito, I., Hart, C., Pitwon, R. and Robinson, D.
Metrology and Standardization of High Speed Pluggable Optical Interconnects.
DOI: 10.5220/0010171900630067
In Proceedings of the 9th International Conference on Photonics, Optics and Laser Technology (PHOTOPTICS 2021), pages 63-67
ISBN: 978-989-758-492-3
Copyright
c
2021 by SCITEPRESS – Science and Technology Publications, Lda. All rights reserved
63
standards has held back growth in optical engine use.
If such standards emerge, CIR expects the market for
optical engines could reach $1.2 billion by 2022’
(Lightwave Staff article, 2017). Significant recent
work within the International Electrotechnical
Commission (IEC) technical committee 86, has
improved standardisation of critical measurements as
well as the adoption of a reliable measurement
definition system for optical interconnects. This is a
crucial prerequisite for future commercial adoption of
optical circuit board technology (IEC 62496-2:2017
(E) - Optical circuit boards - Basic test and
measurement procedures - Part 2: General guidance
for definition of measurement conditions for optical
characteristics of optical circuit boards). As stated in
62496-2:2017 (E), ‘Independent repeatability of
waveguide measurements is still very difficult to
achieve due to the lack of clarity on how
measurement conditions are specified…such a
definition system shall capture sufficient information
about the measurement conditions to ensure that the
results of measurement on an identical test sample by
independent parties will be consistent within an
acceptable margin of error’.
A clear understanding of the measurement
condition goes hand in hand with an understanding of
the functional performance of an EOCB. While work
has been carried out in assessing passive boards by
industry and academic institutions for a number of
years (Selviah, 2010), less work has been carried out
to understand a boards performance at operational
temperatures. Industry led discussions have shown a
need to investigate the potential effects of applying
thermal hotspots to EOCB’s to simulate expected
electric components integrated within the board.
These components may well be central processor
units (CPU’s) or transceivers. Parameters such as
attenuation, BER and the Encircled Flux (EF) can be
measured during applied and controlled thermal
loading. Effects upon the change in refractive index
(Δn/Δt) as well as the combined stresses on the
mechanics of the board structure are important areas
of investigation that need to be understood as
specifications and standards develop and board
technology improves and becomes more complex.
3 CHARACTERIZATION
The principal instrument used to assess the functional
performance of embedded waveguides is the Variable
Launch System providing a flexible platform to
permit a range of NA’s and spot sizes to be focused
onto the entrance facet of a particular waveguide
(Ives et al., 2011). Transmission through the
waveguide is then received on an IR camera and the
image analysed in a variety of ways to provide
assessments of total attenuation, isolation and EF.
Combining this platform with a suitable unit to apply
a controlled thermal load to a mounted EOCB,
provides a powerful way of assessing the functional
performance of waveguides on a particular board with
respect to the simulation of thermal effects of
incorporated electrical components. The unit chosen
to provide thermal controlled loading was a
Thermostream ATS – 505 purchased from inTEST
Thermal Solutions, Corporation, USA. The
temperature range demanded by the EOCB functional
environment was determined to be ~ -5 to 80°C (IPC-
TM-650, 1997).
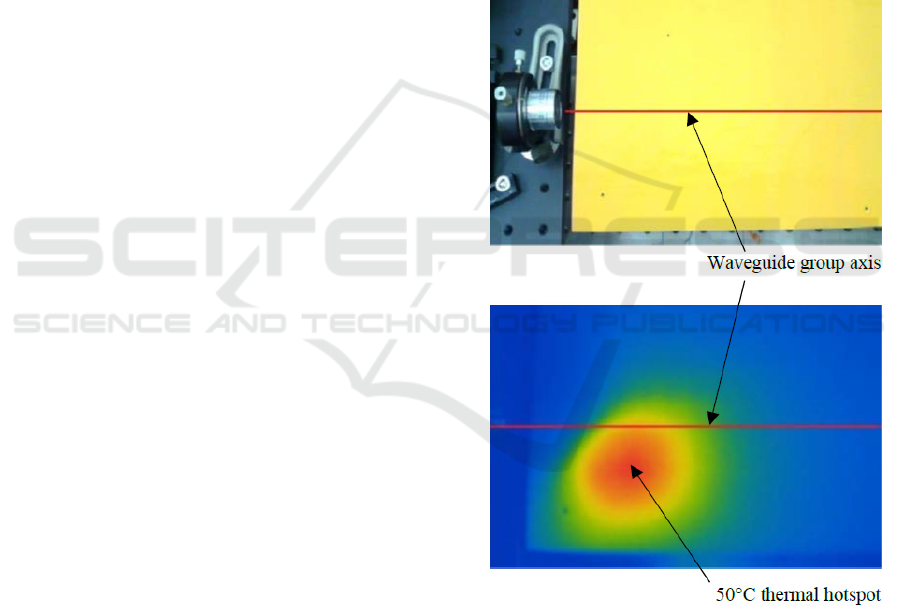
Figure 2: Visible and infra-red images of an example
thermal hotspot on the EOCB using the Thermostream
nozzle and selected circular shroud.
The siloxane (Kai Su et al., 2005) polymer
waveguides of the test EOCB were produced
photolithographically and mounted on an FR4
substrate board. Each waveguide supports many
modes so there is necessarily an importance placed on
the nature of the light that enters the guide as this will
determine modal and energy distribution exiting the
PHOTOPTICS 2021 - 9th International Conference on Photonics, Optics and Laser Technology
64
guide. Ideal launch conditions should occur if the
light is distributed through the whole core (IEC
61300-1, 2016). With multimode waveguides, launch
conditions may typically be characterized as being
underfilled or overfilled, neither of which are
considered optimal as both can result in measurement
variations. Knowing and controlling the launch
condition is therefore important to make sense of any
measurements upon parameters that help characterize
link losses and bandwidth utilisation.
In order to assess the launch conditions of the
NPL system, an Arden Photonics’ Modal Explorer
MPX-1 was placed to accommodate the 850 nm
launch spot. By altering the launch NA and spot size
of the system preliminary measurements showed the
EF was within prescribed EF templates as stipulated
in IEC 61280-4-1/Ed3/CD:2015. Modal conditioning
was also incorporated into the variable launch system
to ensure conformity to key recommended launch
profiles as defined in Table 1 of IEC 62496-2:2017
(E). The ‘L2’ launch profile was preferred ‘…in
which the modal profile is generated, which complies
with the restricted launch EF requirements of IEC
61280-4-1/Ed3/CD:2015’ (Ibid.) and to achieve this
launch profile, modal conditioning was used (IEC
61300-1, 2016). The source was passed into a 5m
graded index multimode fibre (GI-MMF) which is
wrapped 20 times around a 38 mm diameter mandrel.
The output of the mandrel is then passed through a
commercial mode conditioner supplied by Arden
Photonics, producing a mode filtered optical intensity
profile, which complies with EF requirement of IEC
61280-4-1. This is then used as the input to a 5 m GI-
MMF, which is wrapped 20 times around the 38 mm
diameter mandrel to produce a mode-stripped optical
intensity profile at the GI-MMF launch facet. Once
the launch condition has been established
measurements could be carried out for the
attenuation, EF and BER of selected waveguides.
4 RESULTS
4.1 Total Attenuation across the
Thermal Range
The board was mounted on a large translation stage
and secured using silicone gel pads that provided a
method to prevent the board from moving during the
measurement runs and to counter any possible low
frequency vibrations. Careful alignment was
necessary to ensure that the launch spot was centrally
located on the front facet of the selected waveguide.
The receive board was brought into place and
alignments carried out to ensure the image of the
illuminated waveguide was projected onto the centre
of the CCD. The signal image was analysed to find
the centre of the intensity and the total power was
found by summing all the pixels contained within a
circular area around this centre. The diameter of this
virtual pinhole was adjusted to capture all the light
exiting these waveguides. In the case of these
relatively large waveguides a 150 µm virtual pinhole
was used. To calculate attenuation, the ratio of the
total input to the input image reference was divided
by the ratio of the total output to its reference. This
measurement technique provided the insertion loss of
the waveguide under test, which includes intrinsic
waveguide loss and coupling losses. The results for a
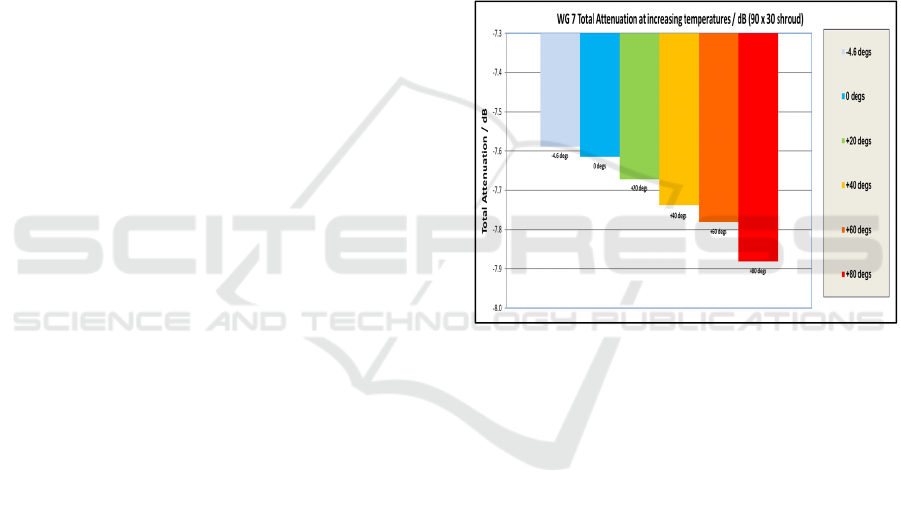
selected waveguide are shown below.
Figure 3: Total attenuation against temperature for a
particular waveguide.
The increase in applied thermal load indicates a
small, but observable increase in the total attenuation.
The maximum range of the measured total attenuation
was ~0.3 dB using the 90 x 30 mm shroud centrally
placed over the waveguide group. The expanded
uncertainties associated with the measurements are
estimated as ranging from U95 < +/- 0.1 dB at 20°C
and +/- 0.20 dB at 80°C. These are derived from
observed repeatable measurements and the
established system uncertainties (Ives et al., 2011).
4.2 Encircled Flux across Thermal
Range
The board was again setup to receive the controlled
launch condition ‘L2’. The MPX-1 was used at the
output facet of the waveguide and the focus
optimized. EF measurements were made covering the
same thermal range as for the attenuation
measurements and the same size of shroud and
Metrology and Standardization of High Speed Pluggable Optical Interconnects
65
position on the board. Measurements were carried out
on two waveguides (WG5 and 7) using 1000 averages
in order to capture the modal energy distribution. In
each case the ambient temperature was recorded. As
with the total attenuation, the increase in applied
thermal load indicates a small but observable shift in
the Encircled Flux profiles consistent with higher
order modes being decoupled from the guide due to
the effects of the increased thermal load upon the
guide and associated changes in the core cladding
refractive index ratio. Preliminary uncertainties
estimated for the EF measurements at the worst-case
repeatability of 80°C give a U95 of +/- 0.0045.
Figure 4: Encircled flux EF defined as the fraction of
cumulative near-field power to the total output power as a
function of radial distance from the optical centre of the
core. This progressive shift is significant as it approaches
and exceeds limits defined by EF templates (as specified in
IEC 61280-4-1/Ed3/CD:2015 at the elevated temperature of
80°C.
4.3 BER across Thermal Range
An arbitrary waveform generator was used to
generate a pseudo-random binary sequences (PRBS)
electrical signal to drive an SFP+ transceiver module.
The intensity modulated signal was launched onto
waveguides 2 and 7 of the board (WG2 and WG7).
The transmitted signal recovered from the photo-
receiver was analysed on a real-time oscilloscope
sampling at 20 GSa/s. An eye diagram of the
transmitted signal from the experimental setup is
shown in below.
Figure 5: Eye diagram of the transmitted signal.
The BER was measured at the operating
temperatures -4.4 ºC, 23 ºC and 80 ºC using the
Thermostream chamber and involved using the same
controlled launch conditioning ‘L2’ as that applied to
attenuation and Encircled Flux measurements. The
BER results are shown in Figure 5. Signal
degradation was observed for the transmitted data at
the extreme temperature of 80 ºC for both
waveguides. The reduction in performance can be
attributed to the increased total attenuation over the
temperature range.
Figure 6: BER measurements on two waveguides for the
operating temperatures -4.4 ºC, 23 ºC and 80 ºC.
5 CONCLUSIONS
The Data Centre Network has significantly increase
in speed, reduced in power and cost in the past 5
years. With continuous pressure to be faster and cost
effective, focus on optics is to overcome limitations
of copper in every aspect (speed and power). This has
encouraged the migration of optical interconnect onto
the board and device level. As the technology rapidly
develops there is a corresponding need to provide
characterisation of these boards for key operational
PHOTOPTICS 2021 - 9th International Conference on Photonics, Optics and Laser Technology
66

parameters such as attenuation, isolation (crosstalk)
and bit error ratio (BER) as well as a need to provide
standardisation through the activities of international
standards bodies. The market research firm CIR
states, ‘…the lack of standards has held back growth
in optical engine use. If such standards emerge, CIR
expects the market for optical engines could reach
$1.2 billion by 2022’ (Lightwave Staff article, 2017).
Significant recent work within the International
Electrotechnical Commission (IEC), principally
through the work of the IEC technical committee 86,
has improved standardisation of key measurements as
well as the proposed adoption of a reliable
measurement definition system for optical
interconnects. This is seen as a crucial prerequisite for
future commercial adoption of optical circuit board
technology. As stated in IEC 62496-2:2017 (E),
‘Independent repeatability of waveguide
measurements is still very difficult to achieve due to
the lack of clarity on how measurement conditions are
specified…such a definition system shall capture
sufficient information about the measurement
conditions to ensure that the results of measurement
on an identical test sample by independent parties will
be consistent within an acceptable margin of error’. It
is now the case that a Measurement Identification
Coding (MIC) system has been incorporated within
the standard with the principal aim to support
harmonization of global reference measurements of
these pluggable interconnects (IEC 62496-2, 2017).
A clear understanding of the measurement
condition goes hand in hand with an understanding of
the functional performance of an EOCB. While work
has been carried out in assessing passive boards by
industry and academic institutions for a number of
years (Selviah et al., 2010), less work has been carried
out to understand a boards performance at operational
temperatures. Industry led discussions have shown a
need to investigate the potential effects of applying
thermal hotspots to EOCB’s to simulate expected
electric components integrated within the board.
These components may well be central processor
units (CPU’s) or transceivers. Parameters such as
attenuation, BER and the Encircled Flux (EF) can be
measured during applied and controlled thermal
loading. Effects upon the change in refractive index
(Δn/Δt) as well as the combined stresses on the
mechanics and materials of the board structure are
important areas of investigation that need to be
understood as specifications and standards develop
and board technology improves and becomes more
complex. Optics has the potential to replace certain
functionality of electronics such as for optical
switching, optical storage and optical signal
processing. Continuous innovation in optics will
continue to be a big part of future DC networks but
will require corresponding metrological assessment
and standardization.
ACKNOWLEDGEMENTS
The work reported in this paper was funded by project
EMPIR 14IND13 and BEIS. This project 19SIP05
TTPWC has received funding from the EMPIR
programme co-financed by the Participating States
and from the European Union’s Horizon 2020
research and innovation programme, Funder ID:
10.13039/ 100014132.
REFERENCES
Hogan H, 2017. Photonics Spectra, p36.
Senko, 2020. Data Centre Network: Impact on Optical
Interconnect & Component Technology, Lightwave
Webcast.
Ingham, J. D., Bamiedakis, N., Penty, R. V., White, I. H.,
DeGroot, J. V., Clapp, T. V., 2006. Multimode siloxane
polymer waveguides for robust high-speed
interconnects, Conference on Lasers and Electro-
Optics and 2006 Quantum Electronics and Laser
Science Conference.
Pitwon, R., 2016. Advances in Photonic Interconnect for
Data Centre Subsystems, Seagate Systems, UK, 4th
Symposium on Optical Interconnect in Data Centres,
ECOC 2016, Düsseldorf, Germany.
Lightwave Staff article, 2017. Board-level optical
interconnects sales to hit $5.6 billion by 2022:CIR.
Selviah D et al, 2010. Integrated optical and electronic
interconnect PCB manufacturing research, Circuit
World, 36, 5–19.
Ives D et al, 2011. Development of a variable launch
attenuation and isolation measurement system for
optical waveguides, Applied Optics, Vol. 50, No. 22.
IPC-TM-650, 1997. Test Methods Manual, The Institute for
Interconnecting and Packaging Electronic Circuits,
Doc. No. 2.6.7, Rev. A.
Kai Su, Jon V. DeGroot, Jr., Ann W. Norris and Peter Y.
Lo., 2005. Siloxane Materials for Optical Applications,
Advanced Technologies and Venture Business, Dow
Corning Corporation, 2200 W. Salzburg Road,
Midland, MI, USA 48686. Proc. Of SPIE Vol. 6029
IEC 61300-1:2016 - Fibre optic interconnecting devices
and passive components – Basic test and measurement
procedures – Part 1: General and guidance.
IEC 62496-2:2017 (E) - Optical circuit boards - Basic test
and measurement procedures - Part 2: General guidance
for definition of measurement conditions for optical
characteristics of optical circuit boards.
Metrology and Standardization of High Speed Pluggable Optical Interconnects
67
