
Estimating the Probability Density Function of New Fabrics for Fabric
Anomaly Detection
Oliver Rippel
1 a
, Maximilian M
¨
uller
1
, Andreas M
¨
unkel
2
, Thomas Gries
2
and Dorit Merhof
1 b
1
Institute of Imaging & Computer Vision, RWTH Aachen University, Aachen, Germany
2
Institut f
¨
ur Textiltechnik, RWTH Aachen University, Aachen, Germany
Keywords:
Anomaly Detection, Quality Control, Fabric Inspection, Transfer Learning, Probability Density Estimation.
Abstract:
Image-based quality control aims at detecting anomalies (i.e. defects) in products. Supervised, data driven
approaches have greatly improved Anomaly Detection (AD) performance, but suffer from a major drawback:
they require large amounts of annotated training data, limiting their economic viability.
In this work, we challenge and overcome this limitation for complex patterned fabrics. Investigating the
structure of deep feature representations learned on a large-scale fabric dataset, we find that fabrics form
clusters according to their fabric type, whereas anomalies form a cluster on their own. We leverage this
clustering behavior to estimate the Probability Density Function (PDF) of new, previously unseen fabrics, in
the deep feature representations directly. Using this approach, we outperform supervised and semi-supervised
AD approaches trained on new fabrics, requiring only defect-free data for PDF-estimation.
1 INTRODUCTION
The textile industry is one of the biggest industries in
the world, producing several million tons of fabric ev-
ery year. With ever-increasing technological progress,
fabric production has become a highly optimized pro-
cess, leading to low error rates.
Despite their rare occurrence, fabric anomalies
still have a strong economic impact, making their
detection an essential aspect of fabric production.
However, Anomaly Detection (AD) in fabrics is still
largely performed by human operators, and the out-
come depends on training, skill level and fatigue of
the personnel. Even at peak performance, human op-
erators are only capable of detecting 60-80% of de-
fects (Karayiannis et al., 1999; See, 2012), while ac-
counting for at least 10% of total labor costs (New-
man and Jain, 1995). Together, this calls for machine
vision solutions that are capable of automated defect
detection.
With recent advances in Machine Learning,
learning-based approaches have seen a strong in-
crease in performance, becoming ever more relevant
for automated defect detection. Based on the required
degree of supervision, learning-based approaches can
a
https://orcid.org/0000-0002-4556-5094
b
https://orcid.org/0000-0002-1672-2185
be categorized into supervised, semi-supervised and
unsupervised algorithms. In the context of AD, these
categories are defined as follows (Chandola et al.,
2009; Ruff et al., 2020a):
• supervised: providing a fully labeled dataset con-
taining both anomalies as well as normal data.
• semi-supervised: providing a dataset that con-
tains normal data only.
1
• unsupervised: providing an unlabeled dataset,
i.e. a dataset that consists mostly of normal data
but may also contain anomalies.
As fabric defects are rare events and expensive to
sample, semi-supervised algorithms are most com-
monly employed in literature. These algorithms have
been shown to work for fabrics of low complexity (i.e.
unimodal appearance), but show limited performance
in fabrics of high complexity (i.e. multimodal appear-
ance) (Mei et al., 2018; Hu et al., 2019).
Supervised approaches have also been success-
fully applied to fabric defect detection, adapting clas-
sification and object detection approaches such as
ResNet and YOLO (Zhang et al., 2018; Gao et al.,
1
Note that work exists on general semi-supervised algo-
rithms that can also make use of partially labeled datasets,
but this is not considered further in our work. For details,
we refer to (Ruff et al., 2020a).
Rippel, O., Müller, M., Münkel, A., Gries, T. and Merhof, D.
Estimating the Probability Density Function of New Fabrics for Fabric Anomaly Detection.
DOI: 10.5220/0010163604630470
In Proceedings of the 10th International Conference on Pattern Recognition Applications and Methods (ICPRAM 2021), pages 463-470
ISBN: 978-989-758-486-2
Copyright
c
2021 by SCITEPRESS – Science and Technology Publications, Lda. All rights reserved
463

2019). However, while progress has been made with
respect to detection performance, none of the super-
vised approaches suit the need of the textile industry
for low changeover times. The reason for this is that
defects have to be collected and annotated to yield a
sufficiently large image basis for every individual fab-
ric, which is a tedious, time-consuming and expensive
process.
While algorithms have been proposed to tackle
this limitation, research focusses on synthesizing new
defective images based on prior knowledge about de-
fect appearances. This knowledge may either be
learned implicitly by Generative Adversarial Net-
works (GANs) (Liu et al., 2019; Rippel et al., 2020b),
or explicitly inferred from experts (Han and Yu,
2020).
In this work, we propose an alternative approach:
we hypothesize that the deep feature representa-
tions learned by a supervised model on a large-scale
fabric dataset are discriminative also to new fabric
types unseen during training. We analyze the struc-
ture of learned deep feature representations using t-
distributed Stochastic Neighbor Embedding (t-SNE),
and find that fabrics form clusters according to their
fabric type, with anomalies forming an additional
cluster on their own. Based on this finding, we con-
struct an AD model for new fabrics unseen during
training by approximating their Probability Density
Function (PDF) in the deep representations, achiev-
ing state-of-the-art performance.
1.1 Related Work
In previous work, it has been shown that it is possi-
ble to train supervised (Wu et al., 2020) and semi-
supervised (Han and Yu, 2020) fabric defect detec-
tion methods that can generalize well within a diverse
fabric defect dataset. However, Liu et al. (Liu et al.,
2019) show poor out-of-the-box performance for su-
pervised fabric defect segmentation applied to new
fabrics, and demonstrate that detection performance
can be increased by using synthetic defects gener-
ated by GANs in addition to normal fabric images for
model fine-tuning. Additionally, Rippel et al. (Rippel
et al., 2020b) show that supervised defect detection
models can also be trained from scratch on new fab-
rics, again employing defects generated by GANs in
combination with normal fabric images as the training
dataset. While defect synthesis by means of GANs
is also popular for improving performance at gen-
eral surface inspection tasks (Le et al., 2020), GANs
are known to be notoriously difficult to train (Miyato
et al., 2018), diminishing the practical applicability of
developed approaches.
Weninger et al. (Weninger et al., 2018) demon-
strate that fabric defect detection is possible on fabrics
unseen during training without relying on defects syn-
thesized by GANs. However, their approach necessi-
tates high-resolution images for float-point detection,
increasing computational burden for an eventual ma-
chine vision solution. Furthermore, their work uti-
lizes plain-weave fabrics with simple patterns only.
While not directly applied to the AD task, Lee
et al. (Lee et al., 2018) show that out-of-distribution
(OOD) detection can be achieved by modeling the
PDF of input images in learned deep feature represen-
tations. This is achieved by linking generative models
using Gaussian Discriminant Analysis on deep fea-
tures to discriminative models trained by the softmax-
crossentropy loss. The linkage between deep genera-
tive and discriminate models has been applied by Rip-
pel et al. to the industrial AD use case (Rippel et al.,
2020a).
Together, this motivated us to construct a transfer-
able fabric anomaly detector by modeling the PDF of
new fabrics in deep feature representations learned by
training on a large-scale fabric dataset, which is pre-
sented in more detail in the following.
2 MODELING THE PDF FOR
CROSS-FABRIC ANOMALY
DETECTION
We aim to construct a transferable anomaly detector
for fabrics by modeling the PDF of new fabrics in
deep feature representations. While features learned
by Image-Net training have been successfully applied
to the industrial AD task in a transfer learning set-
ting (Andrews et al., 2016; Rippel et al., 2020a),
the 4-channel dimensionality of our data (cf. Section
3) prevents a straight-forward use of Image-Net fea-
tures. Therefore, we instead learn domain-specific
features from scratch using subsets of our collected
dataset by training a supervised, deep anomaly detec-
tor. We then extract the deep features before the final
mapping to the anomaly score to model the PDF of
new fabrics unseen during training, as deeper features
have shown increased performance also in the trans-
fer learning AD setting (Andrews et al., 2016; Rippel
et al., 2020a).
Rippel et al. (Rippel et al., 2020a) have shown that
the individual dimensions of deep feature represen-
tations learned by discriminative models are highly
correlated. Therefore, the model used to estimate the
PDF of new fabrics should be multivariate.
ICPRAM 2021 - 10th International Conference on Pattern Recognition Applications and Methods
464

2.1 Modeling Unimodal PDFs
For unimodal data, the PDF can be modeled by us-
ing a multivariate Gaussian (Bishop, 2006). A use-
ful anomaly score here is the Mahalanobis distance
(Mahalanobis, 1936), which uniquely determines the
value of an observation’s PDF under the Gaussian.
We estimate the mean of the multivariate Gaus-
sian using Maximum Likelihood (ML) estimation,
which corresponds to the empirical mean. For the co-
variance matrix, we apply shrinkage as proposed by
Ledoit et al. (Ledoit et al., 2004). Regularization by
means of shrinkage is necessary since the number of
observations used for fitting is in the same order of
magnitude as the dimensionality of the fitted Gaus-
sian (refer Table 1).
2.2 Modeling Multimodal PDFs
For multimodal data, the PDF can be approximated
by fitting a Gaussian Mixture Model (GMM), i.e. a
linearly weighted sum of individual Gaussians
p(x) =
K
∑
i=1
φ
i
N (x|µ
i
, Σ
i
), (1)
with
∑
K
i=1
φ
i
= 1. We approximate the parameters of a
GMM by using the Expectation Maximization (EM)
algorithm (Bishop, 2006).
Compared to the unimodal setting, modeling mul-
timodal PDFs by means of GMMs introduces an
additional hyperparameter, the number of Gaussian
mixture components K. We estimate K by using
the Bayesian Information Criterion (BIC) proposed
by Schwarz et al. (Schwarz et al., 1978). While
other metrics such as the Akaike information criterion
(AIC) exist, we choose the BIC score for its strong
regularization characteristics.
For the multimodal setting, a sensible anomaly
score is the negative log-likelihood of x defined as
NLL = −log(p(x)). (2)
We also propose min(M
i
(x)), i.e. the minimum Ma-
halanobis distance for all Gaussian Mixture compo-
nents, as a possible anomaly score to account for large
differences in φ.
2.3 Learning Deep Feature
Representations
In order to learn the deep representations required by
our approach, we train a ResNet18 (He et al., 2016)
from scratch in a Leave-One-Out (LOO) manner for
each fabric present in the dataset, where all fabrics
except the one evaluated on are used for training (cf.
Figure 2). We employ the sigmoid-crossentropy loss
together with the Adam optimizer (Kingma and Ba,
2015), an initial learning rate of 0.001 and a batch-
size of 16, training for 15k iterations in total.
To improve robustness of our evaluation w.r.t. the
initially available fabric dataset, we performing an ad-
ditional 5-fold evaluation on each respective dataset
used for feature learning stratified for anomaly preva-
lence, reporting averaged results for our approach.
2.4 Modeling PDF on Held Out Fabric
After having learned the deep feature representations,
we apply our PDF modeling strategies to each held
out fabric. We make use of two different datasplits
to enable fair comparison with both supervised and
semi-supervised reference methods that serve as a
benchmark. First, we estimate the PDF of the held
out fabric using the training set of a supervised split,
where anomalous data is removed from the training
set (see Figure 2). We refer to this setting as “clean”,
and can use it to compare against supervised base-
lines as our method assumes that only “normal” data
is used for estimating the PDF. Second, we estimate
the PDF of the held out fabric using the training set
of a semi-supervised split, where anomalous data is
only present in the test set (cf. Section 1 and Figure 2).
In addition to these two splits, we also estimate the
PDF of the held out fabric using the training set of a
supervised split where anomalous data remains in the
training set (see Figure 2). This setting corresponds to
applying our strategy in an unsupervised manner, i.e.
where unlabeled anomalies are present during PDF
estimation.
For each splitting variant, we first model the PDF
of the new fabric using the training set and then apply
the constructed AD model to the respective test set
that is identical to the one used by our baselines. For
the GMM setting, models were fit for K ∈ {2, ..., 19}
mixture components, and the best model was selected
based on lowest BIC on the training set.
Note that model weights are fixed and the data
of held out fabrics used only to parametrize the PDF
models. Also, validation sets of held out fabrics are
unused by our approach, giving an additional advan-
tage to the reference methods and yielding strong
baselines.
To investigate the benefit of our proposed PDF
modeling, we also apply the discriminative decision
boundary learned on the deep feature representations
during training of our deep feature extracting model
(henceforth refered to as LOO model) to the held out
fabrics.
Estimating the Probability Density Function of New Fabrics for Fabric Anomaly Detection
465

3 DATASET
The fabric dataset used in this work comprises a total
of 20 patterned fabrics. For each fabric, paired front-
light RGB and backlight luminance were acquired at
2000 DPI resolution, resulting in a 4 channel image.
A defective as well as a defect-free sample image can
be found in Figure 1.
In total, the dataset contains 4270 samples across
all fabrics, of which 320 are labeled as defective (see
Table 1).
Table 1: Characteristics of the used dataset.
Fabric
images
normal defective
1 470 14
2 242 5
3 148 16
4 229 19
5 227 9
6 530 16
7 388 19
8 159 6
9 118 26
10 78 6
11 35 5
12 112 35
13 201 13
14 64 7
15 305 20
16 45 7
17 389 45
18 55 16
19 42 17
20 113 19
total 3950 320
4 EXPERIMENTS AND RESULTS
In our work, we hypothesize that deep representations
learned by a supervised model on a large-scale fabric
dataset are discriminative also to new fabric types un-
seen during training, and propose to achieve this by
modeling the PDF of new fabrics in learned represen-
tations directly.
To test our hypothesis, we evaluate our approach
on every single fabric of the dataset individually, ag-
gregating single fabric performances to generate ro-
bust insights. Similarly, we also train state-of-the
art supervised and semi-supervised AD algorithms on
each fabric to serve as comparison.
(a) front-light (b) backlight luminance
(c) front-light (d) backlight luminance
Figure 1: Representative defect-free (a-b, fabric 8) and de-
fective (c-d, fabric 2) sample images.
Evaluation Details. As AD poses a binary deci-
sion problem, we report the Area Under the Receiver
Operator Characteristic (ROC) curves as well as the
Area Under the Precision Recall (AUPR) curve to
evaluate model performance. Note that the AUPR is
better suited to report results for skewed/imbalanced
datasets such as ours. Further, to improve robustness
of evaluations, a 5-fold evaluation is performed for
each held out fabric (refer Figur 2 for details).
Supervised Reference Method. As a baseline for
supervised AD methods, we train a ResNet18 from
scratch on each individual held out fabric on the su-
pervised splits as outlined in Figure 2. Training pa-
rameters are identical to those used for feature learn-
ing (refer Section 2.3). Model selection was per-
formed based on AUPR achieved on the validation
set.
Semi-supervised Reference Method. For the
semi-supervised baseline, we train a convolutional
autoencoder from scratch on each individual held out
fabric, using ResNet18 as encoder and an “inverted”
ResNet18 as decoder (i.e. every operation of the
encoder should be inverted by the decoder). For
the upsampling operations we employ pixel shuffle
as introduced by Shi et al. (Shi et al., 2016) to
reduce checkerboard artifacts which would be present
otherwise. The latent dimension of the bottleneck
is set to 32 and yields proper reconstruction of
normal images in all fabrics. We train the model
using the structured-similarity measure and select
ICPRAM 2021 - 10th International Conference on Pattern Recognition Applications and Methods
466
LOO 1
. . .
LOO 2
. . .
LOO 3
. . .
. . . . . . . . . . . . . . .
Total number of fabrics
All samples
Supervised split
train val test
Semi-supervised split
train val test
1. Learning Features
2. Modeling PDF of held out fabric
normal samples anomalous samples
anomalous samples removed in “clean” setting
fabrics used for feature training
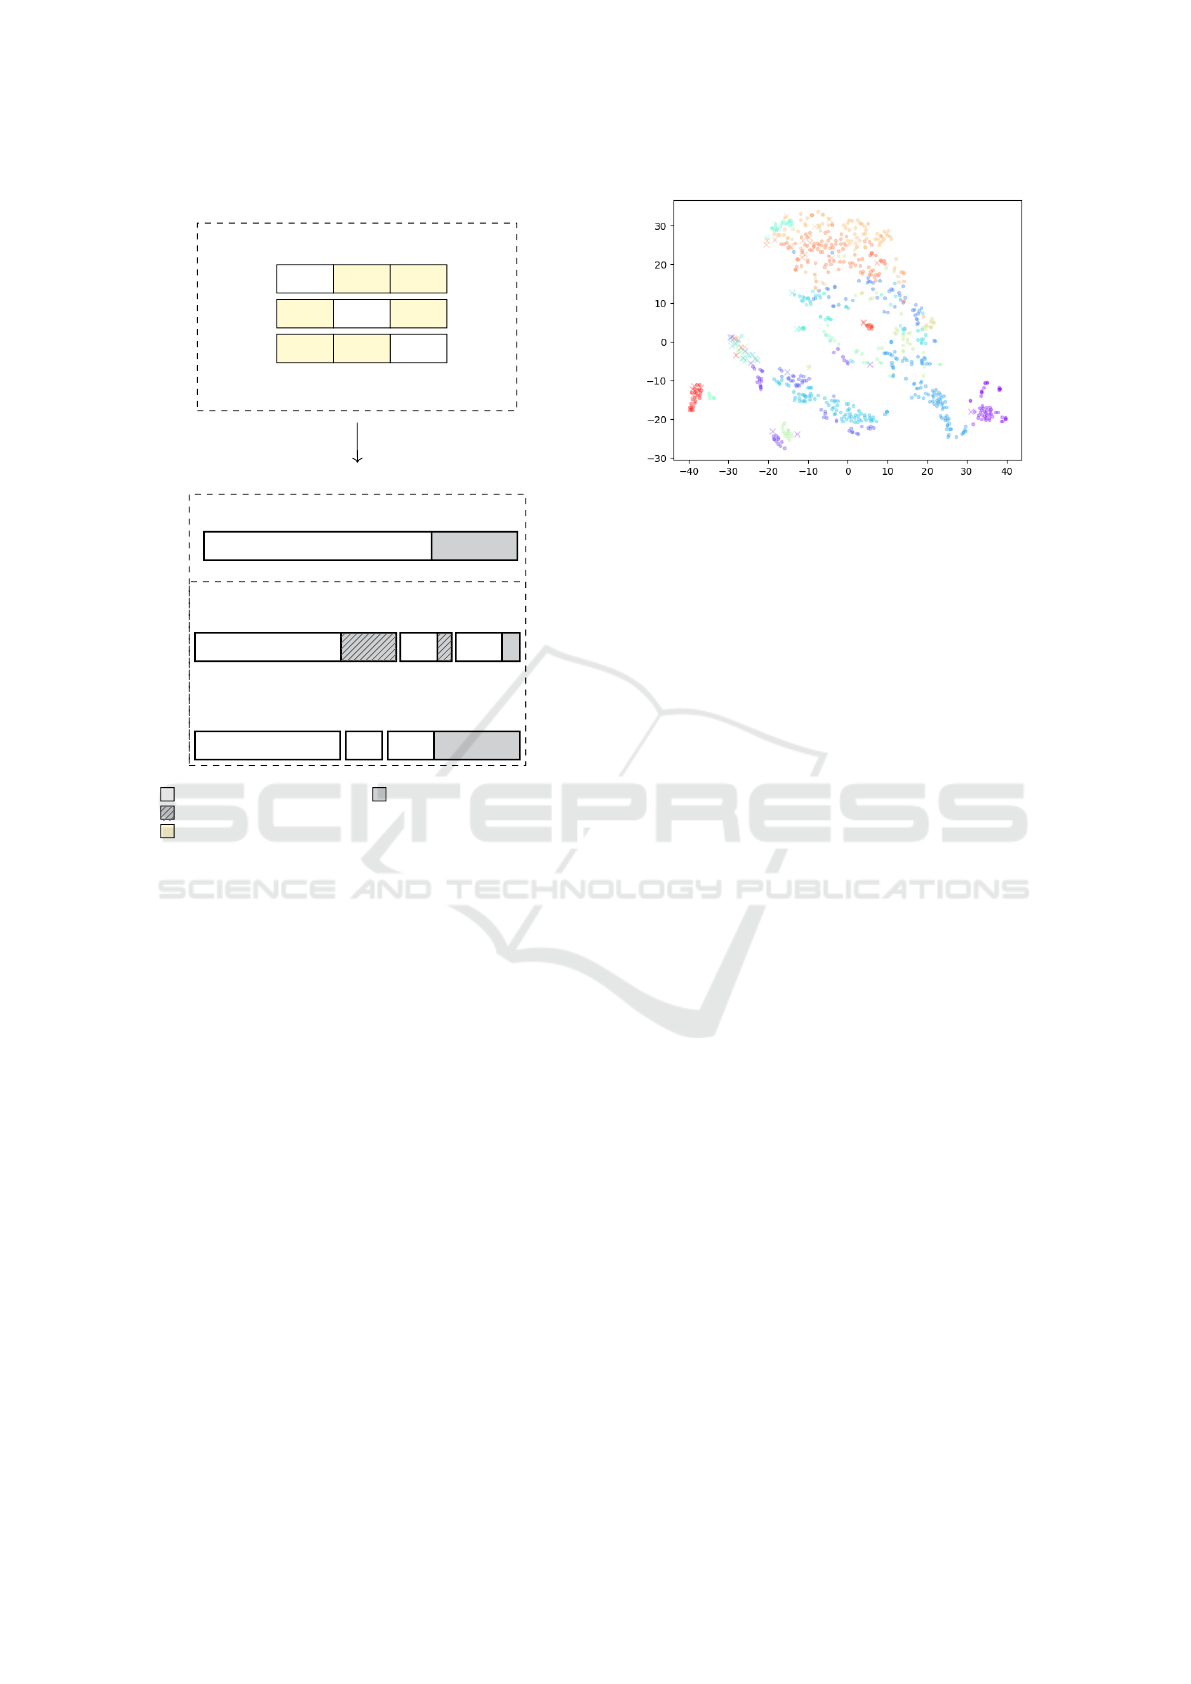
Figure 2: Evaluation pipeline of our approach. In a first
step, we learn the deep features required by our approach
in a Leave-One-Out (LOO) manner, where a single fabric
is held out per run. In the second step, we model the Prob-
ability Density Function of the held out fabric in the deep
features using three different splits (supervised, supervised
– “clean” and semi-supervised).
the model based on the lowest reconstruction loss on
the validation set, and training is performed using
the Adam optimizer together with an initial learning
rate of 0.0005 and a batch-size of 16 for a total of
45k iterations. As autoencoders yield residual images
as output, an aggregation is necessary to yield an
image-level anomaly score. While the threshold
employed for ROC/PR calculation is set on the pixel
level, we perform connected component analysis and
label a test image as defective only if it contains a
connected component at least as big as the smallest
anomaly present in the test dataset. Note that by
extracting the minimal anomaly size from the test
set, knowledge is introduced to the autoencoder
approach, increasing complexity of the procedure
and giving it an additional advantage.
Figure 3: Distribution of deep representations learned by
a supervised multi-fabric Anomaly Detection model. Fea-
tures are extracted from the last layer of a ResNet18 model
before the final mapping and visualized by means of t-SNE.
Dots denote normal data, whereas crosses denote anoma-
lies. Individual fabrics are color-coded.
Implementation Details. For all approaches, im-
ages are resized to a size of 896 × 896 pixels and
training is performed in a patch-wise manner on
224 × 224 sized patches. We replace Batch Normal-
ization with Instance Normalization (Ulyanov et al.,
2016) for all models which was seen to improve
performance in every method in preliminary exper-
iments. For supervised methods (i.e. feature learn-
ing step of our method and the supervised refer-
ence method), patches are cropped around the de-
fect if available (and randomly otherwise), and ran-
dom oversampling was applied to ensure that 25% of
training samples were defective. For semi-supervised
methods, patches are cropped randomly. Inference is
subsequently performed on whole images, spatially
averaging patch-wise generated features and predic-
tions respectively for the supervised methods. For the
semi-supervised methods, patch-wise predictions are
stitched to form a 896 × 896-sized reconstructed im-
age as the basis for residual computation. Connected
component analysis as described above is applied to
the stitched residual image.
Results. Table 2 shows that applying the LOO
model to the held out fabrics without any modifi-
cations (i.e. applying the decision boundary learned
on the large-scale fabric dataset) already performs
comparably to the respective reference methods (cf.
Table 2). Results also show that additional perfor-
mance is gained by our proposed PDF modeling of
new fabrics in the learned representations. Here, it
can be seen that multimodal distributions modeled by
GMMs outperform unimodal distributions. Specifi-
cally, an AUPR of 86.0 ± 12.9% (Mean ± STD) is
achieved for GMM modeling and NLL anomaly score
Estimating the Probability Density Function of New Fabrics for Fabric Anomaly Detection
467
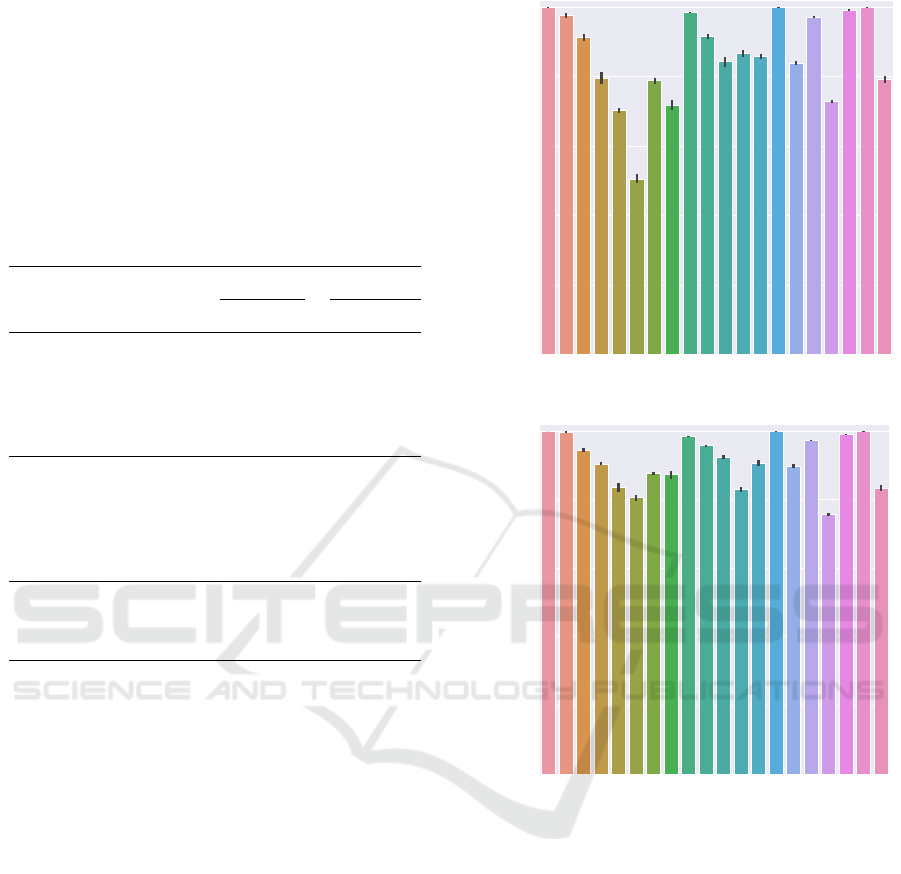
Table 2: Evaluating Anomaly Detection performance.
Highest values are boldfaced for Mean, whereas lowest
values are boldfaced for STD. Leave-One-Out (LOO) de-
notes our proposed approach using either unimodal Gaus-
sian (Gaussian) or multimodal Gaussian Mixture Model
(GMM) in distance to nearest mixture component (GMM
maha) or likelihood mode (GMM NLL). LOO alone de-
notes applying the initially learned decision boundary to the
new fabric. Connected Component AutoEncoder (CCAE)
refers to the semi-supervised benchmark, and Classifier to
the supervised benchmark. For details regarding data splits
we refer to Figure 2. Abbreviations: s = supervised, ss =
semi-supervised, us = unsupervised.
split method
AUPR AUROC
Mean STD Mean STD
s
Classifier 68.1 34.6 85.2 22.3
LOO 65.8 32.0 85.9 16.8
LOO Gaussian 69.0 30.6 87.0 15.3
LOO GMM maha 72.3 21.8 89.8 8.9
LOO GMM NLL 73.2 20.9 91.2 7.4
ss
CCAE 78.1 22.7 87.3 14.9
LOO 80.1 18.1 86.1 11.4
LOO Gaussian 82.7 15.3 87.0 11.1
LOO GMM maha 84.7 14.3 89.8 8.9
LOO GMM NLL 86.0 12.9 91.4 7.3
us
LOO Gaussian 54.9 31.0 82.8 16.2
LOO GMM maha 27.0 13.0 53.6 7.4
LOO GMM NLL 29.6 12.0 58.7 11.1
compared to 82.7 ± 15.3% for the unimodal Gaussian
in the semi-supervised setting (cf. Table 2). This indi-
cates that the PDF of individual fabrics in the learned
representations is indeed multimodal, which is further
supported by the clustering tendencies observed in la-
tent space visualization (cf. Figure 3), where two dis-
tinct clusters can be observed for the fabric colored in
red. Note that both unimodal and multimodal model-
ing of PDFs outperform the respective state of the art,
achieving both higher average AUROC/AUPR values
as well as lower standard deviations (cf. Table 2).
While estimating the PDF by means of GMMs in-
creases AD performance, the method also becomes
more sensitive to unlabeled anomalies in the train-
ing data and fails in the unsupervised setting (cf.
Table 2). Presence of unlabeled anomalies in the
dataset used for PDF estimation also affects the uni-
modal Gaussian negatively, albeit not as strongly as
the GMM variants. Regarding the choice of an ap-
propriate anomaly score for multimodal PDFs, NLL
outperforms minimum Mahalanobis distance consis-
tently by a small margin (cf. Table 2).
When investigating single fabric performance of
the best performing configuration (i.e. GMM based
PDF modeling and NLL as anomaly score on semi-
1 2 3 4 5 6
7
8 9 10 11 12 13 14 15 16 17 18 19 20
0.0
0.2
0.4
0.6
0.8
1.0
fabric
AUPR
1 2 3 4 5 6
7
8 9 10 11 12 13 14 15 16 17 18 19 20
0.0
0.2
0.4
0.6
0.8
1.0
fabric
AUROC
Figure 4: Fabric-level performance results of our LOO
GMM NLL approach plotted as means and standard devia-
tion over all 5 folds of semi-supervised dataset splits.
supervised splits), it can be seen that within-fabric
performance is very robust, whereas performance
across fabrics may vary considerably (Figure 4). This
variation is stronger for AUPR compared to AUROC.
5 DISCUSSION
We have proposed and validated the modeling of
PDFs in deep feature representations generated by
large-scale dataset training as a method for extending
supervised fabric anomaly detectors to previously un-
seen fabrics, achieving state-of-the-art performance.
During evaluation, it was observed that LOO perfor-
ICPRAM 2021 - 10th International Conference on Pattern Recognition Applications and Methods
468

mance on its own (i.e. applying the learned model
without modification to new fabrics) was already
comparable to prior state of the art. The reason
for this may be found in the clustering behavior of
anomalies observed in the latent space visualizations,
where anomalies form a cluster of their own (cf. Fig-
ure 3). Notably, this clustering is learned without
any additional loss enforcing it. The poor and ex-
tremely varying performance of the supervised ref-
erence method, a single fabric classifier, can be ex-
plained by the small dataset sizes available for the
individual fabrics, causing model overfitting. While
positive results are achieved for supervised classifiers
in literature, used datasets contain between 1 and 2
order of magnitudes more fabric anomalies than the
single fabric datasets used here (Gao et al., 2019).
Overall, our approach is a simple yet elegant alter-
native to the defect synthesis based approaches pro-
posed in previous work (Le et al., 2020; Han and Yu,
2020; Rippel et al., 2020b) and requires no training of
GANs, which suffer from instable training. Further-
more, compared to above approaches, no additional
model fine-tuning/training is required.
However, our work also has limitations. While
superior performance was achieved by multimodal
modeling of PDFs via GMMs, this approach is very
sensitive to anomalies and thus cannot be applied in
an unsupervised manner. Instead, it requires a clean,
anomaly-free dataset, i.e. a semi-supervised setting.
While such a dataset can be easily generated in prac-
tice, it would still be interesting to assess performance
of more complex, non-parametric PDF estimation al-
gorithms (e.g. (Trentin, 2018)) in the unsupervised
setting. We hypothesize the reason for the afore-
mentioned sensitivity to unlabeled anomalies lies in
the clustering behavior of anomalies observed in la-
tent embeddings (cf. Figure 3). GMM components
will be fit by the EM algorithm to these clusters, and
anomalies thus assigned a higher likelihood under our
model. As the unimodal Gaussian is more rigid in
it’s assumptions about normal data distribution, it is
less strongly affected by the anomaly clustering, but
also yields less performance due to it’s inability to re-
flect the multimodal nature of fabric appearance. If
anomalies were to follow a diffuse PDF instead, as is
a longstanding assumption in AD (Ruff et al., 2020a),
we expect the GMM approach to be more resistant in
the unsupervised regime. Apart from our work, said
assumption has also been recently challenged by Ruff
et al. (Ruff et al., 2020b).
Furthermore, high AUPR values could not be
achieved for all fabrics. We give two possible expla-
nations for this: First, undetected anomalies may be
present in the datasets, which have been shown to be
detrimental to model performance. We will therefore
extensively relabel our dataset to eliminate all label
noise. An alternative explanation would be that the
learned feature representations fail to properly rep-
resent some normal data modes for fabrics that are
significantly different from the initial dataset, which
is supported by low AUPR values co-occurring with
high AUROC values (cf. fabric 6 in Figure 4). This
is congruent with observations made by Liu et al.
(Liu et al., 2019), where their anomaly segmentation
model is capable of defect segmentation in new fab-
rics but yields too many False Positives prior to fine-
tuning. Reduction of False Positive Rate could be
achieved by including normal data of new fabrics for
a model retraining or alternatively fine-tuning, pos-
sibly improving results without requiring anomalies.
Note that this would increase the complexity of the
approach. When viewing the difference in appearance
of new fabrics as input domain shifts, performance
on new fabrics may be further increased by apply-
ing methods targeted at increasing model robustness
to input domain shifts (e.g. AugMix as proposed by
Hendrycks et al. (Hendrycks et al., 2020)).
6 CONCLUSION
In this work, we proposed the modeling of PDFs
in deep representations as a useful transfer learn-
ing approach to extend deep fabric AD models to
new, previously unseen fabrics. The approach is sim-
ple yet elegant and requires only a small dataset of
normal images for PDF estimation. Our compari-
son against semi-supervised and supervised methods
demonstrates the efficiency of our approach. We will
further extend our approach by incorporating meth-
ods that increase robustness to input domain shifts in
the initial model training phase. Additionally, we will
investigate methods to fine-tuning learned feature rep-
resentations directly using normal data only to further
reduce False Positive Rate.
ACKNOWLEDGEMENTS
This work was supported by the German Federation
of Industrial Research Associations (AiF) under the
grant number 19811 N.
REFERENCES
Andrews, J., Tanay, T., Morton, E. J., and Griffin, L. D.
(2016). Transfer representation-learning for anomaly
Estimating the Probability Density Function of New Fabrics for Fabric Anomaly Detection
469

detection. JMLR, Multidisciplinary Digital Publish-
ing Institute.
Bishop, C. (2006). Pattern Recognition and Machine
Learning. Springer.
Chandola, V., Banerjee, A., and Kumar, V. (2009).
Anomaly detection: A survey. ACM computing sur-
veys (CSUR), 41(3):1–58.
Gao, C., Zhou, J., Wong, W. K., and Gao, T. (2019). Woven
fabric defect detection based on convolutional neural
network for binary classification. In Wong, W. K.,
editor, Artificial Intelligence on Fashion and Textiles,
pages 307–313, Cham. Springer International Pub-
lishing.
Han, Y.-J. and Yu, H.-J. (2020). Fabric defect detection
system using stacked convolutional denoising auto-
encoders trained with synthetic defect data. Applied
Sciences, 10(7).
He, K., Zhang, X., Ren, S., and Sun, J. (2016). Deep resid-
ual learning for image recognition. In Proceedings of
the IEEE conference on computer vision and pattern
recognition, pages 770–778.
Hendrycks, D., Mu, N., Cubuk, E. D., Zoph, B., Gilmer, J.,
and Lakshminarayanan, B. (2020). AugMix: A sim-
ple data processing method to improve robustness and
uncertainty. Proceedings of the International Confer-
ence on Learning Representations (ICLR).
Hu, G., Huang, J., Wang, Q., Li, J., Xu, Z., and Huang, X.
(2019). Unsupervised fabric defect detection based on
a deep convolutional generative adversarial network.
Textile Research Journal, 0(0):0040517519862880.
Karayiannis, Y. A., Stojanovic, R., Mitropoulos, P., Koula-
mas, C., Stouraitis, T., Koubias, S., and Papadopou-
los, G. (1999). Defect detection and classification on
web textile fabric using multiresolution decomposi-
tion and neural networks. In ICECS’99. Proceedings
of ICECS ’99. 6th IEEE International Conference on
Electronics, Circuits and Systems (Cat. No.99EX357),
volume 2, pages 765–768 vol.2.
Kingma, D. P. and Ba, J. (2015). Adam: A method for
stochastic optimization. In Bengio, Y. and LeCun,
Y., editors, 3rd International Conference on Learn-
ing Representations, ICLR 2015, San Diego, CA, USA,
May 7-9, 2015, Conference Track Proceedings.
Le, X., Mei, J., Zhang, H., Zhou, B., and Xi, J. (2020). A
learning-based approach for surface defect detection
using small image datasets. Neurocomputing.
Ledoit, O., Wolf, M., et al. (2004). A well-conditioned
estimator for large-dimensional covariance matrices.
Journal of Multivariate Analysis, 88(2):365–411.
Lee, K., Lee, K., Lee, H., and Shin, J. (2018). A simple uni-
fied framework for detecting out-of-distribution sam-
ples and adversarial attacks. In Advances in Neural
Information Processing Systems, pages 7167–7177.
Liu, J., Wang, C., Su, H., Du, B., and Tao, D. (2019). Mul-
tistage gan for fabric defect detection. IEEE Transac-
tions on Image Processing.
Mahalanobis, P. C. (1936). On the generalized distance in
statistics. National Institute of Science of India.
Mei, S., Wang, Y., and Wen, G. (2018). Automatic fabric
defect detection with a multi-scale convolutional de-
noising autoencoder network model. Sensors, 18(4).
Miyato, T., Kataoka, T., Koyama, M., and Yoshida, Y.
(2018). Spectral normalization for generative ad-
versarial networks. In International Conference on
Learning Representations.
Newman, T. S. and Jain, A. K. (1995). A survey of auto-
mated visual inspection. Computer vision and image
understanding, 61(2):231–262.
Rippel, O., Mertens, P., and Merhof, D. (2020a). Mod-
eling the distribution of normal data in pre-trained
deep features for anomaly detection. arXiv preprint
arXiv:2005.14140.
Rippel, O., M
¨
uller, M., and Merhof, D. (2020b). GAN-
based defect synthesis for anomaly detection in fab-
rics. In 2020 IEEE 25th International Conference
on Emerging Technologies and Factory Automation
(ETFA). IEEE.
Ruff, L., Kauffmann, J. R., Vandermeulen, R. A., Mon-
tavon, G., Samek, W., Kloft, M., Dietterich, T. G.,
and M
¨
uller, K.-R. (2020a). A unifying review of
deep and shallow anomaly detection. arXiv preprint
arXiv:2009.11732.
Ruff, L., Vandermeulen, R. A., Franks, B. J., M
¨
uller,
K.-R., and Kloft, M. (2020b). Rethinking assump-
tions in deep anomaly detection. arXiv preprint
arXiv:2006.00339.
Schwarz, G. et al. (1978). Estimating the dimension of a
model. The annals of statistics, 6(2):461–464.
See, J. E. (2012). Visual inspection: a review of the lit-
erature. Sandia Report SAND2012-8590, Sandia Na-
tional Laboratories, Albuquerque, New Mexico.
Shi, W., Caballero, J., Theis, L., Huszar, F., Aitken, A.,
Ledig, C., and Wang, Z. (2016). Is the deconvolu-
tion layer the same as a convolutional layer? arXiv
preprint arXiv:1609.07009.
Trentin, E. (2018). Soft-constrained neural networks for
nonparametric density estimation. Neural Processing
Letters, 48(2):915–932.
Ulyanov, D., Vedaldi, A., and Lempitsky, V. S. (2016). In-
stance normalization: The missing ingredient for fast
stylization. CoRR, abs/1607.08022.
Weninger, L., Kopaczka, M., and Merhof, D. (2018). De-
fect detection in plain weave fabrics by yarn tracking
and fully convolutional networks. In IEEE Interna-
tional Instrumentation and Measurement Technology
Conference (I2MTC).
Wu, Y., Zhang, X., and Fang, F. (2020). Automatic fabric
defect detection using cascaded mixed feature pyra-
mid with guided localization. Sensors, 20(3).
Zhang, H., Zhang, L., Li, P., and Gu, D. (2018). Yarn-
dyed fabric defect detection with yolov2 based on
deep convolution neural networks. In 2018 IEEE 7th
Data Driven Control and Learning Systems Confer-
ence (DDCLS), pages 170–174.
ICPRAM 2021 - 10th International Conference on Pattern Recognition Applications and Methods
470
