
Life Cycle of Software Development Design in European Structured
Economic Reports
Ignacio Santos
1a
, Elena Castro
2b
, Dolores Cuadra
2c
and Harith Aljumaily
1d
1
Carlos III University of Madrid, Computer Science Department, Madrid, Spain
2
King Juan Carlos University, Technical School of Computer Engineering, Madrid, Spain
Keywords: Model Driven Architecture (MDA), Multidimensional Data Model (MDM), Data Point Model (DPM),
eXtensible Business Reporting Language (XBRL), Semantic Financial Reports, Concept and Logic Data
Model.
Abstract: This proposal presents the complete life cycle of software development for semantic economic reports using
the MDA paradigm. A panoramic view of the development of these reports using the MDM and the DPM in
Europe is shown. Stock market, financial institutions and others are using these reports. Companies,
organizations and agencies need to exchange accounting reports. A very high percentage of reports are
published and transmitted through the internet. These reports are structured and semantic. In general, the
XBRL specification, based on XML, is used as a de facto standard. This research work examines the evolution
of this design and analyses the Conceptual Model in detail. Regulators through different Central Banks and
European Agencies have established a modelling tool in the context of the European Union (EU), the DPM,
which is a European standard. Moreover, a minimum set of consistent definitions and rules based on the MDM
using the MDA will be proposed. This paper will analyse the DPM methodology. Finally, it is hoped that this
study will help to make the design of reports easier.
1 INTRODUCTION
The world’s main economic/financial institutions and
agencies, as well as many companies and state or
local agencies, actively use semantic reports using the
XBRL specification. In the USA, Canada, Europe,
China, etc. all financial entities and companies quoted
on the stock market have to report compulsorily to the
supervisory and regulatory authority using the XBRL
specification. Financial statements are regulated by
strict requirements, such as the International
Financial Reporting Standard (IFRS, 2020) or
Generally Accepted Accounting Principles (GAAP).
XBRL is actively used by the Board of Governors of
the Federal Reserve System (FED), the Securities and
Exchange Commission (SEC), the ShenZhen Stock
Exchange (SZSE), the Shanghai Stock Exchange
(SSE) (JiMei et al., 2012; Jimei et al., 2013), the
European Central Bank (ECB), the European
a
https://orcid.org/0000-0002-3374-4271
b
https://orcid.org/0000-0002-0652-8848
c
https://orcid.org/0000-0002-0652-8848
d
https://orcid.org/0000-0001-5084-2626
Banking Authority (EBA), the European Insurance
and Occupational Pensions Authority (EIOPA), the
Deutsche Börse, the Deutsche Bundesbank,
Companies House and HM Revenue & Customs
(UK) and the Australian Prudential Regulation
Authority (APRA), among many other institutions
and agencies. Recently, in the EU, the European
Securities and Markets Authority (ESMA, 2020)
began using structured reports.
The authors of this paper show the application of
the Model Driven Architecture (MDA) that belongs
to Object Management Group (OMG, 2020) and
analyse the software development life cycle of this
type of document, (Santos et al. 2016). OMG is a
common portable and interoperable object model
with methods and data that works using all types of
development environments on all types of platforms.
To do this it is very important to understand the
design of semantic reports in relation to the real world
Santos, I., Castro, E., Cuadra, D. and Aljumaily, H.
Life Cycle of Software Development Design in European Structured Economic Reports.
DOI: 10.5220/0009954001590169
In Proceedings of the 16th International Conference on Web Information Systems and Technologies (WEBIST 2020), pages 159-169
ISBN: 978-989-758-478-7
Copyright
c
2020 by SCITEPRESS – Science and Technology Publications, Lda. All rights reserved
159

and away from its physical implementation, because
this will help with understanding the difficulties
presented. When a financial institution, company, etc.
fills out a report, before sending this to another entity,
agency, etc., it has to be validated (at origin), to
ensure that it is syntactically correct (Debreceny et
al., 2010).
This paper shows a metadata design for semantic
economic reports. Moreover, the approach of
European Regulators to the Data Point Model (DPM)
is studied. The MDA provides a good framework for
the automatic generation of code for application
development (MDA, 2020). The MDA focuses on
using models as approaches to cover the life cycle of
software development. Heterogeneity and
interoperability problems between systems with
different implementation platforms are resolved by
using this approach. The MDA stratifies the design
into three phases or levels to allow for easier
development. The levels of the MDA are:
Computation Independent Model (CIM). The
business or domain model. In this level, the real
world is analysed, including concepts, data and
rules.
Platform Independent Model (PIM). This
focuses on high-level business logic without
considering the features of the implementation
technology of the system. In this level, the real
world is mapped to a conceptual model, using
a star model of the MDM.
Platform Specific Model (PSM). This
represents the detail of using a specific
platform for a system. In this level, the DPM is
used, because at the end, the implementation is
in an XML-based format (XBRL, iXBRL (an
HTTP of an XBRL).
The MDM is a model for databases (Kimball,
1996-2004; Inmon, 2005; Jarke et al., 2003).
Dimensional modelling defines the concepts of facts
(measures), and dimensions (contexts), and the
authors and the European regulators believe that it is
a concept model perfectly adapted to this modelling
in Europe (Boixo and Flores, 2005; Felden, 2007;
Santos, 2013; Santos and Castro, 2010, 2011, 2011a,
2011b; Santos et al., 2013). The DPM was originally
proposed and led by the Bank of Spain. This model
started using the taxonomies of Balance Sheet Items
and Interest Rates Monetary Financial Institutions
(BSI-MIR 2010) and they were implemented by the
Polish financial software company, BR-AG (2020).
After, with this model was developed COREP (it
focuses on the consolidated, sub-consolidated and
solo reporting of capital requirements and capital and
reserves based on EU directives) and FINREP
(consolidated and sub-consolidated financial
reporting for supervisory purposes based on IAS
(International Accounting Standards)/IFRS)
taxonomies (Eurofiling 2020). The DPM was
developed using two taxonomies for respectively
Cayman Islands Monetary Authority and Bermuda
Monetary Authority.
The next section studies the use and necessity of
this type of report, and its historical evolution.
Section 3 is divided into five subsections. In 3.1 the
CIM is analysed. In the next subsection, 3.2, the rules
and definitions in the PIM are shown. The metadata
design in the PIM and its validation is shown in
section 3.3. The PSM is presented in subsection 3.4.
In 3.5 a complete example is displayed. Finally,
section 4 presents the conclusion of this research and
explores future works.
2 BACKGROUND
In a company, organization or agency, there is always
an exchange of accounting reports. Since the late
1990s, this exchange of reports has started to
increase. Companies needed to know the status of
their orders as soon as possible, and to perform a
calculation of presales, sales and future product
availability (Lee et al., 1997). If these reports are not
semantic, they cannot be directly automated in the
internal or external processes of the company through
Information Systems (IS) (Wagenhofer, 2003;
Williams et al., 2006).
Following the bankruptcy of Enron Corporation
in December 2001, stock market regulators began to
demand the reporting of much more business
information and reduce the amount of time in which
this reporting had to be processed. In April 1998 the
automation of the exchange of financial information
through XBRL was proposed (Hamscher and
Kannon, 2000). XBRL is an XML-based standard for
semantic financial reporting (Engel et al., 2008). The
financial statements of credit institutions, for
example, are specific statements defined by one or
more taxonomies, including their structures and
semantics. As accounting directives are subject to
continuous modification, versioning and changes of
location (e.g. of a country, state or region), problems
often arise. There are three important groups of
semantic reports in Europe: COREP (Common
Reporting Framework), FINREP (Financial Reports),
both of the EBA, and Solvency II of the EIOPA. In
the U.S.A. and Canada one of the main taxonomies is
the US-Generally Accepted Accounting Principles
(US-GAAP). Another specification for semantic
WEBIST 2020 - 16th International Conference on Web Information Systems and Technologies
160
reports is the Statistical Data and Metadata Exchange
(SDMX, 2020). This is often used by the ECB and the
Bank for International Settlements (BIS), among
other agencies and institutions.
In 2008, the European regulator had the necessity
of developing reports for each country or jurisdiction.
In the first meetings, each national regulator
presented a set of spreadsheets with a heap of cells
that gathered data from the supervised entities.
Moreover, a unification of criteria was necessary.
Where originally they were just a small set of
countries, presently there are almost 30. The main
problem was that these data (Data Points) didn’t
match with each other. Firstly, IS analysts and expert
users looked for data points with the same
dimensions. Many cells coincided with the
dimensions of the time period, the currency and/or the
entity. Then IS and expert users obtained more
dimensions, such as liabilities, assets, etc. From these
meetings the related data points were gathered, using
dimensions. The question remains, when these
dimensions are not commons, whether each expert
user can use different dimensions for defining the
same data point or measure.
3 DESCRIPTION OF THE
DESIGN AND PROPOSAL
In this section the metadata model drivel engineering
approach in accounting semantic reports will be
analysed using the authors’ approach (Ñustes et al.,
2016). The first step is to define an economic
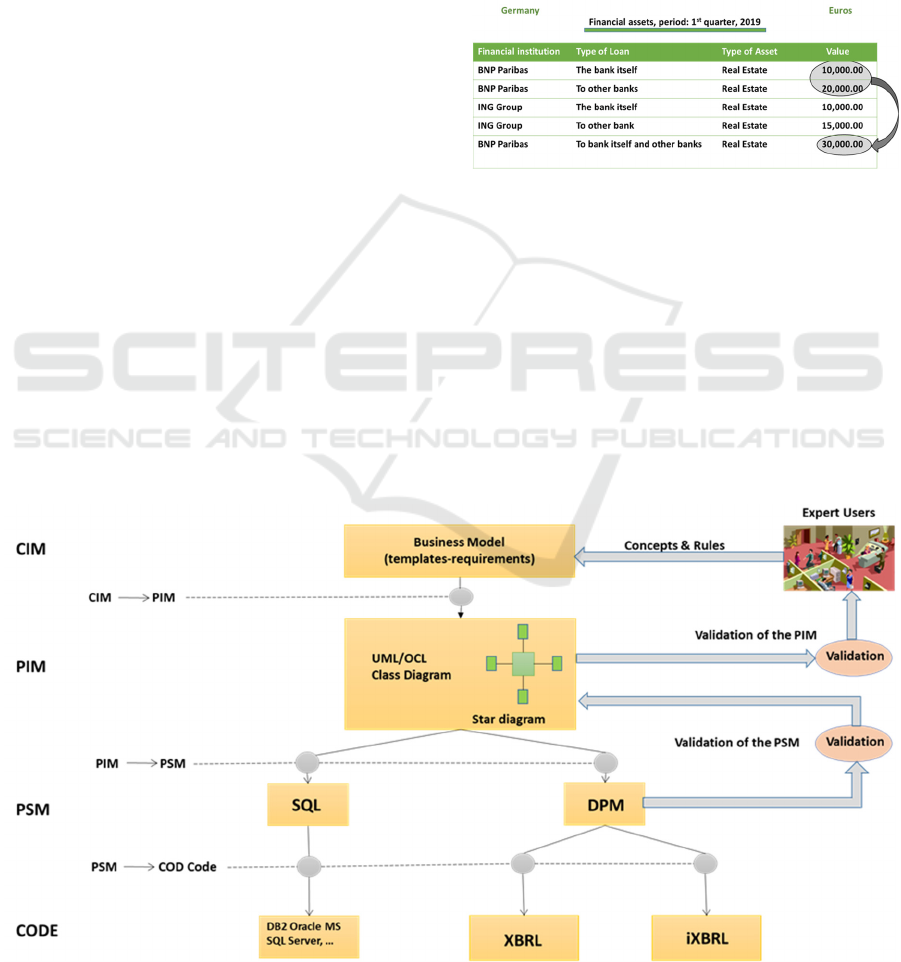
semantic report (Figure 1). However, this approach is
different of the Semantic Web, is a definition
economic. This figure 1 just it is only an example, it
is not a real example. Nevertheless, we use real
names, because so the example could be more
pedagogic. In this example, the Financial Assets in a
period in a country is shown. With specific rules, such
as that the real estate loans of the bank must be equal
to the sum of the real estate loans to the bank itself
and other banks (Santos, I., 2016).
Figure 1: Example of financial sematic report.
Firstly, the following definition of an economic
semantic report is proposed: An economic/financial
report is semantic if it is composed of a set of
interconnected concepts, and values are assigned to
these concepts or groups of concepts. Also, the values
must comply with certain rules and/or constraints
among other values and concepts.
Figure 2 diplays the design of sematic reports
using the MA paradigm. The regulators, agencies, etc.
need to gather a series of data. These expert users,
with the help of IS, build a set of templates, through
Figure 2: Design of sematic reports using the MDA paradigm.
Life Cycle of Software Development Design in European Structured Economic Reports
161

one or more spreadsheets. Therefore, the real world
consists of a set of accounting rules, laws, directives,
etc., defined by a set of required data in a report (the
CIM), through templates. According to the MDA
paradigm, the PIM is obtained from the CIM. In the
PIM, the set of definitions and user rules are analysed.
A mapping from the CIM to the PIM is shown. The
model used in the MDM is the star model that is used
by European regulators. The PSM (in this case the
DPM) consists of a set of definitions, rules and
transformations.
In Europe the design makes extensive use of
dimensions (Boixo and Flores, 2005; Felden, 2007).
This use of dimensions makes the design process
easier, since if the number of dimensions in the
conceptual model is high, it is semantically richer,
and the mapping to a database is easier.
This section has been divided into five
subsections in order to explain the definition of the
CIM, the analysis of the PIM, its rules and definitions,
the design of the metadata in the PIM, the PSM and a
complete example.
3.1 The Computation Independent
Model (CIM)
An economist-accountant wants only to obtain a set
of data (Santos, 2016). In certain cases, these
specialists design a report as in Figure 1. However, in
most cases, they want to collect data independently of
its presentation. A generalized method is to generate
one or more spreadsheets or templates with the data
that are needed. In this way, the presentation of the
data is separated from its definition. According to the
business logic, the user will create one or more
spreadsheets, each sheet having a group of cells.
Figure 3 shows a simplified example with three cells,
based on the report of Figure 1, where F(5.1.1) shows
row 1 in Figure 1, F(5,1,2) shows row 2 and F(5, 1, 3)
could be row 5.
From these templates or sheets, the IT analyst,
together with the business user, extracts the metadata.
In these templates, the business users show the data
they need to gather. The analyst may find a set of
Excel sheets with a large number of cells unconnected
with each other and with a high degree of redundancy.
Each template has a different meaning for the
business user. The template will consist of a set of
cells where each cell is a fact to be gathered, this
being determined by a set of dimensions and
dimension attributes, among other things. For
example, F5 (5, 1, 1) is real estate assets, with a loan
from the bank, for an entity, in euros. In this figure 3,
if the fields are crossed out, they are considered not
allowed by the business user. On the other hand, a fact
can be represented by more than one triplet (template,
row, column), because a fact can be in more than one
template. The proofs of concepts (hereinafter POCs)
of this paper are based on the reports that must be sent
from financial institutions to European regulators
(Openfiling, 2020). These POCs use the draft of the
FINREP 2012 taxonomy (EBA, 2011; Eurofiling,
2012; Eurofiling, 2020), published on the internet,
with extensive use of dimensions.
3.2 The Platform Independent Model
(PIM): Rules and Definitions
This subsection analyses the PIM of this model. UML
is used to show all necessary definitions and rules of
this platform (the PIM). The star model of the MDM
is used in this level. Table 1 summarises the set of
definitions. Column 1 defines the name of the concept
in the MDM and column 2 its description. However,
these definitions are based on the XBRL Data Model
(XBRLDM).
Figure 3: Star model in the PIM.
The first definition, according to Table 1, is the
definition of a business concept or item. In the Figure
1, the concepts are {‘Entity_Financial’, ‘BNP
Paribas’, ‘ING Group’, ‘Royal Bank of Scotland’,
Commerzbank, ‘Real estate’, ‘No real estate’, ‘Real
estate and no real estate’, Assets, Liabilities, …}. A
basic concept is a primary item, in the XBRLDM
(Hernández-Ros and Wallis, 2006; Santos and Castro,
2011a, b). All concepts of a domain have the same
type of time period. A domain is formed of a set of
concepts, and each concept belongs to a single
domain. In this example the basic concepts are Type
of Asset: Real Estate, No Real Estate and ‘Real estate
and no real estate’. As will be seen later, ‘Real estate
and no real estate’ is a hierarchy within a dimension,
and is specific to this type of report. They have type
monetary, their period is instant and they can be
positive or negative (balance). All concepts of a
WEBIST 2020 - 16th International Conference on Web Information Systems and Technologies
162

domain have the same type of time period. In the
example the set of domains are DEntity,
DAssets_Estate, DLoans, and DGeography. The
domain DEntity consists of the next concepts
{‘Entity_Financial’, ‘BNP Paribas’, ‘ING Group’,
‘Royal Bank of Scotland’, Commerzbank} and so on.
Table 1: Definitions and rules in the MDM (the PIM).
Name in the
MDM
Description
Concept
The definition of a business concept or
item. Each concept is associated with a
time period type attribute (Instant,
P
eriod, and
F
oreve
r
).
Basic Concept
A special concept that has an associated
data type, time period type, and balance
type (if it is monetary).
Domain
A group of concepts belonging to a field
or scope of knowledge or activity. In
this model a domain can contain basic
concepts or non-basic concepts but not
b
oth.
Base
Dimension
A domain with only basic concepts.
Dimension
A set of concepts of a domain. These
concepts have a tree-like structure.
Dimension
(explicit /
implicit)
This is explicit if the attributes are
defined. It is implicit if they are not
defined. Dimension → Domain.
Domain → → Dimension.
Dimension
Group
Group of dimensions of a domain.
Calculated
attribute
An aggregate of dimension attributes of
a dimension, and/or calculated
attributes.
Attribute of
dimensions
Not an aggregate.
Attribute by
default
Each domain has a concept by default.
Hierarchical
Constraint
Concepts in a dimension have a tree-
like structure. Validation is between a
leaf and its leaves below, that is to say,
it is used for the calculated attributes.
References
References to directives or laws of the
concepts.
Fact::=<Dimen
sion/Dimensio
n attribute>-
Basic concept-
Calculated
attribute
A fact is a value representing a
particular measurement provided by the
reporting entity.
Allowed fact User constraint.
Forbidden fact User constraint.
In the MDM or the XBRL specification one cannot
have more than one dimension attribute of a
dimension that refers to a fact. However, in the real
world there can be more than one concept for a
domain that makes references to a fact. The solution
in the XBRLDM is to create as many dimensions of
the same domain as is possible, so that each fact has
a dimension attribute (member-domain in
XBRLDM), without overlapping dimension
attributes of a dimension in a fact. Dimensions of a
domain with overlapped are created in the MDM.
This means, a dimension determines a domain. Then,
in the example it is possible to define the domain
DLoans, the dimension Loans_1={’The bank
itself’+‘To other banks’}, etc. A calculated attribute
determines a domain and a dimension. For example,
in the domain DLoans the concept ‘The bank itself
and other banks’ is a calculated attribute of Loans_1,
where ‘The bank itself and other banks’=’The bank
itself’+‘To other banks’. A dimension attribute
determines a single concept from a domain, but
dimension attributes determine from 1 to n
dimensions. In XBRLDM a dimension consists of
domain-member, and does not differentiate between
dimension attributes and calculated attributes. On the
other hand, in the XBRLDM, all defined domains
must have a concept by default with semantic content
(Hernández-Ros and Wallis, 2006; Eurofiling, 2011).
Also in this data model, every dimension should have
a concept by default of the domain to which the
dimension belongs.
In the XBRLDM a domain consists of dimensions
and these dimensions consist of domain-members. In
the MDM a domain consists of dimension attributes
and the calculated attributes or measures of
dimensions belong to a domain. These concepts are
hierarchical (Hernández-Ros and Wallis, 2006;
Schmehl, 2009). In this data model, the hierarchies
can be used for different validations of the concepts,
and with a business perspective for IS. This means,
that in the MDM the concepts (dimension attributes
and measures) of a dimension are organized into an
interconnected hierarchy tree. In the example the
concept ‘Real estate and no real estate’ of the domain
DAssets_Estate is a root of the concepts ‘Real estate’
and ‘No real estate’. Each concept can have an
associated a comparison operation (the root) and an
operation, “+” or “-“(the leaves). Unlike the
XBRLDM, the MDM uses calculated attributes to
obtain a fact, but the XBRLDM does not calculate the
facts, only their validations. Therefore, to obtain a
mapping between the two models, a fact must carry
out a certain validation rule defined with respect to a
calculated attribute. The validations from the
XBRLDM hierarchies are used to take advantage of
the Linkbase calculation (operation in the XBRL
specification with only one dimension) (Engel et al.,
Life Cycle of Software Development Design in European Structured Economic Reports
163
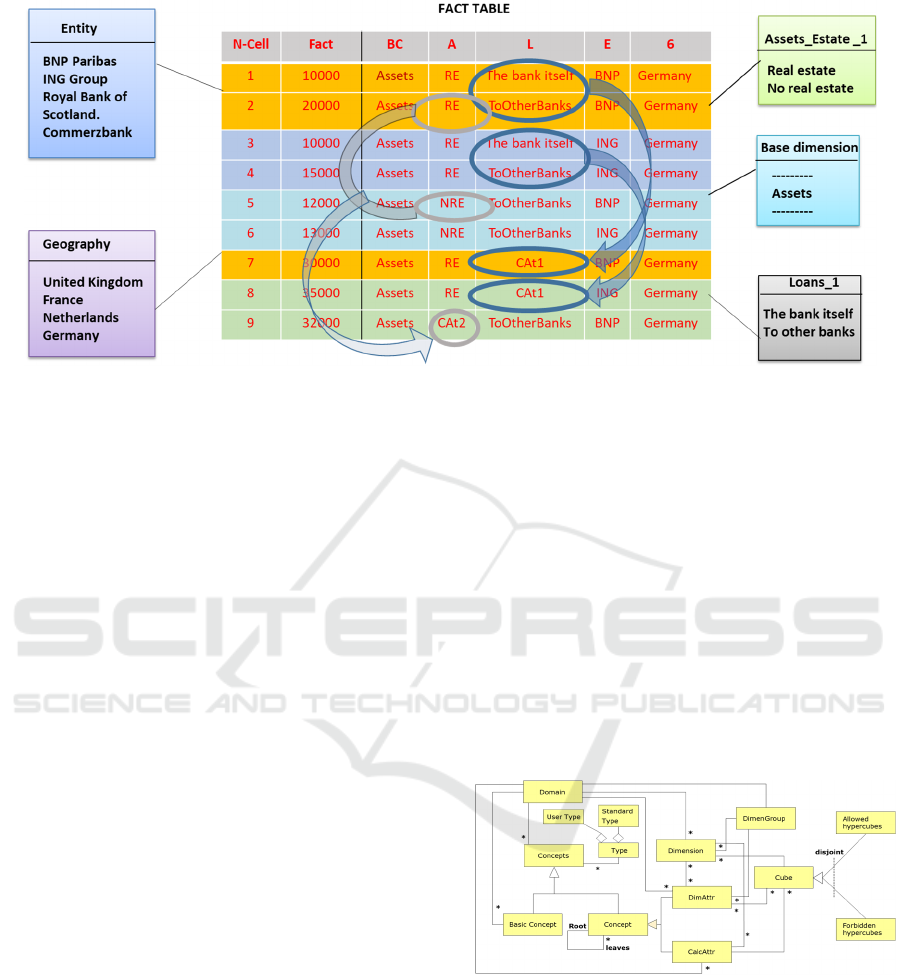
Figure 4: Example of fact table with calculated attributes, from Figure 1.
2008; Santos and Castro, 2011, b). However, the
Eurofiling group in its guide of best practices
recommends the use of the XBRL formula Linkbase
(Morilla, 2008; XBRL International, 2009; Fischer,
2011).
The XBRLDM Dimension Taxonomy (XDT)
defines two types of dimensions (Hernández-Ros and
Wallis, 2006; Schmehl, 2009). The dimensions can be
explicit or implicit. Explicit dimension attributes of a
dimension are defined in an explicit way in the
metadata model. Dimension attributes are implicit
(according to XBRLDM) when they are not explicitly
defined in the metadata model, however they belong
to a particular domain. In the MDM an implicit
dimension’s dimension attributes will be defined at
run-time. Each concept is associated with 0 or an
unknown number of references. The references are
indications of legal texts (Engel et al., 2008; Santos
and Castro, 2011, b). In the XBRL specification,
tuples or arrays of data are allowed. However, the best
practices guide developed by the Eurofiling group
does not recommend them (CEN, 2013; Eurofiling,
2020; Santos et al., 2016). In the MDM an array is
considered as another dimension.
In the XBRLDM, a fact is defined as a set of pairs
(dimension / domain-member) and a basic concept
(primary item). In the MDM a table of facts consists
of a set of facts, and these facts are determined by a
set of pairs <dimension/dimension attributes>,
including the base domain as an additional
dimension, and with or without calculated attributes.
For example, if in Figure 1 “BNP Paribas - The bank
itself - Real Estate - 10,000.00” is chosen, this is
equivalent to F(5,1,1) in Figure 3. Then, the fact F(5,
1,1) is the union of <Entity, “BNP Paribas”>,
<Assets_Estate_1,”Real estate”>, <Loans_1, “The
bank itself”>, <Geography, Germany> and <Base
dimension, Assets>. The hypercubes in the XBRLDM
are constraints on facts in the XDT (XBRL
Dimensional Taxonomies), which indicate the valid
combinations of pairs <dimension, attributes of
dimension>. A hypercube in MDM is a set of pairs
<dimension, attributes of dimension> and calculated
attributes defining one or more facts.
An allowed hypercube is defined as a hypercube
associated with a basic concept that determines a fact.
A forbidden hypercube is defined as a hypercube
associated with a basic concept that cannot determine
any fact, because the expert user considers this fact to
be impossible or erroneous. Figure 4 shows the MDM
of this example.
Figure 5: UML summary of the artefacts of the data model
in the PIM.
As it is explained in Figure 4, in this model there are
two calculated attributes. CAt1=(‘To bank itself’+
‘To other banks’), dimension Loans_1, CAt2=(‘Real
Estate’ + ’No Real Estate’), dimension Assets
Estate_1 . Finally, it is possible to analyse that Fact 7
is correct, and 8 is wrong. Moreover, it is possible to
see an allowed hypercube as Fact 7 that is defined as
{(BD, Assets), (Assets Estate_1, Real Estate), CAt1,
(Entity, BNP), (Geography, Germany)}.
WEBIST 2020 - 16th International Conference on Web Information Systems and Technologies
164

So far the structure, definitions and user
constraints of the PIM have been shown. In the next
subsection, it is necessary to validate some
constraints of the design in this platform.
3.3 Design of Metadata in the PIM
In this section, it is ensured that the transformation of
the CIM to PIM is correctly performed. In this phase
the result of this transformation is validated, i.e., if the
resulting PIM (or UML star model) is correct.
According to Gogolla et al. (2007), the validation of
conceptual models at early phases of their development
can help correct faults in the design at a point where
they may still be corrected with relative ease.
The validation involves testing that the data
obtained in the development of this research work
match up with expert users’ requirements. In this
validation FINREP (Eurofiling 2012) and Solvency II
is used. The number of concepts to gather is so large
(there were only 4500 in FINREP in 2012 and 45000
in 2015 (Weller, 2015)), with COREP presently 95742
(EBA, 2018) that it makes it impossible to work
directly with the report of Figure 1. In the initial
development (in the CIM) these templates have a large
number of unconnected cells and a high level of
redundancy. In the first phase, according to Algorithm
1, the different elements of the original templates
(Figure 3) are entered into the relational model of
Figure 5. By applying this algorithm repeatedly, the
unconnected and redundant cells are analysed.
Algorithm 1 uses the definitions and rules from
the above sections. It is this process that really makes
the structural validation (Santos and Nieto, 2014,
2015), verifying if hierarchies of concepts are valid in
a domain, with regard to dimensions, dimension
attributes and calculated attributes (if dimension
attributes belong to one domain rather than two at a
time, etc.).
Algorithm 1: Extraction of the metadata model.
start
read data type, domains, concepts,
basic concepts;
read dimensions, dimension groups;
verify the hierarchies of the
concepts and dimensions;
obtain dimension attributes,
calculated attributes;
obtain allowed cubes, forbidden
cubes;
obtain UML star model
create dimension tables from
dimensions and dimension attributes in
the star model;
create stored procedure with
calculated attributes;
create base dimension;
create facts from allowed cubes;
end
Next, the UML star model is obtained, as in
Figure 5. To achieve the transformation in the Proof
of Concept (POC), this paper uses SQL Server
Integration Services (SSIS), an ETL (Extract,
Transform and Load data) product of Microsoft
(Openfiling, 2020a). Table 2 shows, after which, it is
verified whether the output is as expected. This
process is based on the EBA and EIOPA taxonomies
(more than 20 modules), in that each concept is
analysed, for example, as to whether the hierarchy of
the concepts in a domain is correct.
Table 2 verifies a set of validation tests for the
proposal, only a summary, due to lack of space, more
information in Santos (2016) and Santos and Nieto
(2014, 2015). Column 1 shows the test number.
Column 2 shows the test to validate. This column
shows the test case, for example, test number 1: “3
repeated concepts” means that it is impossible to
repeat 3 concepts. Columns 3, 4 and 5 are inputs to
the test. These columns display the set of correct
objects and the set of incorrect objects to test. For
example, test number 1 shows 187 concepts + 3
repeated concepts. Finally, the last column gives
the test output. In test number 1, in the three samples
Table 2: Validation tests belonging to the UML star model.
n
Test to
validate
Input
FINREP
2014
Input
Solvency
II
Test
output
1
3
concepts
repeated
1632
concepts+3
concepts
repeate
d
145
concepts+
3 concepts
repeate
d
3
conce
pts
repeat,
2
2
domains
repeated
35
domains+2
repeated
domains
1
domain+2
repeated
domains
2
repeat.
Dom.
9
Creation
of
calcul.
attrib.
4 dimen., 18
calcul.
attributes+1
incorrect
dimension
attribute
2 dimen.,
2 calcul.
attributes+
1 incorrect
dimension
attribute
1
incorr.
dim.
attribu
te
10
The
concepts
of a dim.
has 1
onl
y
root
92 dimen.,
1632
concepts. 2
roots in a
dimension
2 dimen.,
4
concepts.
2 roots in a
dimen.
2 roots
in a
dim.
(FINREP 2014 and Solvency II) three repeated
concepts are inserted, respectively, so the test output
Life Cycle of Software Development Design in European Structured Economic Reports
165
is three errors with three repeated concepts,
respectively.
The validation in the POCs in the PIM performed
on each sample (FINREP 2014, Solvency II) depicts
all structural validations in a 95%.
This proposal produces well-built metadata for
semantic economic reports because it is a structural
validation. However, it is necessary to continue the
validation with expert users, in order to validate the
semantically-complete design. To achieve this, an
economic study of the concept domains, hierarchies,
etc. is necessary, and that is left for future work.
3.4 Design of Metadata in the PSM
This section analyses the transformation from PIM to
PSM, using UML/MDM as the PIM and the DPM
used in the financial supervision as the PSM.
The Data Point Metamodel is a way to help to
design the reports for financial regulators (Weber et
al., 2013). Table 3 shows the mapping between both
levels:
Table 3: Mapping between the MDM and DPM models.
MDM DPM Comments
Domain Domain
Dimension Dimension
Dimension
attribute
DomainMember
Dimension
attribute b
y
default
DefaultMember Assertion
Set of dimension
attributes
EnumerableDim
ension
Defined
values
Set of dimension
attributes
NonEnumerable
Dimension
Defined in
run time
Group of
dimensions
belonging to the
same domain.
Family of
dimensions
Assertion
Dimension
attribute with data
t
yp
e and time
Basic concept or
primary item
Base Dimension
Set of Primary
Item
s
Assertion
Calculated
attributes
Hierarchy
and/or
validation of
domain-membe
r
Assertion
Set of <dimension /
dimension
attributes>
Context
Metric or Fact Data Point
Schema Taxonom
y
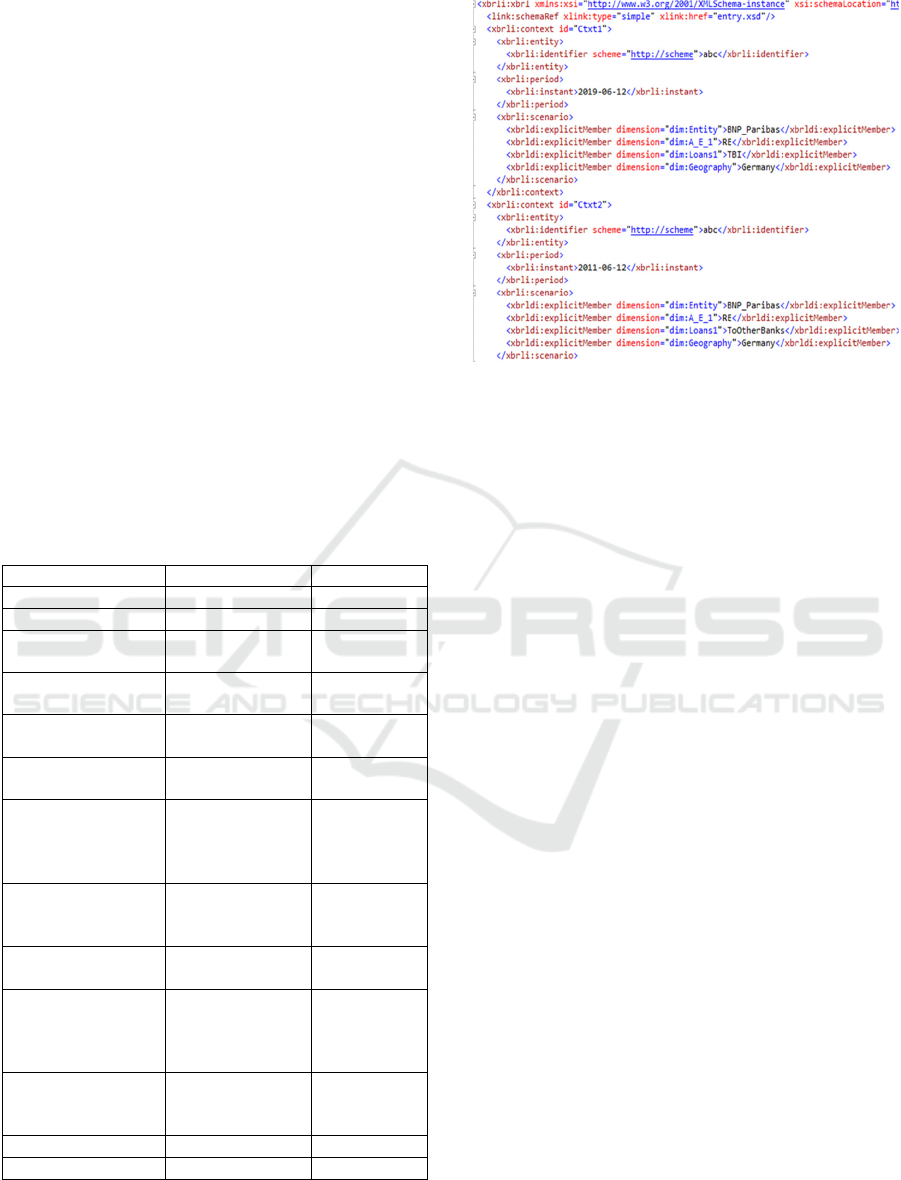
Figure 6: Context in XBRL, from Figures 1,3 and 4.
A Domain Member is an element that belongs to a
domain and it can be in 0..n dimensions. A dimension
attribute by default in a dimension is used when a
program does not select the dimension attribute of a
dimension. An example of
NonEnumerableDimension is Entity, that at one
instant in the time its values can be Bank A, Bank B
and Bank C but one year after, there are Bank A, Bank
C and Bank D. A Base Dimension in the DPM is the
set of Basic concepts or Primary Items (defined in the
XBRL specification). Hierarchy used in dimensions
is a set of relationships parent-child; in the MDM
these are calculated attributes. The Context is not
defined in the DPM, because it is more associated
with the presentation of the report. However, the
authors of this paper think that it is better to include it
here. The context is the set of dimension attributes
without a Base dimension that allow the existence of
a fact or measure.
A Metric or Fact is a is a real world measurement
and the Data Point is a cell in a table of a spreadsheet
that is measuring some aspect of economic data in the
report to gather it for the regulator. A Fact in the DPM
is associated with a Base Dimension. The Data Point
is associated with a period and a type of data. Then,
this is associated with a Primary Item or Basic
Concept (dimension attribute of the Base Domain). It
consists of the cell identifier or Data Point, the
decimal precision, the identifier of the context, the
unitRef, and the value of the Data Point (the fact or
thing measured). A Schema is a description of the
model.
From here a taxonomy is built, but this topic will
be analysed in future work due to lack of space in this
paper.
WEBIST 2020 - 16th International Conference on Web Information Systems and Technologies
166
3.5 Example
This section shows the example of Figure 1 to present
this methodology in an easily understandable way.
From the PIM (Figure 3) Table 1 is filled out as can be
seen in Figure 4, although this is only a summary. In
the PIM, the constraints, allowed facts with its contexts
are defined. Table 3 has to be resolved. In Table 4 only
a small set of contexts from Figure 3 are shown.
Table 4: Contexts of figures 1, 3 and 4.
Ctx Descri
p
tion
Ctxt1
<Entity/ BNP Paribas>+
<Assets_Estate _1(A_E_1)/Real estate(RE)>
+<
Loans_1(Loans1) /The bank itself (TBI)>
+<
Geo
g
ra
p
h
y
/
German
y
>
Ctxt2
<Entity/ BNP Paribas>+
<Assets_Estate _1(A_E_1)/Real estate(RE)>
+<
Loans_1(Loans1)/To other banks
(Tootherbanks)>+<
Geography
/
Germany>
Ctxt3
<Entity/ ING Group>+
<Assets_Estate _1(A_E_1)/ Real estate(RE)>
+<
Loans_1(Loans1) /The bank itself (TBI)>
+<
Geography
/
Germany>
… …
The Base dimension = {Assets (Monetary (credit),
Instant),…} In this example, the basic concept is
Assets, the data type is monetary and positive (credit),
and its value at an instant in time is defined. Until here
the metadata (data set required) of the reports are
defined. If the report is defined, the facts or values are
gathered and next the Instance Document is obtained,
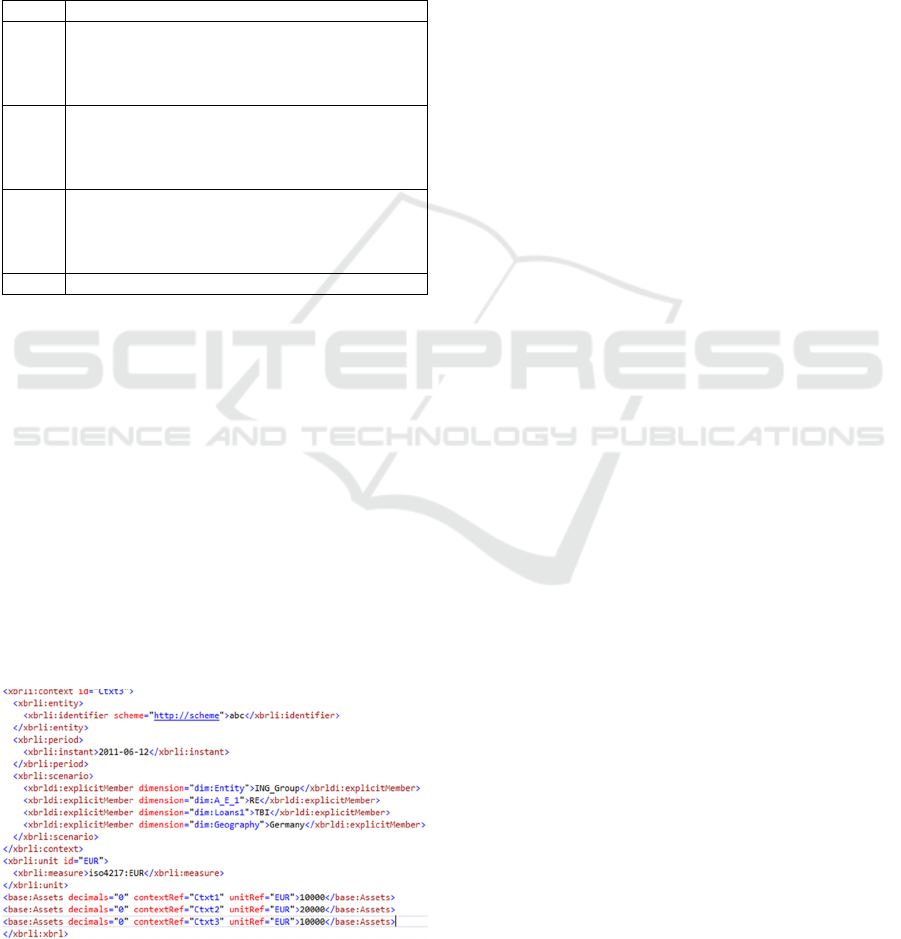
Figures 6 and 7.
Figures 6 and 7 show an XBRL Instance
Document, that is to say, the economic report that, for
example, a financial entity sends to a regulator. In
Figure 5 the contexts or allowed hypercubes used in
this report are defined. The Figure 6, at the end, the
facts or Data Points are presented. These three facts
are equivalent to the first three lines of the report in
Figure 1.
Figure 7: Data Points or Facts.in XBRL, from Figures 1,3
and 4.
4 CONCLUSIONS
This paper analyses and shows a panoramic view of
the development stages of the creation of economic
report metadata using the XBRL specification. In this
paper the MDA paradigm is proposed. The MDM is
chosen as the PIM, because this model is adapted to
the development of European metadata. The DPM is
used as the PSM, because it is used in European
regulation (not only financial), for its implementation
in XML, XBRL or iXBRL. By means of the MDM
the definitions and rules are formalised and the
semantics of the XBRL Data Model (XBRLDM) are
audited. The automation of this mapping is also
proposed and implemented in the DPM Architect
(Morales, 2017). The aim of this research is to clarify
the XBRL and multidimensional data models, as well
as the mapping from XBRL to the MDM and vice
versa.
The DPM is the logical model used in Europe
(EBA, ECB, EIOPA, etc.) and a CEN standard
(2013). This is very close to end-user applications,
and is oriented exclusively to development using the
XBRL specification (Díaz, 2012; DPM, 2020). At
present, the IS departments of regulatory bodies with
very large taxonomies have an important challenge,
because taxonomies and their validations are created
without public test cases. The approach of this paper
provides a way forward for the generation of these
test sets.
The DPM is a logical model very adapted to the
expert user and the design is presently almost
automated. In Europe it is very widely used, and a
group that specialises in the modelling of this type of
report wish it to become an ISO standard (Piechocki,
2014). The DPM is very extended for the EBA, SRB
(Single Resolution Board), ECB and EIOPA. An
example of the EBA is the Reporting framework 2.10,
31/12/2020 https://eba.europa.eu/risk-analysis-and-
data/reporting-frameworks/reporting-framework-
2.10, with 74726 concepts, 259 dimensions, 49
domains, etc. Another example is the SRB v.4.0.3
31/12/2019, https://srb.europa.eu/en/content/2020-
resolution-reporting. EIOPA, for example v2.6.0,
15/7/2021, https://www.eiopa.europa.eu/tools-and-
data/supervisory-reporting-dpm-and-xbrl_en. The
European Agencies provide all the definitions of their
DPMs and detail the taxonomy that forms them,
including its mapping. However, since they are real
taxonomies, they are much more complex than the
example shown in this article. The DPM
methodology has remained practically stable since its
first iteration/formalization at CEN (2013). However,
it is in mind by users, its evolution in the
Life Cycle of Software Development Design in European Structured Economic Reports
167

short/medium term, incorporating it as an ISO
(International Organization for Standardization)
standard and with some revision. In particular, the
review should improve certain aspects such as the
best coverage of different use cases, both to better
cover certain financial cases (statistical and
transactional) and non-financial cases.
ACKNOWLEDGEMENTS
This article was made possible thanks to XBRL Spain
especially I. Boixo and M. T Sainz Ph. D. affiliated
with XBRL Spain and Bank of Spain, and the support
of A. Azcoaga from EIOPA. Finally, my deep thanks
to my assistant, A. Forner, who passed away last May.
Since, without their work and effort, this research
work would not have been carried out.
REFERENCES
Boixo, I., Flores, F., 2005. New Technical and Normative
Challenges for XBRL: Multidimensional in the COREP
Taxonomy. July 18
th
, 2005. The International Journal
of Digital Accounting Research, Vol. 5, N. 9, 2005,
pages 79-104. ISSN: 1577-8517.
BR-AG, 2020. Business Reporting. http://www.br-ag.eu/.
BSI-MIR (2010). Balance Sheet Items (BSI) and Monetary,
Financial Institutions (MFI). Interest Rates (MRI).
Date: January 27
th
, 2010. www.eurofiling.info/bsi-
mirTaxonomies/Taxonomy.Shtml.
CEN, 2013. Workshop Agreement CWA,
http://cen.eurofiling.info/, 11
th
December 2013.
Debreceny, R., Farewell, S., Piechocki, M., Felden, C.,
Gräning, A., 2010. Does it add up? Early evidence on
the data quality of XBRL filings to the SEC. Journal of
Accounting and Public Policy, volume 29, issue 3, June
2010. Pages 296-306.
Díaz A., 2012 Opening & Welcome (XBRL Week in
Madrid hosted by Bank of Spain and Business Register,
9th XBRL Europe Day), May 11
th
, 2012.
http://www.eurofiling.info/15th_worksop/presentation
s/AnselmoDiaz-welcome.pdf.
DPM, 2020. Data Point Model (DPM) References.
Eurofiling. “http://www.eurofiling.info/dpm/”.
EBA, 2011. EBA BS 180 (CP50 ITS on reporting – Annex
III to V FINREP templates and instructions). November
30
th
, 2011.
https://eba.europa.eu/file/33721/download?token=eqd
QEiuw.
EBA, 2018. Reporting framework 2.7.
“https://eba.europa.eu/risk-analysis-and-
data/reporting-frameworks/reporting-framework-2.7”.
Engel, P., Hamscher, W., Shuetrim, G., Kannon, D. vun,
Wallis, H., 2008. Extensible Business Reporting
Language (XBRL) 2.1. July 2
nd
, 2008. Published by
XBRL International. http://www.xbrl.org,
“http://www.xbrl.org/Specification/XBRL-2.1/REC-
2003-12-31/XBRL-2.1-REC-2003-12-31+corrected-
errata-2013-02-20.html”..
ESMA, 2020. The European Securities and Markets
Authority (ESMA): https://www.esma.europa.eu/.
Eurofiling, 2011. Proof-of-concept sample, Eurofiling data
modelling and taxonomy architecture. June 12
th
, 2011.
Copyright © 2005-2011 European Banking Authority
using European Union Public Licence.
http://www.eurofiling.info/dpm/,
http://www.eurofiling.info/finrepTaxonomy/taxonomy
2012.shtml.
Eurofiling, 2012. Eurofiling: New, 2012. FINREP
Taxonomy.
http://www.eurofiling.info/Finreptaxonomy/Taxonom
y2012.shtml.
Eurofiling, 2020. http://www.eurofiling.info.
Felden, C., 2007. Multidimensional XBRL (New
Dimensions of Business Reporting and XBRL). DUV
Deutscher Universiäts-Verlag. Pages: 191-209,
November 18
th
, 2007.
Fischer, H., 2011. XBRL Formula Overview 1.0, Public
Working draft, 21 December 2011. XBRL
International. Public Working Draft.
Gogolla M., Büttner F., Richters M., 2007. USE: A UML-
Based Specification Environment for Validating UML
and OCL. Science of Computer Programming, volume
69, Issues 1–3, 1 December 2007, Pages 27-34
Hamscher, W., Kannon, D., 2000. Extensible Business
Reporting Language (XBRL) Specification. July 31st,
2000. Published by XBRL International.
Hernández-Ros, I., Wallis, H., 2006. XBRL Dimensions
1.0. April 26
th
, 2006. XBRL International.
http://www.xbrl.org/Specification/XDT-REC-2006-
09-18.htm.
IFRS, 2020. International Financial Reporting Standard
(2019):” https://www.ifrs.org/”.
Inmon, W.H., 2005. Building the Data Warehouse. 4
th
Edition. John Wiley & Sons 2005.
Jarke, M., Lenzerini, M., Vassiliou, Y., Vassiliadis, P.,
2003. Fundamentals of Data Warehouses, 2nd Ed.
Springer.
JiMei. L., HuiZhou, Z., MeiJie, D., 2012. Analyzing
Semantic Heterogeneity in XBRL Taxonomies: an
Ontology Perspective. Proceeding ICMECG '12,
Proceedings of the 2012 International Conference on
Management of e-Commerce and e-Government.
Jimei, L., Yuzhou, H., Meijie, D., 2013. XBRL in the
Chinese Financial Ecosystem. IT Professional
Magazine (Dec 2013): 36.
Lee, H.L., Padmanabhan, V., Whang, S., 1997. The
bullwhip effect in supply chains. Sloan Management
Review, 38(3)-93-102, year 1997.
MDA, 2020. Model Driven Architecture.
https://www.omg.org/mda/
Morales, M., 2017. DPM Architect - Relational Database
Back-End. June 8
th
, 2017. IX Eurofiling XBRL week in
Frankfurt.
Morilla, V., 2008. XBRL Formulae Tutorial. September
WEBIST 2020 - 16th International Conference on Web Information Systems and Technologies
168

29
th
, 2008. IX European Banking Supervisors, XBRL
Workshop, Paris.
Ñustes, S. A., Hurtado, J. L., Rengifo, Y. P., 2016.
MDDCLOUD: Framework MDD para Aplicaciones
Web Empresariales según Especificación Requisitos de
Software. Revista Amazonía Investiga. Vol 5, No 8
(Año 2016)
OMG, 2020. Object Management Group, Inc:
http://www.omg.org/mda/.
Openfiling, 2020. http://www.openfiling.info.
“http://www.openfiling.info/academy/”.
Piechocki, M., 2014. DPM as ISO standard. XBRL week in
Brussels, 14
th
XBRL EU Day & 20
th
Eurofiling
Workshop,
Kimball, R., 1996-2004. The Data Warehouse Toolkit
series. John Wiley & Sons 1996-2004
Santos, I., 2013. Data Point Model (DPM) versus
Multidimensional Data Model (MDM). Contribution
for DPM Chapter in CEN WS XBRL Plenary Session,
Dublin, April 19
th
, 2013. Hosted by the Central Bank of
Ireland.
Santos, I., 2016. Framework for multidimensional
definition of the data model, structure, taxonomies and
rules of the XBRL specification. Doctoral Thesis, in the
Carlos III University of Madrid, Computer Science
Department, Leganés (Madrid), Spain, February 10
th
,
2016.
Santos, I., Castro, E., 2010. XBRL, UML and Database:
State of the Art. November 24
th
, 25
th
, 2010. XIII
European Banking Supervisors, XBRL Workshop,
Luxembourg. Organized by the XBRL Operational
Network of the Committee of European Banking
Supervisor, and hosted by Commission de Surveillance
du Secteur Financier of Luxembourg.
Santos, I., Castro, E., 2011. XBRL and the
Multidimensional Data Model. In Proceedings of the 7
th
International Conference on Web Information Systems
and Technologies, WEBIST 2011, pages 161-164,
Noordwijkerhout, The Netherlands, May 6
th
-9
th
, 2011.
Santos, I., Castro, E., 2011a. Proof of Concept of mapping
a XBRL report versus a RDBMS, September 5
th
, 2011.
XBRL Openfiling 1st, General Assembly, organized by
XBRL Operational Network of the European Banking
Authority, and hosted by the Banca D’Italia. September
5
th
, Banca d’Italia, Rome, Italy.
http://www.openfiling.info/?page id=286.
Santos, I., Castro, E., 2011b. XBRL Interoperability
through a Multidimensional Data Model. IADIS
International Conference on Internet Technologies &
Society (ITS 2011). Shanghai, China, December 8
th
-
10
th
, 2011.
Santos I, Castro E, Velasco M (2016). XBRL Formula
Specification in the Multidimensional Data Model.
Journal: Information Systems, volume 57, April 2016,
pages 20–37. Doi:10.1016/j.is.2015.11.001
Santos, I., Hommes, R., Heinze K. 2013. Improving
transparency in financial and business reporting -
Harmonisation topics – Part 5: Mapping between DPM
and MDM. CEN WS XBRL.
http://cen.eurofiling.info/wp-content/upLoads/data/
WA_XBRL_WI001-5-E.pdf.
Santos, I., Nieto, A., 2014. Formal validation of Data Point
Model. XBRL week in Brussels, National Bank of
Belgium. November 26th, 2014.
http://www.eurofiling.info/201411/index.shtml.
Santos, I., Nieto, A., 2015 Validation of the DPM and
Database Implementation. XBRL week in Madrid,
Eurofiling Workshop, Madrid, 3
rd
June 2015. Business
Register and Bank of Spain, Madrid, Spain.
http://eurofiling.info/portal/data-point-model/.
Schmehl, K., 2009. Data Model and Matrix Schemas. XI
European Banking Supervisors XBRL Workshop,
November 16
th
-20
th
2009, Vienna, Austria.
SDMX, 2020. Statistical Data and Metadata Exchange,
https://sdmx.org/.
Wagenhofer, A., 2003. Economic consequences of Internet
financial reporting. Schmalenbach Business Review
(SBR), 55(4):262–279, year 2003.
Weber, A.-M, Declerck T.,Hommes, R., Santos, I. 2013.
Improving transparency in financial and business
reporting—Harmonisation topics — Part1: European
data point methodology for supervisory reporting. CEN
WS XBRL. http://cen.eurofiling.info/,
http://cen.eurofiling.info/wp-
content/upLoads/data/CWA_XBRL_WI001-1-E.pdf,
http://www.xbrlwiki.info/index.php?title=Guidelines_f
or_Data_Point_Modeling.
Weller, A (2015) EBA Taxonomies or “Benny the tomcat
serve to demonstrate the evolution in Regulatory
reporting in the financial sector”, 15
th
XBRL EU,
XBRL week in Madrid,
http://www.eurofiling.info/201506/index.html.
Williams, S.P., Scifleet, P.A., Hardy, C.A., 2006. Online
business reporting: an information management
perspective. International Journal of Information
Management, 26(2):91–101.
XBRL International, 2009. Formula 1.0, Recommendation
22 June 2009. http://www.xbrl.org/specification/
formula/rec-2009-06-22/formula-rec-2009-06-22.html.
Life Cycle of Software Development Design in European Structured Economic Reports
169
