Visualization Method of Important Regions
by Combination of Webpage Structures and Saliency Maps
Yuya Inagaki
1a
, Hajime Iwata
2
, Junko Shirogane
3
and Yoshiaki Fukazawa
1b
1
Fundamental Science and Engineering, Waseda University, Tokyo, Japan
2
Department of Information Network and Communication, Kanagawa Institute of Technology, Kanagawa, Japan
3
Department of Communication, Tokyo Woman’s Christian University, Tokyo, Japan
Keywords: Saliency, Saliency Map, Webpage, Important Region, Summary.
Abstract: In this research, we propose a new visualization method for important areas of a webpage by calculating the
saliency in element units using a combination of the structure of the webpage and the saliency map at the
development stage. By arranging important information in areas where attention is likely to be focused, users
can easily find such information, leading to efficient user acquisition. In addition, a summary map that
summarizes particularly important areas into one image should help grasp the page contents. Compared to a
traditional saliency map, the visibility of important areas is easier to see, allowing designers to accurately
determine which elements are likely to be noticed when a user views a webpage during the development phase.
1 INTRODUCTION
When developing a website, designers design the
layout so that desired elements draw the user’s
interest and can be easily reached. However, many
webpages have a low usability, making them difficult
to use. Users often struggle to find the desired
element even if the design is good. Users tend to leave
webpages with poor usability, which can result in
poor quality of service and missed users. This is
partly because the designer’s intention is not reflected
in the design, creating a gap between the information
that the designer wants users to see and the
information that users actually see.
We believe that it is effective to visualize areas
that are likely to be noticed by users based on a
saliency map, which shows the ease of attention of a
person. The saliency which is the degree of gaze of
each pixel estimated from the image to be analyzed
and shown in the figure is called a saliency map.
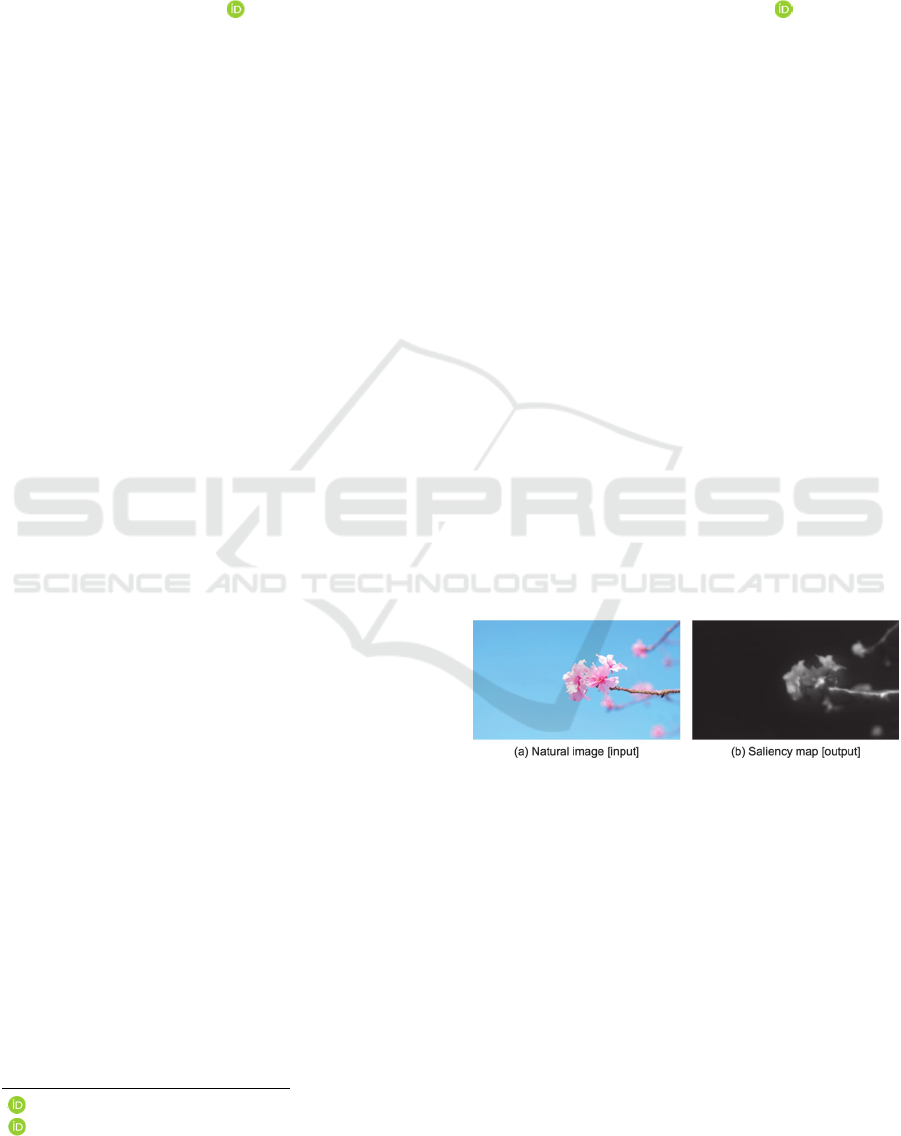
Figure 1 shows the example of saliency map, this
figure’s bright area means high saliency and dark area
means low saliency. Presenting a saliency map to
designers in the development stage should mitigate
such problems before they occur. Many studies have
investigated models to generate saliency maps of
a
https://orcid.org/0000-0002-5352-7426
b
https://orcid.org/0000-0003-0196-2108
natural images such as landscapes and human faces.
However, studies have not focused on models to
generate saliency maps specialized for webpages. In
addition, it is difficult to see which elements of a
webpage are conspicuous just by viewing a saliency
map.
Figure 1: Example of a salient map.
Here, we propose a visualization method for
important areas of a webpage by calculating the
saliency of each element. Specifically, our method
combines the structure of the webpage and the
saliency map at the development stage. In this
research, we predict which areas will attract users’
attention when developing and designing webpages.
Then the analysis will help design an easy-to-use
webpage. In addition, by predicting where users are
likely to focus on a webpage, designers can arrange
204
Inagaki, Y., Iwata, H., Shirogane, J. and Fukazawa, Y.
Visualization Method of Important Regions by Combination of Webpage Structures and Saliency Maps.
DOI: 10.5220/0009885502040211
In Proceedings of the 15th International Conference on Software Technologies (ICSOFT 2020), pages 204-211
ISBN: 978-989-758-443-5
Copyright
c
2020 by SCITEPRESS – Science and Technology Publications, Lda. All rights reserved
important information for ease of users, which should
lead to efficient user acquisition.
In addition, we propose a summary map that
aggregates important regions with a high saliency into
one image from the saliency ranking generated for
each element. This summary map is a method to
support the understanding of the page contents. Areas
with a high saliency are likely to be noticed by the
user and often include important content. Therefore,
presenting a diagram that summarizes important areas
may support the understanding of the contents on a
webpage.
2 RELATED WORKS
Many studies have investigated models to generate
saliency maps of natural images due to the recent
advances in image analysis technology. However,
previous reports have not investigated the saliency
map generation model and the structure of the
webpage. Difficulty to see high saliency points is
another problem.
2.1 Studies on Saliency Map
Generation Model
Various models have been proposed to calculate the
saliency of natural images. Among them, the saliency
model of Itti-Koch et al. (Itti, Koch and Niebur, 1998)
is widely known as a basic saliency map generation
model. In this model, the saliency map is generated
by extracting visual features of color, luminance, and
direction. These are then added together in the same
way as the visual recognition of the human eye. This
model has been used in a number of studies related to
visual saliency.
Kummerer et al. (2016) constructed a saliency
map generation model for natural images called Deep
Gaze 2 using a trained VGG19 neural network. In the
evaluation of the AUC, MIT 300 (Bylinskii, 2018),
which is the benchmark of the MIT saliency map, was
evaluated to have the best accuracy compared to other
models (Kummerer et al., 2016).
Some saliency map generation models specialize
in graphic design or natural images. Bylinskii et al.
constructed a saliency map generation model by
dividing the data into two types: graphic design such
as a poster and data, including texts and tables. Then
they collected the respective data sets in different
formats to construct a neural network model. The
neural model can generate a saliency map of graphic
design with higher accuracy than the existing model
(Bylinskii et al., 2017).
Some saliency map generation models are
specialized for webpages. Human attention can be
roughly divided into bottom-up and top-down factors.
The former is mainly due to low-level features such
as color, brightness, and direction, whereas the
second is a top-down factor such as memory
dependence and knowledge-driving based on past
experience. Shen et al. proposed a method to generate
a saliency map of a webpage by combining a top-
down factor with a conventional bottom-up factor
saliency model (Shen and Zhao, 2014).
In all of these studies, the final output is only a
saliency map that shows the ease of attracting human
gaze with a heat map. Even if a saliency map with
high accuracy is outputted, it is difficult to determine
quickly which regions are easily noticed.
2.2 Studies on Webpage Structure
Analysis
Nonaka et al. pointed out a problem with the VIPS
algorithm (Cai et al., 2003). It divides the structure of
a webpage. They proposed a method to extract the
method publication location by analyzing the
structure of the webpage and the contents from the tag
information (Nonaka et al., 2009). In addition, Cai et
al. proposed a method to extract the structure of web
content by identifying the relationships between
content based on visual expressions. They show that
their method outperformed the traditional DOM-
based method (Cai at al., 2003). However, none of
these methods can detect a region with high
importance from the extracted layout structure.
3 PROPOSED METHOD
3.1 Method Overview
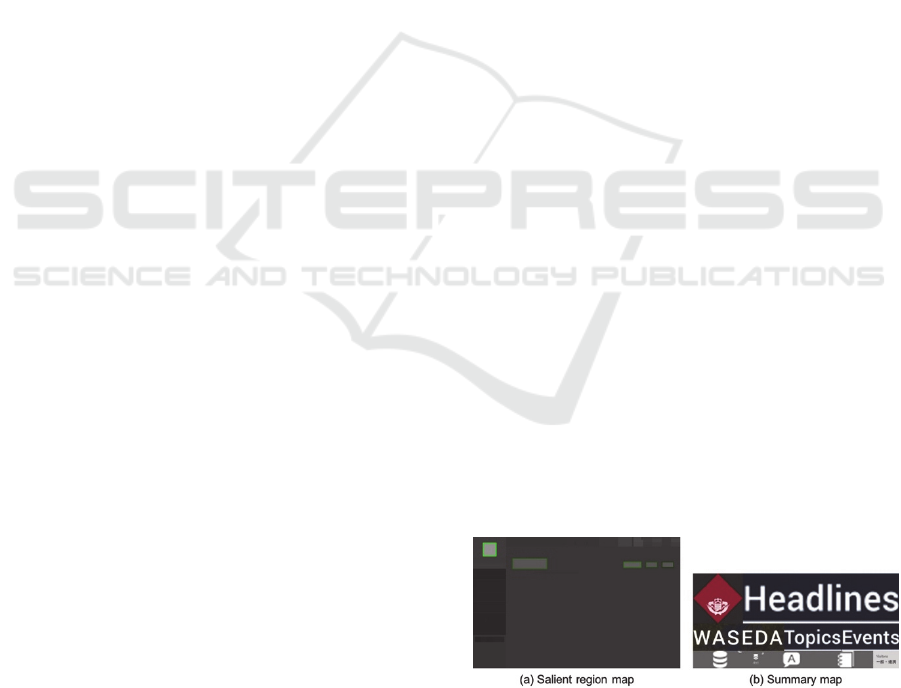
Figure 2: Example of a salient region map and a summary
map.
This study has two main objectives. One is to
generate a salient region map, which is a saliency map
Visualization Method of Important Regions by Combination of Webpage Structures and Saliency Maps
205
for element units, by combining an existing saliency
map and the structure of a webpage. The other is to
generate a summary map to visualize a region of high
importance by calculating the degree of saliency for
each element, ranking, and trimming a region of high
importance.
Figure 2 shows examples of a salient region map
and a summary map generated by our system using a
screenshot of the top page of the Waseda University
website (December 2018) as the input (Waseda,
2018). In the saliency area map on the left, the
brighter the spot, the higher the saliency. The results
indicate that the Waseda University mark is
particularly noticeable. In addition, the summary map
on the right easily allows the contents described on
the webpage to be verified.
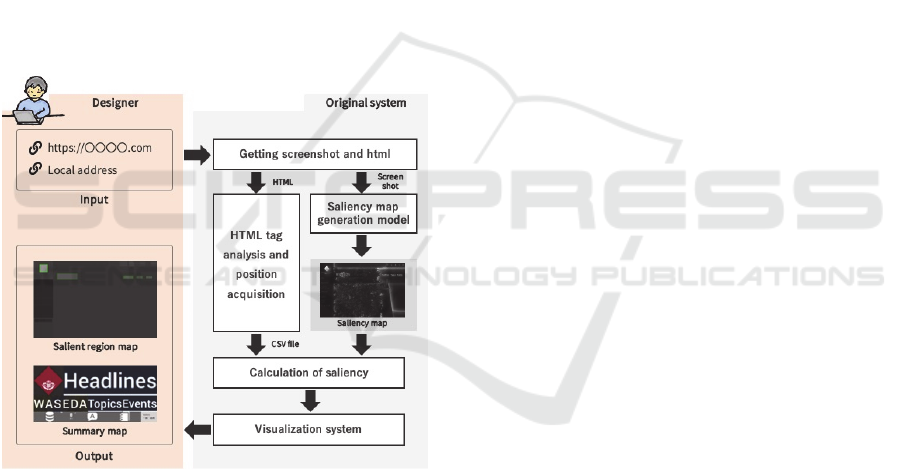
Figure 3 overviews our method. First, a designer
inputs the URL of a webpage. Then our method
verifies the two figures described above and outputs
the results by combining the saliency map of the
relevant page and the structure of the page.
Figure 3: Overview of our method.
Our method uses the following procedure:
1. Generate a saliency map using a model
2. Conduct tag analysis and position acquisition
3. Calculate saliency considering weight
4. Visualize salient region
3.2 Step 1: Generate a Saliency Map
using a Model
In our system, first screenshots and HTML are
acquired using Selenium WebDriver (Selenium,
2019), which is a web scraping technology, based on
the input URL information. The screenshot focuses
on the top area that can be viewed with a 1280×900-
pixel browser because more important content tends
to be at the top of a webpage.
Then a saliency map is generated from the
captured screenshots using the most basic generation
model of Itti-Koch et al. Here, the saliency map
outputted by the saliency map generation model is
constructed in three color channels of RGB.
However, to use the lightness in later processing, the
color channels are converted and saved as a grayscale
image, which is a single-color channel.
3.3 Step 2: Conduct Tag Analysis and
Position Acquisition
In this step, the HTML from Step 1 (Section 3.2) is
analyzed. Position information of the element on the
webpage and its size are determined. For each
element, the HTML is analyzed to acquire the id or
class name of each element. The coordinates of the
upper left vertex as well as the vertical and horizontal
sizes are determined with Selenium WebDriver. Note
that a total of seven tags are obtained: <div>
(representing block elements), <h1>, <h2>, <h3>
(representing headings), <a> (representing links),
<span> (representing inline elements), and images
<img>. To reduce the processing time and prevent
errors, only the information of the elements displayed
on the screen is acquired.
3.4 Step 3: Calculate Saliency
Considering Weight
Here, the saliency of each element is calculated by
comparing the saliency map generated in Section 3.2
with the position information and the size of each tag
element acquired in Section 3.3. First, the saliency
map image saved in Section 3.2 is compressed to the
same scale as the position information obtained in
Section 3.3. Next, the area of the corresponding
element of the saliency map read for each tag element
acquired in Section 3.2 is trimmed. Then, the saliency
is obtained by calculating the average brightness of
the color in the trimmed area. However, if the average
lightness of the color is simply set as the saliency of
the element, the saliency of an extremely small
element is high. This causes a problem where the
saliency of the element cannot be calculated equally,
regardless of size.
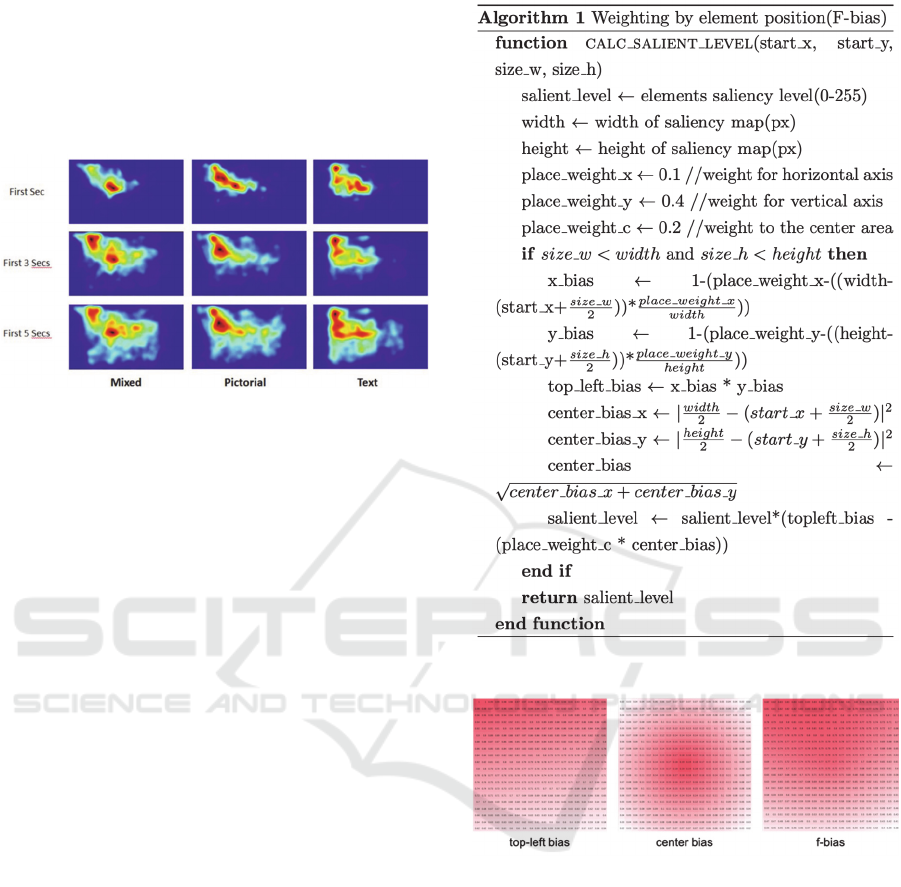
According to an experiment that measures the
saliency of a webpage using an eye tracker, Shen et
al. found that people tend to look at the upper left area
and near the center of the webpage (Fig. 4) (Shen and
Zhao, 2014). This phenomenon is commonly known
ICSOFT 2020 - 15th International Conference on Software Technologies
206
as the f-bias. In our system, not only the element size,
but also weighting is performed based on the position
information of the element. Hence, the saliency
increases in the upper left area and near the center of
the webpage. In this way, we are trying to determine
the saliency accurately.
Figure 4: Shen et al. webpage saliency heat map generation
experiment results.
3.4.1 Weighting by Element Size
If the average lightness of the elements is simply set
to the saliency, small elements tend to have extremely
high calculated values. Therefore, the experiment is
repeated several times, and the saliency is averaged
by setting the weighting based on an original criterion
so that the saliency of extremely small elements is
judged to be low.
3.4.2 Weighting by Element Position
Figure 5 shows the weighting algorithm based on the
position information of this system. The top-left bias,
which gives a large weight to the upper left area, is
expressed by giving two numerical values,
𝑝𝑙𝑎𝑐𝑒_𝑤𝑒𝑖𝑔ℎ𝑡_𝑥 and 𝑝𝑙𝑎𝑐𝑒_𝑤𝑒𝑖𝑔ℎ𝑡_𝑦 , which
indicate the difference in the weight between the
horizontal and vertical axes. In the case of center bias,
which gives a large weight to the center area, it is
expressed as 𝑝𝑙𝑎𝑐𝑒
, which indicates the
weight difference between the center and the
outermost part. By combining these, the f-bias with a
large weight to the upper left and the center is
expressed.
Figure 6 shows the results of simulating the values
of the weights using a square of 20×20 blocks as a
webpage for the top-left bias (left), center bias
(middle), and the f-bias (right). The f-bias combines
the top-left and center biases. A darker color indicates
a larger weighting of the numerical value, while a
color closer to white indicates a smaller weighting.
Figure 5: Weighting method using location information.
Figure 6: Simulation of weighting by location information.
3.4.3 Basis for Weighting
For the weighting based on the size and position of
the elements described in Section 3.4.1 and Section
3.4.2, the values from our experimental values, which
are based on original criteria, are used. Since there is
no basis for their weights, we are currently
conducting an experiment to collect actual gaze data.
See Chapter 4 for details.
3.5 Step 4: Visualize Saliency Region
Finally, a saliency ranking is created based on the
saliency calculated in Section 3.4 to visualize the
saliency area. Our system generates two outputs: a
Visualization Method of Important Regions by Combination of Webpage Structures and Saliency Maps
207
salient region map and a summary map. For the
salient region map, the element areas are filled with
lightness according to the saliency, whereas elements
with particularly high saliencies are combined in the
summary map. To create a saliency ranking, the
ranking may be assigned in descending order of
saliency. However, one issue is that other elements
included in the same element are also highly
evaluated (Fig. 7). For this reason, an evaluation is
performed so that external elements that include
elements evaluated with high saliency do not enter the
saliency ranking.
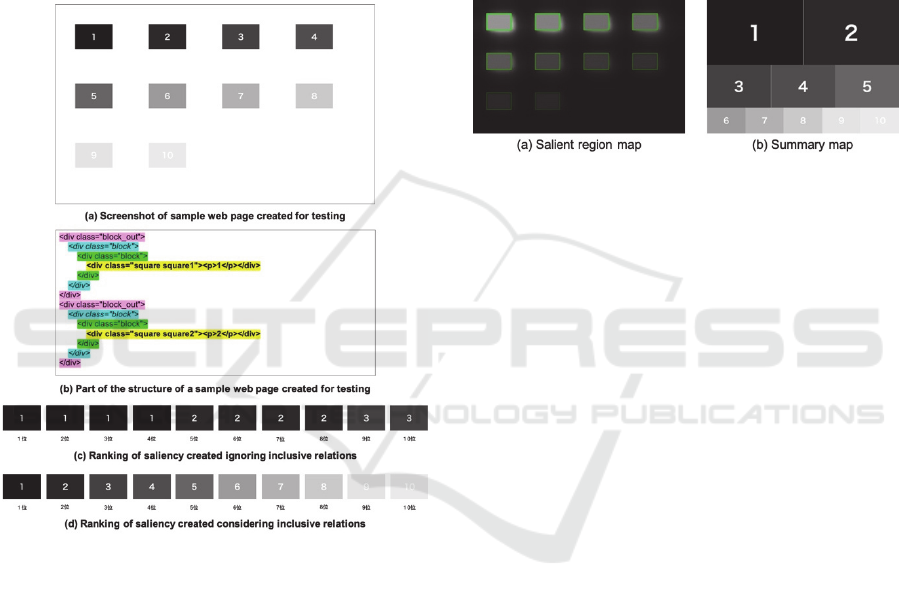
Figure 7: Ranking of saliency by considering inclusion
relations.
3.5.1 Generate Saliency Region Map
All the elements displayed on the screen are filled
with lightness corresponding to the saliency from 0 to
255, as calculated in Section 3.4. However, since the
saliency differs greatly in the image, the saliency map
of the image is displayed as-is. Some of the images
on a webpage can be very small icons. Based on
Windows and macOS icon guidelines, if an image is
smaller than 64 pixels, it is regarded as an icon and
the element is filled without generating a saliency
map.
Furthermore, to visualize important areas with a
particularly high saliency, the outer frames of the top
10 elements in the saliency ranking are drawn with
bright green lines to demonstrate the saliency level.
3.5.2 Generate Summary Map
The area of the top ten elements with the highest
saliency is extracted and arranged in tiles in
descending order of the saliency to generate a
summary map. Figure 8 shows an example of a salient
region map and a summary map generated by
entering the URL of the test inclusion webpage
described in Fig. 7.
Figure 8: Examples of a generated saliency area map and an
aggregated map.
4 USER’S GAZE DATA
EXPERIMENT
As explained in Section 3.4.3, the relationship
between the user’s gaze and the structure of the
webpage should be evaluated for weightings based on
the size and position information of the element with
evidence. Although several gaze datasets exist for
natural images, gaze datasets for webpages are
limited and none are for a Japanese dataset.
Therefore, we conducted an experiment to obtain
gaze data of Japanese webpages from 35 subjects.
The experiment used 270 webpages in 10 sites from
the 27 categories listed in the website database called
Ikesai. In addition, a calibration was performed for
each subject, in which a subject viewed five
webpages for 10 seconds each to acquire gaze data.
We are currently analyzing the results. However,
an early finding suggests that webpages of websites
with many images tend to be viewed near the center
instead of from the upper left. Eventually, this
observation may serve as a basis for weighting.
5 EVALUATION
To evaluate our method, three experiments were
performed involving 10 university students and
graduate students in their 20s. All subjects were
Internet users who accessed the Internet on a daily
ICSOFT 2020 - 15th International Conference on Software Technologies
208
basis. Since these evaluations were performed before
conducting the gaze data acquisition experiment,
there is no basis for the weighting.
5.1 Extraction Accuracy of Important
Areas
To measure the accuracy of the extraction of
important regions by the proposed method, each
subject viewed screenshots of 10 webpages on an
iPad. The 10 webpages used in the experiment are the
first displayed webpage of each category randomly
selected from the industry categories of Japan Web
Design Gallery, which introduces Japanese web page
designs by industry category (Japan Web Design
Gallery, 2019). Also, all the sites used in the
experiments are fairly complex web pages composed
of more than 30 elements. Each webpage was viewed
for 10 seconds, and then the subjects marked three
places they felt were conspicuous in order with
numbers 1 to 3 using an Apple pencil. We verified the
accuracy of the outputted elements by confirming
whether the conspicuous elements are included in the
saliency ranking.
Table 1 shows the results of the accuracy
evaluation experiments. The average number of
matches indicates how many of the three elements
marked by the subjects are included in the elements
outputted by the saliency ranking of our system. The
match rate indicates a ratio. Among the top 3
elements with the highest saliency output by our
method, the average matching ratio is 1.14 (38.0%).
In addition, the top 10 elements judged to be of high
importance by this system have a match rate of 88.0%
with the ones that the subject marked. Hence, our
system can appropriately determine and acquire the
elements that people find important.
Table 1: Accuracy evaluation experiment results.
Top 3 Top 5 Top 7 Top 10
Average
number of
matches
1.14/3 1.75/3 2.04/3 2.64/3
Match
ratio
38.0% 58.33% 68.0% 88.0%
5.2 Ease of Recognition of Important
Areas via a Saliency Map
Here, we evaluate the ease of recognizing important
regions using the existing saliency map using the
most basic generation model of Itti-Koch et al. and
the proposed salient region map. As part of the
experiment, a questionnaire was conducted after
briefly explaining the saliency map. Written
responses were provided for two questions. What are
the differences in the ease of recognizing important
areas between the traditional saliency map and our
salient region map? What do you find easy or difficult
to recognize using a saliency map?
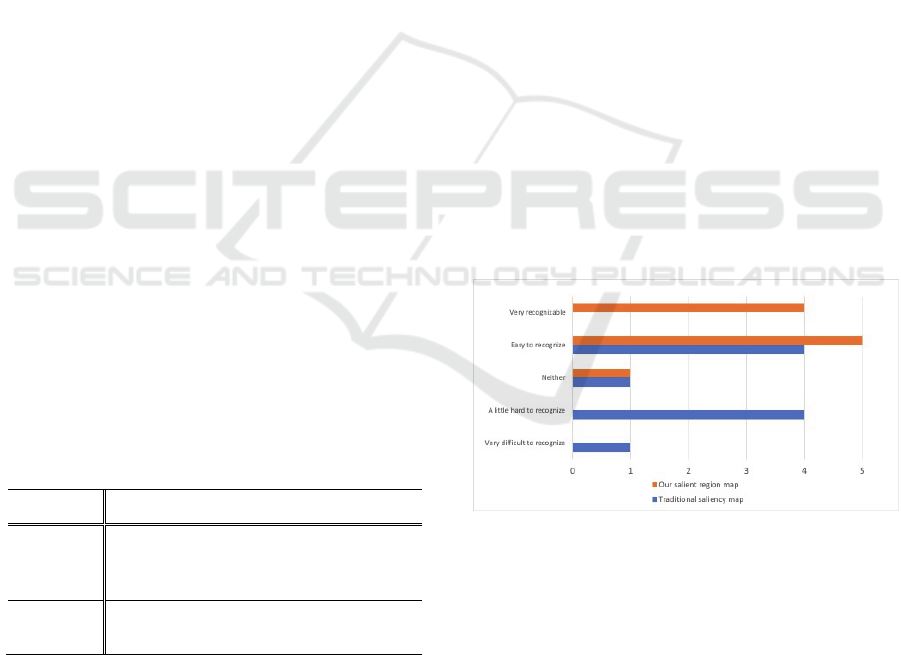
Figure 9 shows the results of the question
regarding the ease of recognition of the important
area. The proposed method is superior to existing
saliency maps in recognizing important regions.
The following opinions were expressed regarding
the ease of recognizing important regions of the
traditional saliency map and our salient region map.
There were many positive opinions that our proposed
method is an improvement compared to a traditional
map. Comments included, “It is difficult to
understand the boundaries of elements in the
traditional map” and “It is difficult to compare the
degree of saliency in the traditional map.” However,
we received some negative feedback about our
saliency region map compared to the existing saliency
map. Comments included, “needs to be compared
with the screenshot because the original webpage
can’t be seen.” and “It is hard to understand the
difference in the shading of the lines of the saliency
rank.” It is necessary to solve the problems listed as
difficulties in recognizing the proposed salient region
maps.
Figure 9: Evaluation results on the recognition ease of
important areas.
In addition, all 10 subjects answered that the
proposed method is superior to the traditional salient
map when asked which method makes it easier to
recognize the importance survey of specific elements.
Consequently, the accuracy of our saliency region
map described in Section 5.1 and the ease of
recognizing important areas are improved compared
to the existing saliency map.
Visualization Method of Important Regions by Combination of Webpage Structures and Saliency Maps
209
5.3 Ease of Recognition of Important
Areas via a Summary Map
Here, we evaluate the effect of a summary map in
which important areas with particularly high saliency
are arranged in tiles. In the evaluation, the subject was
first shown an example of the summary map and we
briefly explained how the figure was generated. After
that, the subjects completed a multiple-choice
questionnaire about the effect of the summary map.
Table 2 shows the results of asking about the
extent that the contents of a webpage can be judged
by looking at the summary map. Many responses
indicated “Can judge a little” and “Can judge to some
extent.” None of the respondents indicated “Can't
judge at all.”
Table 3 shows the results of asking whether a
summary map is effective to quickly check the
contents of a webpage at a glance. Two responses
were “Not very effective,” two were “Neither,” and
six were “Somewhat effective.” None of the
responses was “Very effective.”
From the above results, the page content can be
determined to some extent by looking at the proposed
summary map. However, it was not very effective.
Hence, the proposed summary map must be improved
to be used as a content understanding support tool for
webpages.
Table 2: How much can you judge the contents of a
webpage by looking at the summary map?
Choices number
Can’t judge at all 0
Can judge a little 2
Can judge to some extent 8
Can almost judge 0
Table 3: Do you think the summary map is effective to
check the contents of your first visit?
Choices number
Not at all effective 0
Not very effective 2
Neither 2
Somewhat effective 6
Very effective 0
6 CONCLUSION
We propose a new visualization method for important
areas of a webpage by calculating the saliency in
element units by combining the structure of a
webpage and a saliency map. This method has an
acceptable accuracy of the saliency ranking output.
Compared to a traditional saliency map, the visibility
of important areas is easier to see, allowing designers
to accurately determine which elements are likely to
be noticed when a user views a webpage during the
development phase. In addition, appropriately
arranging the content makes it easier for users to
focus on important information, which leads to
efficient user acquisition.
Based on the calculated saliency, a summary map
generation model is constructed to condense areas of
high importance into one image. However, the
evaluation experiments revealed that although the
page contents are judged by looking at the summary
map, it is not very effective. Future improvement is
necessary as a tool to support webpage content
understanding.
Herein we describe the evaluation results of a
system that creates weighting based on the original
criteria in the saliency calculation considering the
weighting of Section 3.4. In the future, we will
analyze the results obtained from experiments to
acquire the user’s gaze data described in Chapter 4.
Furthermore, we classify web pages into several
layout patterns based on the acquired gaze data and
optimize weighting based on elements position
information. This should improve the extraction
accuracy of important areas by incorporating it into
our system after considering the relationship with the
size and position of elements.
We are also working on the development of a
system that receives the evaluation results of our
summary map and analyzes the elements not only at
the top of a webpage but also at the bottom to generate
an aggregate map of the entire page. With this
modification, we are studying how to create a support
tool to understand the contents of webpages at a
glance. Furthermore, we propose a webpage
summary visualization method that combines
summary visualization and text content
summarization methods.
REFERENCES
Bylinskii, Z., Judd, T., Borji, A., et al., 2018. Mit saliency
benchmark.
Bylinskii, Z., Kim, N. W., O'Donovan, P., Alsheikh, S., et
al., 2017. Learning visual importance for graphic
designs and data visualizations, In Proceedings of the
30th Annual ACM Symposium on User Interface Soft-
ware and Technology, pp. 57-69, ACM.
Cai, D., Yu, S., and Wen, J., and Ma, W., 2003. VIPS: a
Vision-based Page Segmentation Algorithm, MSR-TR-
2003-79.
ICSOFT 2020 - 15th International Conference on Software Technologies
210

Cai, D., Yu, S., Wen, J., and Ma, W., 2003. Extracting
content structure for web pages based on visual
representation. In Asia-Pacific Web Conference, pp.
406-417, Springer, 2003.
Itti, L., Koch, C., and Niebur, E., 1998. A model of saliency-
based visual attention for rapid scene analysis, IEEE
Transactions on pattern analysis and machine
intelligence, Vol. 20, No. 11, pp. 1254-1259.
Japan Web Design Gallery, 2018. Japan Web Design
Gallery, http://japan.2-wg.com/, (2019.1.12).
Kummerer, M., Wallis, T. S., and Bethge, M., 2016.
Deepgazeii: Reading fixations from deep features
trained on object recognition, arXiv preprint
arXiv:1610.01563.
Nonaka, R., Yumoto, T., et al., 2009. Extracting How-to
Information Block Based on Analysis of Structure and
Content of Web Page, pp. 1-8, DBS.
Selenium, 2019. Selenium webdriver,
https://www.seleniumhq.org/projects/webdriver/,
(2019.1.12).
Shen, C., and Zhao, Q., 2014. Webpage saliency, In
European conference on computer vision, pp. 33-46,
Springer.
Waseda University, 2018. Waseda University web site,
https://www.waseda.jp/top/, (2018.12.1).
Visualization Method of Important Regions by Combination of Webpage Structures and Saliency Maps
211
