
A Wearable System for Electrodermal Activity Data Acquisition in
Collective Experience Assessment
Patr
´
ıcia Bota
1 a
, Chen Wang
2
, Ana Fred
1 b
and Hugo Silva
1 c
1
Instituto Superior T
´
ecnico, Department of Bioengineering & Instituto de Telecomunicac¸
˜
oes,
Av. Rovisco Pais n. 1, Torre Norte - Piso 10, 1049-001 Lisboa, Portugal
2
Future Media & Convergence Institute (FMCI), Xinhua Net, Jinxuan Building,
No. 129 Xuanwumen West Street, Beijing 100031, China
Keywords:
Electrodermal Activity Response, Wearable Sensors, Physiological Data, Signal Processing.
Abstract:
In the recent years, we have been observing an increase of research work involving the use of biomedical data
in affective computing applications, which is ever more dependent on data and its quality. Many physiological
data acquisition devices have been developed and validated. However, there is still a need for pervasive and
unobtrusive equipment for collective synchronised acquisitions. In this work, we introduce a novel system,
the Electrodermal Activity (EDA) Xinhua Net Future Media Convergence Institute (FMCI) device, allowing
group data acquisitions, and benchmark its performance using the established BITalino as gold standard. We
developed a methodical experimental protocol in order to acquire data from the two devices simultaneously, and
analyse their performance over a comprehensive set of criteria – Data Quality Analysis. Additionally, the FMCI
data quality is assessed over five different setup scenarios towards its validation in a real-world scenario – Data
Loss Analysis. The experimental results show a close similarity between the data collected by both devices,
paving the way for the application of the proposed equipment in simultaneous, collective data acquisition use
cases.
1 INTRODUCTION
The field of Affective Computing focuses on the com-
puting that relates to, arises from, or influences emo-
tions (Picard, 1997). The field encompasses many
applications, such as the analysis in real-time of the
collective response of an audience during a theatrical
play or show. Collective responses can be applied to:
(1) Testing a group in order to gauge the content mar-
keting success; (2) Direct an artist into new perform-
ing/narrative concepts, leading to futuristic mechanism
where the content narrative adapts to the audience re-
sponse; (3) Enhance remote distributed systems, cre-
ating feedback channels so the actors are in contact
with the audience and aware of their response, and the
audience feels immersed and not like it is watching a
recorded video instead of a live performance, (Wang,
2018); (4) Create personalised list content recommen-
dations; (5) Enhance health applications, and many
others.
a
https://orcid.org/0000-0002-0514-7517
b
https://orcid.org/0000-0003-1320-5024
c
https://orcid.org/0000-0001-6764-8432
However, in order to gauge the collective response,
researchers need pervasive and unobtrusive physiolog-
ical sensors (Bota et al., 2019). Although many have
been developed and validated (Abreu, 2020), for group
settings, such as a theatre or cinema, there is a need in
the literature for devices able to perform data collec-
tion from a group, using several devices synchronously
and simultaneously.
Therefore, in this work we: (1) Introduce the Xin-
hua Net Future Media Convergence Institute (FMCI)
device containing a Electrodermal Activity (EDA) em-
bedded sensor, describing the hardware development
path throughout its various versions, which culminated
in an architecture capable of acquiring EDA data with
quality at least of 20 devices in simultaneously; (2)
Validate the device performance, ensuring its scala-
bility in a real-world scenario, against BITalino, a
well-established and recognised system that we con-
sider as a gold standard. The BITalino device has
been independently recognised as the most prospec-
tive physiological pervasive wearable device for heart
rate (HR) and EDA measurements in affective comput-
ing applications (Batista et al., 2019; Kutt et al., 2018).
To accomplish this task, we follow an experimental
606
Bota, P., Wang, C., Fred, A. and Silva, H.
A Wearable System for Electrodermal Activity Data Acquisition in Collective Experience Assessment.
DOI: 10.5220/0009816906060613
In Proceedings of the 22nd International Conference on Enterprise Information Systems (ICEIS 2020) - Volume 2, pages 606-613
ISBN: 978-989-758-423-7
Copyright
c
2020 by SCITEPRESS – Science and Technology Publications, Lda. All rights reserved
protocol to acquire data from the two devices simulta-
neously – Data Quality Analysis –, and compare the
obtained data using a diverse set of metrics on the
signal morphological structure, Power Spectrum (
R
2
-
score, Pearson Correlation (PC), Root Mean Square
Error (RMSE), Dynamic Time Warping (DTW) dis-
tance), and EDA – specific events to benchmark the
performance of the FMCI device. Lastly, we perform a
set of experiments to assess the FMCI device data qual-
ity under five different setup conditions towards the
validation of its performance in a real-world scenario –
Data Loss Protocol.
The remainder of this paper is organised as follows:
In Section 2, we introduce the BITalino and the FMCI
devices, and present a summary of the EDA signal. In
Section 3, we describe the data acquisition protocol
and, lastly, briefly depict the metrics we use as eval-
uation criteria to compare both sensors’ signals. In
Section 4, we present and discuss the experimental
results; and finally, in Section 5, we outline the main
conclusions, along with future work directions.
2 BACKGROUND
In this section, we introduce the EDA sensor data, the
BITalino and FMCI devices, and describe the FMCI
hardware development path throughout its versions.
2.1 Electrodermal Activity Signal
The EDA typically measures the skin resistance by ap-
plying a negligible current/voltage and reading the volt-
age/current variation output between the two sensor
leads (
G = 1/R; R = V /I
). This is based on the princi-
ple that the electrical properties of the skin change with
the psychophysiological activity of the user (Boucsein,
2012). Moreover, the EDA signal is characterised
by a baseline tonic component – Electrodermal Level
(EDL) – expressing the baseline and thermal regula-
tion activities, from which phasic variations arise from
psychological-related responses. The latter is denoted
as the Electrodermal Response (EDR) signal, derived
from the increase/decrease of perspiration, piloerec-
tion, and vasomotor changes elicited by various emo-
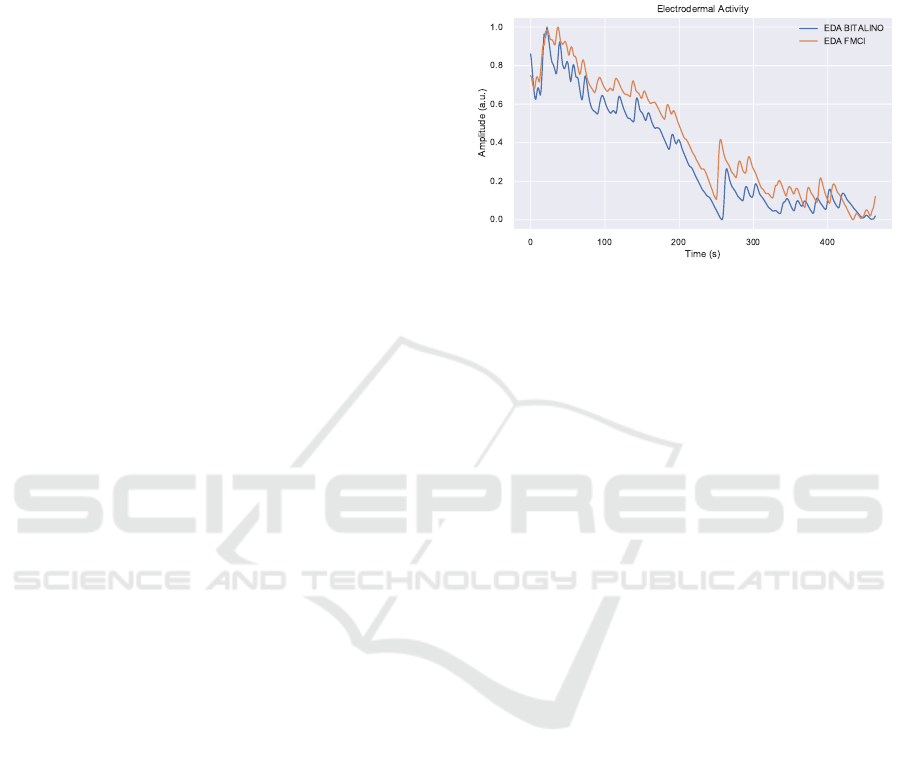
tional states via the limbic system. Figure 1 displays
an example of an EDA signal.
Sweat is highly conductive, thus, modifies the skin
resistance as a result of secretion / inhibition. For this
reason, the EDA electrodes are usually placed at areas
of high sweat gland density, such as on the
2
nd
phalanx
of the index and middle fingers, the index and ring
fingers, the hand, or feet soles (Schmidt et al., 2019).
Since the EDA can be used as a non-intrusive window
into the ANS activity, it is widely used in biomedical
research for example in diagnostic (Poh et al., 2010),
or emotion recognition (Shukla et al., 2019), polygraph
tests, or stress/relaxation biofeedback.
Figure 1: Signal trace for the FMCI and BITalino devices.
2.2 FMCI Hardware Development Path
The FMCI EDA sensor is based on a operational trans-
conductance amplifier (OTA) and a low-pass filter
(LPF). The former is used to increase the amplitude of
the weak potential differences generated from the bio-
logical electric signals. The OTA is ideal for measur-
ing signals from low level output transducers in noisy
environments, amplifying the difference between two
input signal voltages, and rejecting any signals that
are common to both input terminals, thus reducing the
undesired source errors. This is known as Common-
Mode Rejection Ratio (CMRR). The typical effective
frequency for the EDA sensors has been characterized
in the state-of-the-art to be between 0.01-1 Hz (Bouc-
sein, 2012). Nevertheless, after the OTA, a second
order low-pass Butterworth filter (gain = 2, cut-off
frequency = 5Hz) is applied to remove the frequencies
that lie outside the defined range. So far, four proto-
type versions (Figure 2) have been explored through
a continuous development cycle consisting of a thor-
ough analysis of environment testing, user experience
and sensor performance, which we detail below:
• Version 1.
It was developed using Arduino boards,
Xbee wireless transmitters, and filters – built with
resistors and capacitors to reduce noise interfer-
ence. The measurement system consisted of 15
EDA sensors, 3 Arduino boards and 4 Xbee mod-
ules. Each Arduino board (1 Hz sampling rate)
carrying 5 EDA sensors uses one Xbee module to
send data to a Xbee coordinator, connected to a lap-
top server. The Xbee coordinator applies a polling
scheme to receive packets from the different Ar-
duino boards in order to minimise packet loss ratio
in the wireless communication channel. Some lim-
A Wearable System for Electrodermal Activity Data Acquisition in Collective Experience Assessment
607

1
2
3
4
Figure 2: The hardware development path showing genera-
tion 1 (left), 2 (top), 3 (right), and 4 (bottom).
itations were found in the first generation sensor,
namely: it was not wearable, nor comfortable for
the users to use for a long time; the communication
range (10-20 meters) was rather short for a system
to be used in a collective environment; the battery
consumption was very high, being exhausted after
roughly half an hour of use.
• Version 2.
The JeeNode was selected for the devel-
opment board, as it was small, economic, and can
communicate using the 915 MHz, 868 MHz or 433
MHz band. As a result, the system integrated with
the JeeNode was much smaller and more econom-
ical than Version 1. The standard Lithium Poly-
mer battery (1100 mAh, 3.7 voltage) supported the
JeeNode attached with one EDA sensor (sampling
rate: 10 Hz) to work for over 50 hours. Besides,
the JeeNode supported up to 250 different groups,
each with up to 30 different node IDs. This meant
that large groups could be monitored simultane-
ously. However, the second version still showed
some limitations in a collective environment: the
users did not feel comfortable in terms of sensor
housing and the electrodes; the soldering work in
the lab did not yield reliability when sensors were
used in reality; some mechanical wires in the sys-
tem design created some connection problems in
the experiments.
• Version 3.
It initiated the industrialisation of the
device. Two versions were produced: one for
adults, and one for children. These sensors were
rather small, and each was fitted in a 3D printed
box of 10x5x2 cm. The EDA sensors produced by
the factory could ensure that the quality was robust
and reliable. However, this version was shown not
to be convenient for experimental operators. More-
over, taking off/putting on a sensor housing when
testing a sensor, required high effort. In addition,
there was no way for the operators to monitor the
working states of the sensors.
• Version 4.
In the current version, the circuit de-
sign was upgraded, and the sensor housing was
removed. The circuit was first prototyped on a
breadboard and connected to the JeeNode board.
After that, an EDA board was produced to obtain
a compact EDA sensor with the interfaces needed
by the JeeNode board. The JeeNode board and
EDA sensor were connected and mounted in a
customized box produced by laser cutting. Two
electrodes were connected via a cable. In this way,
operators could easily take off the sensor housing,
and test the sensor boards. Additionally, in this
version, a monitoring system to observe the work-
ing state of the EDA sensor was developed. In this
way, it could be seen which node is working or not,
so that it could be fixed or replaced.
2.3 Devices Overview
To evaluate the proposed device, we compare the
FMCI sensor performance against the BITalino
(r)evolution (Batista et al., 2019).
Regarding the BITalino device, for the data acquisi-
tion, the OpenSignals (r)evolution software
1
was used.
On the other hand, for the FMCI device, a data logger
was developed by the authors, which we made publicly
available
2
. In both devices, the data was transmitted
wirelessly, and a 2-lead accessory was used during the
data acquisition. Table 1 presents some of the devices
main specifications; no further information was found
on the Xinhua Net device.
Table 1: BITalino and FMCI device specifications.
BITalino FMCI
Measurement Range 0-25µS (with VCC = 3.3V)
Bandwidth 0-2.8Hz 0-5Hz
Consumption ∼0.72mA
Input Voltage Range 1.8-5.5V
Sampling Frequency 1000Hz 1Hz
3 METHODS
In this section, we outline the overall methodology we
followed for the benchmark of the FMCI device.
3.1 Data Quality Protocol
As explained in Section 2.1, the EDA sensors measure
the body sympathetic nervous system (SNS) activity
1
https://bitalino.com/en/software
2
https://github.com/PIA-Group/python-fmci-datalogger
-example
ICEIS 2020 - 22nd International Conference on Enterprise Information Systems
608
through the skin resistance/conductance. To promote
reflex responses and enable the benchmarking of the
devices, we devised an acquisition protocol perform-
ing an isometric handgrip test, a common state-of-the-
art clinic test to elicit reflex SNS responses (Hilz and
D
¨
utsch, 2006; Zygmunt and Stanczyk, 2010). Dur-
ing the acquisition, the subjects were asked to remain
seated while an isometric grip test was performed for
5 min. Each experiment was carried according to the
following protocol:
1. Sensors Placement.
Application of the FMCI
wearable, FMCI and BITalino electrodes. To avoid
cross-talk between the two devices, FMCI elec-
trodes were placed on the index finger and BITal-
ino’s were attached to the ring finger.
2. Isometric Handgrip Test.
The subject squeezed
a hand handgrip dynamometer at his maximum
contraction strength (calibration) and then had to
maintain above two-third of the maximum contrac-
tion strength for 5 min. The GripIT application
(Costa et al., 2019) was connected to a force sensor
and used by the subject to help them keep control
of the exerted force.
The aforementioned acquisition protocol was per-
formed by 15 subjects with ages 18 to 24 years old.
Three acquisitions were discarded. To synchronise
both devices, a BITalino Light (LUX) sensor was used
to capture the pulse emitted when the FMCI device
was turned on and turned off, i.e. when the device
started and stopped acquiring data.
3.2 Data Loss Protocol
Additionally, to evaluate the FMCI device in group
acquisitions, a test when multiple units are collecting
data simultaneously was performed for five different
environment conditions:
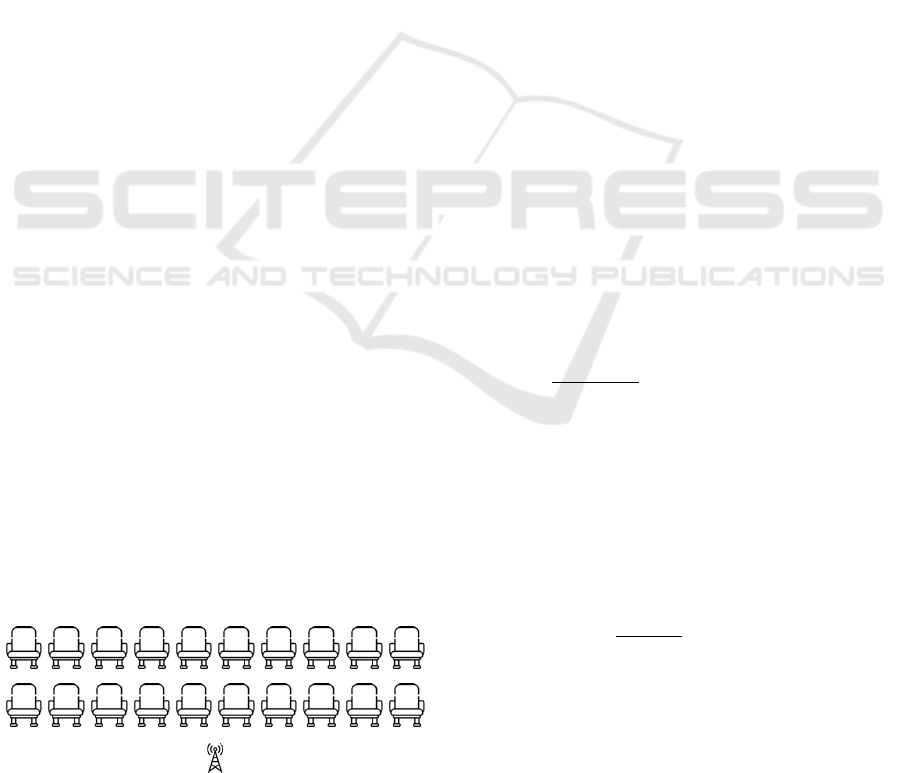
• Test 1 – 20 Devices in Simultaneous Acquisition
(60-min).
The device’s placement is displayed in
Figure 3. As it can be seen, the antenna was placed
so it was in the direct line of the centre of the
devices.
Figure 3: Devices and antenna placement setup for Test 1 –
20 devices in simultaneous acquisition.
• Test 2 – 10 Devices in Simultaneous Acquisition
(30-min).
In the second experiment, the number
of devices was reduced from 20 to 10, acquiring
data simultaneously, simulating a smaller audi-
ence. The antenna was moved, so it continued
to be placed in the centre of the devices’ group.
• Test 3 – 20 Devices at Different Ranges to the
Antenna (20-min).
With the same disposition as
Test 1, the antenna was moved in order to be at
a distance of: 270, 450, 630, and 900 cm to the
centre line of the devices.
• Test 4 – Occlusion (20-min).
In order to evaluate
the occlusion by the human body, two subjects sat
side-by-side, wearing one device in each hand.
• Test 5 – Random Movement (10-min).
The last
test consisted of the replication of common move-
ment artefacts such as: putting the bracelet on,
random movement, touching the nose and hair,
clapping, and taking the bracelet off.
3.3 Signal Pre-processing
The EDA data can be corrupted by powerline interfer-
ence, thus, in order to remove the noise, a low-pass
filter with 4Hz cut-off frequency was applied to the
BITalino device data. As stated in Section 2.3, the
BITalino has a sampling frequency of 1000Hz and the
FMCI device of 1Hz, therefore, a downsampling to
1Hz was performed using cubic interpolation. The
data was then passed through a smoothing filter.
Since scale-dependent metrics were going to be
obtained, and, to remove subjective bias, the data
was normalised per user to values between [0; 1] by
X
scaled
=
X−X.min
X.max−X.min
.
3.4 Performance Evaluation Metrics
In order to compare the waveform similarity of both
devices, we resorted to the following criteria:
• Coefficient of Determination (R
2
-Score)
(Ross,
2010)
:
consist of the percentage of variation ex-
plained the correlation between the dependent and
the independent variables. The
R
2
score is given
by:
R
2
= 1 −
∑
i
(y
i
−ˆy
i
)
2
∑
i
(y
i
−¯y)
2
. Where,
y
consists on the
observed data,
¯y
its mean value, and
ˆy
the predicted
value at data point
i ∈ {0,..,N}
;
N
being the total
number of data points. It presents a range between
negative values and a maximum value of 1 – for
the utmost best score. Thus, a value of
R
2
equal to
1 indicates that the model is able to explain 100%
of the variation of the data, while a value of
R
2
near 0, indicates that the variance of the output is
A Wearable System for Electrodermal Activity Data Acquisition in Collective Experience Assessment
609

mostly due to error random variables. The
R
2
score
is largely used in literature to evaluate regression
models.
• Pearson Correlation
(Kirch, 2008)
:
measures the
linear correlation between two variables, given by:
ρ =
∑
n
i=1
(x
i
−ˆy)(y
i
−ˆy)
√
∑
n
i=1
(x
i
−ˆx)
2
·
√
∑
n
i=1
(y
i
−ˆy)
2
. Where
x
i
and
y
i
rep-
resent two samples indexed at
i
;
n
the sample size
and
ˆx
,
ˆy
, the
x
and
y
variables sample mean, re-
spectively. It presents a value between
+1
and
−1
,
where a value of
1
denotes total positive correla-
tion,
0
no linear correlation, and
−1
, total linear
correlation with a negative slope.
• Root Mean Squared Error (RMSE)
(Neill and
Hashemi, 2018)
:
consists of the aggregation of
the magnitude of the predicted errors, through the
square root of the second sample moment of the dif-
ferences between the predicted values and the ob-
served values. It is given by:
RMSE =
q
∑
n
i
(y
i
−ˆy
i
)
2
n
.
Where
ˆy
i
is the predicted value at index
i
,
y
i
the
sample value, and
n
the sample size. It presents
non-negative values, with
0
denoting a perfect fit
of the model to the data.
• Dynamic Time Warping (DTW)
(Niels, 2004)
:
measures the Euclidean distance optimal align-
ment between two time series. The optimal
alignment (warping path) consists of the min-
imum value in the
N x M
cost matrix given
by
C(S
1
,S
2
)
, where
S
1
:= {s
11
,s
12
,...,s
1N
}
, and
S
2
:= {s
21
,s
22
,...,s
2M
}
are two time series of
length
N
and
M
;
N
,
M ∈ N
, respectively. The pa-
rameter
C(S
1
,S
2
)
, yields a small value (low cost)
if
S
1
and
S
2
are similar, and a larger value (high
cost), otherwise.
4 RESULTS
In this section, we first present a morphological and
event-based comparison analysis between the FMCI
and BITalino devices (Data Quality Protocol in Sub-
section 3.1). Then, we show an analysis of the FMCI
device data quality over five different environment se-
tups in order to evaluate its deployment in real-world
scenarios (Data Loss Protocol in Subsection 3.2).
Data Quality Results.
Table 2 and Table 3 show
the experimental results for the Data Quality Protocol
described in Section 3.1.
• EDA Morphology.
In Table 2, we observe that
both devices attain a reasonable correlation (0.65
±
0.28), displaying a very low value RMSE (0.19
Table 2: Experimental results for the morphological compar-
ison between the data from the two devices in terms of Pear-
son Correlation (PC); Root Mean Squared Error (RMSE);
R
2
-
score; and Dynamic Time Warping (DTW) distance. Nomen-
clature: EDA- Electrodermal Activity; EDR- Electrodermal
Response.
EDA Morphology EDR Morphology Power Spectrum
PC 0.65 ± 0.28 0.15 ± 0.28 0.81 ± 0.07
RMSE 0.19 ± 0.06 0.20 ± 0.03 0.14 ± 0.04
R
2
-score 0.54 ± 0.39 0.99 ± 0.65 0.42 ± 0.25
DTW 0.06 ± 0.49 0.09 ± 0.04 0.05 ± 0.03
Table 3: Experimental results for the detection of events
for the BITalino and FMCI devices in terms of: number of
events (N
º
of Events), offset between the number obtained
in both devices.
Nº of Events EDA EDR
BITalino 19.1 ± 7.0 34.6 ± 13.0
FMCI 18.5 ± 7.4 31.9 ± 12.4
Offset 3.4 ± 2.5 5.8 ± 5.0
±
0.06), reasonable
R
2
-score (0.54.
±
0.39), and
very low DTW distance (0.06
±
0.49). Thus, indi-
cating a high morphological correlation between
the data acquired by the two devices.
• EDR Morphology.
Regarding the EDR morphol-
ogy, the Pearson correlation decreases in compar-
ison to the EDA morphology analysis (0.15
±
0.28), the RMSE and the DTW distance maintain
their low values (0.20
±
0.03, and 0.09
±
0.04,
respectively), and the
R
2
-score increases to nearly
1. Therefore, although the high-frequency content
of the EDA corrupts the EDR information which
results in the detriment of the Pearson correlation,
both signals still maintain high correlation.
• Power Spectrum.
Additionally, for the power
spectrum the correlation is very high (0.81
±
0.07),
with very low RMSE and DTW distance (0.14
±
0.04, and 0.05
±
0.03, respectively), therefore, de-
noting a very high spectral correlation between
both devices signals. The
R
2
-score, is the lowest
from all the representations, possibly due to the
power spectrum being a very noisy signal with low
linear dependency.
• EDA Signal Characteristics.
Table 3 shows that
the EDA morphology, in the BITalino data ob-
tained 19.1
±
7.0 events, while in the FMCI de-
vice 18.5
±
7.4 events were found, thus resulting
in an offset of 3.4
±
2.5 events. On the other hand,
for the EDR morphology, in the BITalino data we
obtained 34.6
±
13.0 events, while for the FMCI
device we observed 31.9 ± 12.4 events.
We can conclude that overall a similar number of
ICEIS 2020 - 22nd International Conference on Enterprise Information Systems
610

events is detected in both devices, with the exception
of a few users that present higher discrepancy, aug-
menting the standard deviation and introducing bias.
Better results would be expected if both devices were
locally and synchronised in time, i.e. the data were
obtained in the same body localisation, and perfectly
timely synchronised. By an empirical observation of
the data, overall, we also highlight that the same mor-
phological trends were noticed in both devices’ data,
however, with magnitude offsets and time warping is-
sues. This can also explain some of the discrepancies
in results.
Data Loss Results.
In this subsection, we present
the results for the five experiments in the Data Loss
Protocol described in Section 3.2.
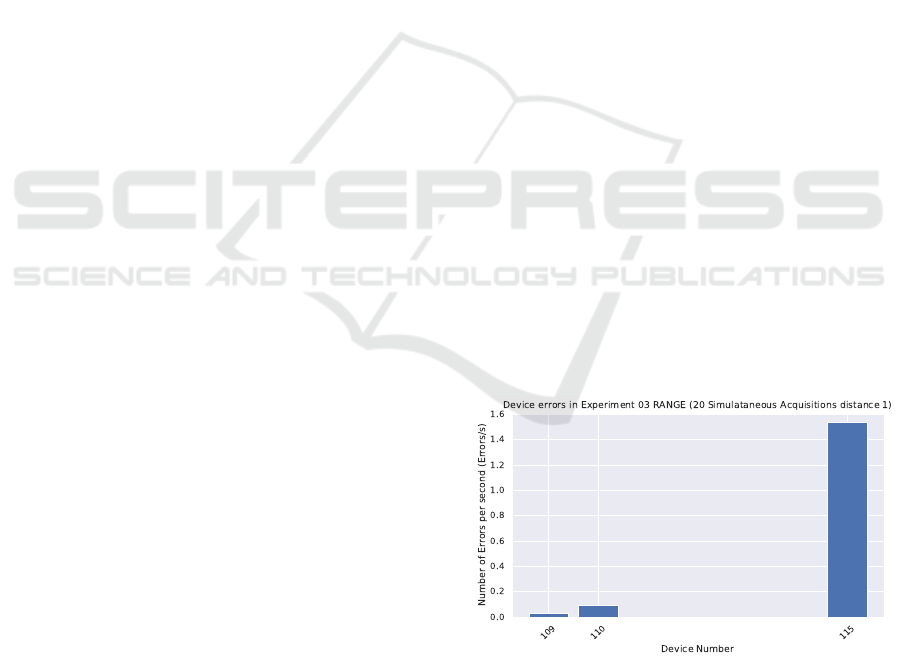
• Test 1 – 20 Devices in Simultaneous Acquisi-
tion.
The experimental results showed that only
devices 109 and 110 exhibited transmission errors.
The devices were placed in the same chair, close to
each other, so interference could have caused the
malfunctioning. Device 110 displays the higher
error rate, with a value of 0.12 errors/s, while de-
vice 109 presents an error rate of 0.01 errors/s;
the remaining devices (18 devices) returned no er-
rors. Additionally, a timeline view of the errors
shows that these were systematic; i.e. consistent
throughout the acquisition.
• Test 2 – 10 Devices in Simultaneous Acquisi-
tion.
During the second experiment, the error rate
of device 110 persisted with a similar value (ap-
proximately 0.12 errors/s). However, new devices
(107, 111), started to return errors. The device 109
displayed an error rate of 0.2 errors/s, while de-
vice 111 an error rate of around 0.1 errors/s. Once
again, the errors were consistent throughout the
experiment.
• Test 3 – 20 Devices at Different Ranges to the
Antenna.
The results for a distance between the
devices and the router of 270, 450, 630, and 900
cm are displayed in Figure 4 to Figure 11, in Ap-
pendix. In the timeline view of the errors, as for the
previous experiences, the error rate was consistent
throughout the acquisition protocol. At the first
distance (270 cm), closer to the antenna, devices
109 and 110, on the whole, maintained their error
rate. A new device, device 115, started to display
errors, with a high error rate (approximately 1.5 er-
rors/s). At the second distance iteration (450 cm),
the devices returning an error were maintained,
however, the error rate from each decreased. Next,
for the third distance iteration (630 cm), the num-
ber of devices displaying errors increased to 6. The
error rate in the devices showing errors at the previ-
ous iteration expanded significantly. At the fourth
distance iteration (900 cm), a higher number of de-
vices have shown data loss (9 devices) with error
rates from 0.1 to 1.3 errors/s.
• Test 4 – Occlusion.
In a 20-minute experience,
no errors were obtained. Consequently, we can
conclude that body occlusion did not increase the
number of the devices’ errors.
• Test 5 – Random Movement.
Only one device
displayed errors, with an error rate of 0.08 errors/s.
Once again, the errors were consistent throughout
the experiment.
To conclude, after analysing the five setup experiments,
the FMCI device shows suitability to be used in simul-
taneous collective acquisitions, showing acceptable
packet loss.
5 CONCLUSION
Recent advances in wearable technology and its pro-
liferation into people’s daily living lead to a diversity
of devices focused on the acquisition of physiological
data. Additionally, we have been observing a transfor-
mation in entertainment, bringing new challenges and
possibilities to media providers and content creators.
Physiological data, namely the EDA, can be used to
measure an audience response and provide meaning-
ful information for both the audience, the artist and
producers, paving the way for futuristic shows and
entertainment experiences, in both co-located or dis-
tributed setting. Still, there are few practical options
for simultaneous data acquisition (e.g. in an audience
setting).
In this work, we (1) Introduce a new wearable de-
vice for EDA sensing, the Xinhua Net FMCI device,
which expands the current state-of-the-art by allowing
collective, simultaneous acquisition of data; (2) Eval-
uate its performance against the BITalino device, a
reference and recognised system. In order to perform
this task, we follow two protocols: (1) Data Quality
Protocol – replicating a methodological experiment
based on a common state-of-the-art test to elicit the
SNS activity, namely the isometric handgrip test; (2)
Data Loss Protocol – examining the device packet loss
during five different setup conditions.
In both protocols, the devices showed high simi-
larity between the acquired data, and no significant
data loss was observed in a collective setting with
multiple devices acquiring data simultaneously and
synchronously. Therefore, we can conclude its applica-
bility for future research in collective data acquisition
A Wearable System for Electrodermal Activity Data Acquisition in Collective Experience Assessment
611
experiences.
Given the experimental results, we identified the
following research lines for further work: (1) Addi-
tion of further sensor modalities such as ECG, BVP
or HR; (2) Addition of a button or auxiliary channel
for synchronisation to further enhance the research
applicability; (3) Development of an online interface
for real-time visualisation of the data; (4) Data quality
index calculation, returning the usability/quality of the
data; (5) Increase of the sampling rate; (6) Application
of anonymization and data-privacy methodologies; (7)
Validation of the FMCI device over well-known data
and information-quality frameworks.
ACKNOWLEDGEMENTS
This work has been partially funded by the Xinhua
Net Future Media Convergence Institute under project
S-0003-LX-18, by the Ministry of Economy and Com-
petitiveness of the Spanish Government co-founded by
the ERDF (PhysComp project) under Grant TIN2017-
85409-P, and by IT - Instituto de Telecomunica
c¸
˜
oes
in the scope of program UIDB/50008/2020. The au-
thors would also like to thank to Carolina Bento for
the support to the experimental part of the work, and to
all the volunteers that participated in the Data Quality
Protocol.
REFERENCES
Abreu, M. (2020). A review of wearables and related de-
vices applicable to epilepstic seizure prediction via
peripheral measurements. Technical Report #IT-FMCI-
20190905, IT - Instituto de Telecomunicac¸
˜
oes.
Batista, D., da Silva, H. P., Fred, A., Moreira, C., Reis, M.,
and Ferreira, H. (2019). Benchmarking of the BITalino
biomedical toolkit against an established gold standard.
Healthcare Technology Letters, 6(1):32–36.
Bota, P. J., Wang, C., Fred, A. L. N., and Pl
´
acido Da Silva, H.
(2019). A review, current challenges, and future possi-
bilities on emotion recognition using machine learning
and physiological signals. IEEE Access, 7:140990–
141020.
Boucsein, W. (2012). Principles of Electrodermal Phenom-
ena, pages 1–86. Springer US, Boston, MA.
Costa, P. F., Rocha, M., Baptista, R., and Silva, H. (2019).
GripIT: A mobile isometric handgrip test for evaluation
of autonomic cardiovascular reflexes in non-clinical ap-
plications. In Int’l. Conf. of the IEEE Eng. in Medicine
and Biology Society.
Hilz, M. J. and D
¨
utsch, M. (2006). Quantitative studies of
autonomic function. Muscle & Nerve, 33(1):6–20.
Kirch, W. (2008). Pearson’s Correlation Coefficient, pages
1090–1091. Springer Netherlands, Dordrecht.
Kutt, K., Binek, W., Misiak, P., Nalepa, G., and Bobek, S.
(2018). Towards the development of sensor platform
for processing physiological data from wearable sen-
sors. In Int’l Conf. on Artificial Intelligence and Soft
Computing, pages 168–178.
Neill, S. P. and Hashemi, M. R. (2018). Ocean modelling for
resource characterization. In Neill, S. P. and Hashemi,
M. R., editors, Fundamentals of Ocean Renewable
Energy, pages 193 – 235. Academic Press.
Niels, R. (2004). Dynamic time warping: An intuitive way
of handwriting recognition?
Picard, R. W. (1997). Affective Computing. MIT Press,
Cambridge, MA, USA.
Poh, M., Loddenkemper, T., Swenson, N. C., Goyal, S.,
Madsen, J. R., and Picard, R. W. (2010). Continuous
monitoring of electrodermal activity during epileptic
seizures using a wearable sensor. In Int’l Conf. of the
IEEE Eng. in Medicine and Biology, pages 4415–4418.
Ross, S. M. (2010). Linear regression. In Ross, S. M., editor,
Introductory Statistics, pages 537 – 604. Academic
Press, Boston.
Schmidt, P., Reiss, A., D
¨
urichen, R., and Laerhoven, K. V.
(2019). Wearable-based affect recognition—a review.
Sensors, 19(19).
Shukla, J., Barreda-Angeles, M., Oliver, J., Nandi, G. C.,
and Puig, D. (2019). Feature extraction and selection
for emotion recognition from electrodermal activity.
IEEE Tran on Affective Computing, pages 1–1.
Wang, C. (2018). Monitoring the Engagement of Groups
by Using Physiological Sensors. PhD thesis, Vrije
Universiteit Amsterdam.
Zygmunt, A. and Stanczyk, J. (2010). Methods of evaluation
of autonomic nervous system function. Archives of
medical science : AMS, 6(1):11–18.
APPENDIX
Figure 4: Number of errors per device for Test 3 – 20 devices
in simultaneous acquisition at a 270 meter distance.
ICEIS 2020 - 22nd International Conference on Enterprise Information Systems
612
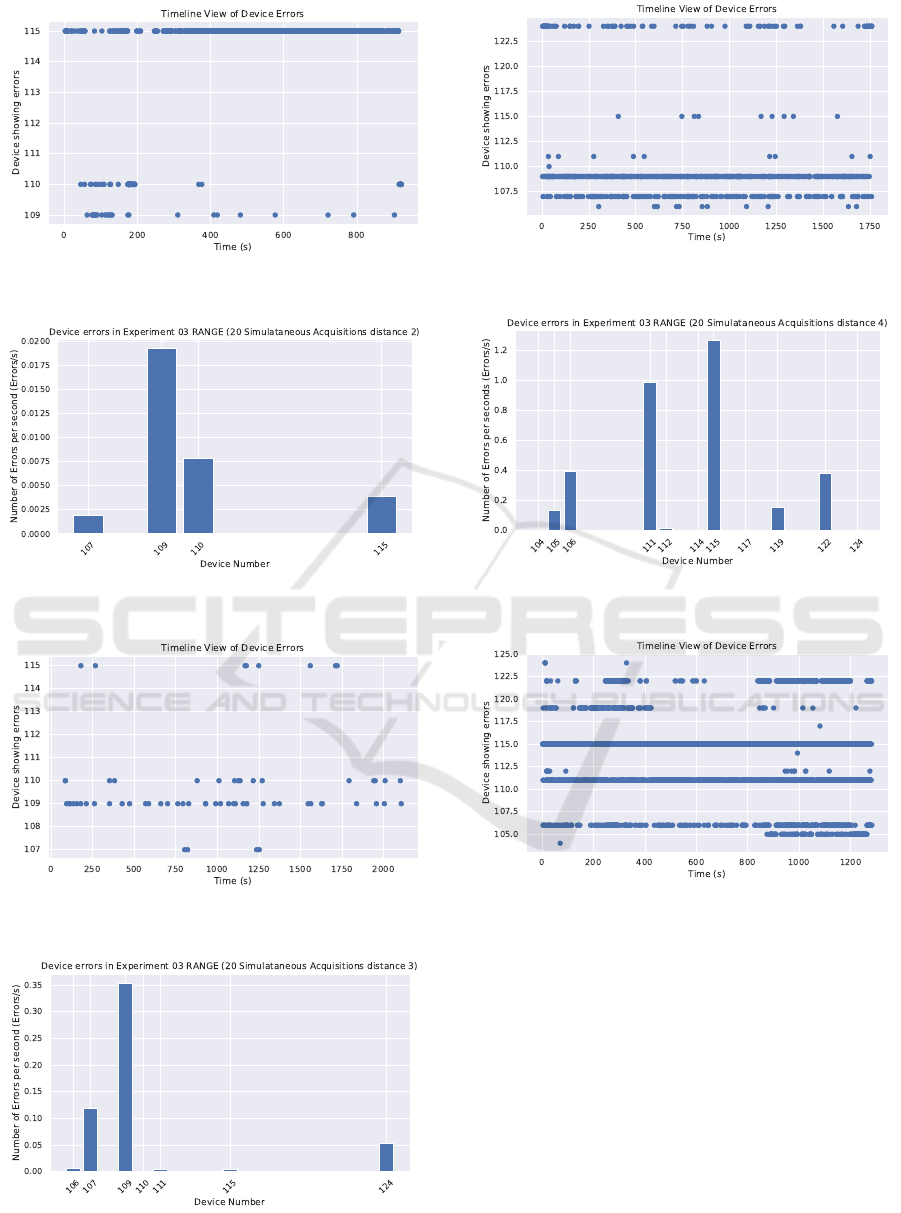
Figure 5: Timeline view of the devices’ errors for Test 3 – 20
devices in simultaneous acquisition at a 450 meter distance.
Figure 6: Number of errors per device for Test 3 – 20 devices
in simultaneous acquisition at a 270 meter distance.
Figure 7: Timeline view of the devices’ errors for Test 3 – 20
devices in simultaneous acquisition at a 450 meter distance.
Figure 8: Number of errors per device for Test 3 – 20 devices
in simultaneous acquisition at a 630 meter distance.
Figure 9: Timeline view of the devices’ errors for Test 3 – 20
devices in simultaneous acquisition at a 630 meter distance.
Figure 10: Number of errors per device for Test 3 – 20
devices in simultaneous acquisition at a 900 meter distance.
Figure 11: Timeline view of the devices’ errors for Test
3 – 20 devices in simultaneous acquisition at a 900 meter
distance.
A Wearable System for Electrodermal Activity Data Acquisition in Collective Experience Assessment
613
