
An Integrated Environmental Monitoring Approach through the
Development of Coal Mine, a GIS Open Source Application
L. Duarte
1,2 a
, A. C. Teodoro
1,2 b
, J. Fernandes
1,2
, P. Santos
1,2
and D. Flores
1,2 c
1
Institute of Earth Sciences, FCUP pole, Rua do Campo Alegre, Porto, Portugal
2
Department of Geosciences, Environment and Spatial Planning, FCUP, Porto, Portugal
Keywords: Coal Mine, Water Quality, Soils Analysis, Relational Database.
Abstract: Coal related fires may occur in un-mined outcrops, during coal mining, in abandoned mines, during storage
and transportation and in coal waste deposits. The self-burning of coal mobilizes large amounts of pollutants,
for instance, particulate matter, organic compounds and toxic trace elements that can be emitted, released or
leached to soils, waters and air of the surrounding environment. The S. Pedro da Cova (Porto, Portugal) coal
mine was exploited between 1795 and 1972 and had an important role on the economic development of the
region. Nowadays a waste pile of about 28,000 m2 is still deposited in the mine, suffering from self-
combustion since 2005. Geographical Information System (GIS) and spatial databases are frequently used for
monitoring this type of processes. The main objective of this work was to integrate, manipulate and combine
the spatial information obtained in the field with other datasets (geospatial and alphanumerical) in a GIS open
source application connected to a relational database (PostGIS), in order to monitor and assess environmental
conditions in the S. Pedro da Cova coal mine. This is an ongoing project where some campaigns were
conducted and some spatial information was obtained (thermal images, Digital Elevation Model) and also
water and soil samples.
1 INTRODUCTION
The S. Pedro da Cova coal mine was exploited
between 1795 and 1972 and had an important role on
the economic development of the region. Nowadays
a waste pile of about 28,000 m
2
is still deposited in
the mine, suffering from self-combustion since 2005.
These coal waste piles can be responsible for the
dissemination of pollutants through particulate matter
and gases by air and water. It is thereby crucial to
monitor the geochemical elements mobilization into
soils and water, as well as the combustion process
associated with the coal fires.
In this context, Geographical Information
Systems (GIS) and relational databases are frequently
used when the issue involves several data. For
instance, Chen and Li (2008) developed a WebGIS-
based decision support system that integrates spatial
information techniques and field survey data of a coal
mine waste. Also, Guo et al. (2016) created a
WebGIS system to perform the information
management of a coal mine. The Global Positioning
a
https://orcid.org/0000-0002-7537-6606
b
https://orcid.org/0000-0002-8043-6431
c
https://orcid.org/0000-0003-4631-7831
System (GPS) combining with GIS techniques have
also been used in this context. For instance, Mert and
Dag (2018) used GPS and GIS technologies focusing
in real-time monitoring of excavated coal quality.
Tama et al. (2018) used web-based GIS solutions
as cloud-based WebGIS application to track changes
in land surface of Miedzianka caused by historical
mining of metal ores. Lee and Park (2013) also
analysed the hazard to ground subsidence through a
decision trees approach in a GIS environment.
Several studies use the PostgreSQL-PostGIS
spatial database to manage different layers of
information based on an analytical hierarchy process
(Kumar et al., 2016; Kostecki, 2017; Díaz-Cuevas et
al., 2018; Liu et al., 2019; Obeidavi et al., 2019).
The QGIS, an open source GIS software, has been
already used in geology studies. For instance,
Choudhury and Arutchelvan (2016) used QGIS to
know the implementation of technology intended for
the development of Neyveli mine closure planning
system. Also, Tama and Malinowska (2018) used
QGIS and SAGA to analyse the water hazard caused
286
Duarte, L., Teodoro, A., Fernandes, J., Santos, P. and Flores, D.
An Integrated Environmental Monitoring Approach through the Development of Coal Mine, a GIS Open Source Application.
DOI: 10.5220/0009578402860293
In Proceedings of the 6th International Conference on Geographical Information Systems Theory, Applications and Management (GISTAM 2020), pages 286-293
ISBN: 978-989-758-425-1
Copyright
c
2020 by SCITEPRESS – Science and Technology Publications, Lda. All rights reserved
by ground deformations in the mining area of coal
mine Kopalnia Węgla Kamienneg (KWK) Morcine.
The main objective of this work was to integrate,
manipulate and combine the spatial information
obtained in the field with different datasets in a GIS
open source application connected to a relational
database, in order to monitor and assess
environmental conditions of the S. Pedro da Cova
coal mine. The development of this application
present several advantages in coal mining context,
automatizing the procedures to integrate and analyse
all the data acquired in the field, incorporating several
methodologies and updating the data acquired in the
field through a database created for that purpose.
These possibilities implemented in the GIS
application will improve time-efficiency and
automatize the procedures to study the coal mine.
Under this scope, a GIS open source application
(Coal Mine) and a PostGIS database were created and
connected in order to access the data.
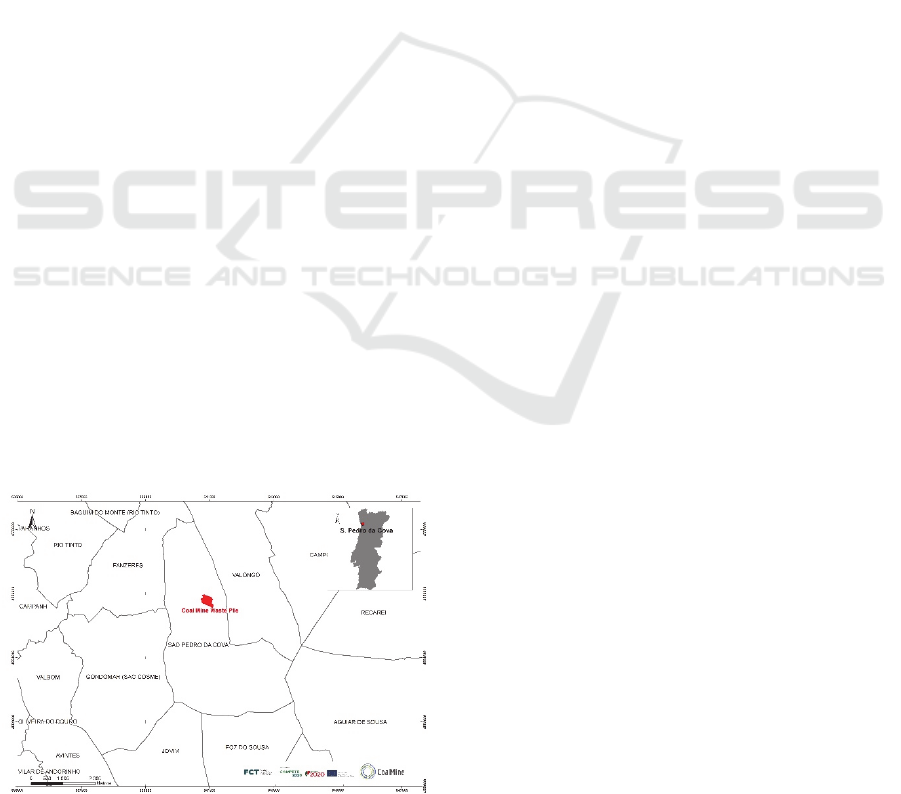
2 STUDY AREA
The study area is located approximately at 10 km east
of Porto (in S. Pedro da Cova, Gondomar), in
northern Portugal, and it is a part of the Douro
Coalfield that represents the most important coal-
bearing deposit in Portugal (Upper Pennsylvanian). It
has a NW–SE alignment, a variable width (30–250 m)
and approximately 53 km in length (Pinto de Jesus,
2001).
The study area is located along the border of the
Valongo Anticline western flank. Stratigraphically in
the study area, it is possible to identify different
metasedimentary formations with ages between the
Precambrian and / or Cambrian, Ordovician, Silurian,
Devonian and Carboniferous (Medeiros, 1980).
Figure 1 presents the study area.
Figure 1: Study area location.
Anthracite was mined in S. Pedro da Cova for
over 177 years, and, as result, a significant waste pile
emerges along the landscape, with near 450 meters
long, deposited along slope.
In 2001, wastes from the national steel industry
were deposited along the mine waste pile northern
border. These have been considered highly enriched
in Lead (Pb), Zinc (Zn) e Chromium (Cr), and for this
reason in 2014 the Portuguese Government started the
removal process of these wastes, nowadays is
estimated that 125.000 tonnes remain on site.
In 2005, after ignition caused by forest fires, a part
of the coal rich waste pile started to combust, and has
been burning, self-feeding, until the present days.
Presently the self-combustion seems confined to one
active focus, in the centre of the waste pile.
The study area is located along the western border
of a sensitive natural area, the Natura 2000 protection
area, and is contiguous to the population, which
enhances the environmental concerns.
2.1 Coal Mine Project
The CoalMine Project financed by the Portuguese
foundation for science and technology (FCT in
Portuguese) aims to characterize and quantify of the
impacts on surrounding environment ecosystems and
health of population living nearby S. Pedro da Cova
mine waste pile. The investigation of the impacts on
soil and water allows to identify organic and
inorganic elements that can potentially damage the
ecosystems and have negative impacts on human
health. This project comprises multiple datasets
referring to different periodic campaigns, that aims
characterize the geochemical composition of water
and soils in the vicinity of the old coal mine, and also
the surface temperature. The project also monitors
eventual landslide mass movements occurring in the
waste piles. The spatial distribution of contamination
and its extension are verified considering spatial
analyses and geo-statistical algorithms.
2.2 Data Acquisition
Two soil sampling campaigns were already
performed. The first was conducted in February 2019,
and the second was conducted in October 2019. The
soil samples of the sampling made in October are still
being processed, so will not be included in this work.
A total of 50 surface (0-20cm) soil samples were
collected over a regular mesh with approximately 100
m spacing between samples. The samples covered an
area of about 480 000 m
2
, exceeding the areas covered
by the coal mine waste pile as these had been subject
An Integrated Environmental Monitoring Approach through the Development of Coal Mine, a GIS Open Source Application
287
of previous studies (Ribeiro et al. 2010, 2011, 2012,
2015). The sampling was preferentially oriented NE-
SW according to the development of the main
drainage basin, southwest of the waste pile.
The geographic coordinates (in WGS84
coordinate system) of the sampling locations were
identified using a GPS receptor.
Regarding the water quality monitoring, a total of
5 sampling points were selected, 2 in Ribeira de
Silveirinhos (one upstream – A1 – and other
downstream – A4 – from the mine effluents
discharge), two points in mine drainage galleries (A2
and A3) and control point (A5) collected in a spring
without any influence of mine drainage. The
sampling plan defined for this work comprised 5
sampling campaigns at the 5 points mentioned,
collected on a quarterly periodicity in November
2018, February, May, September and December
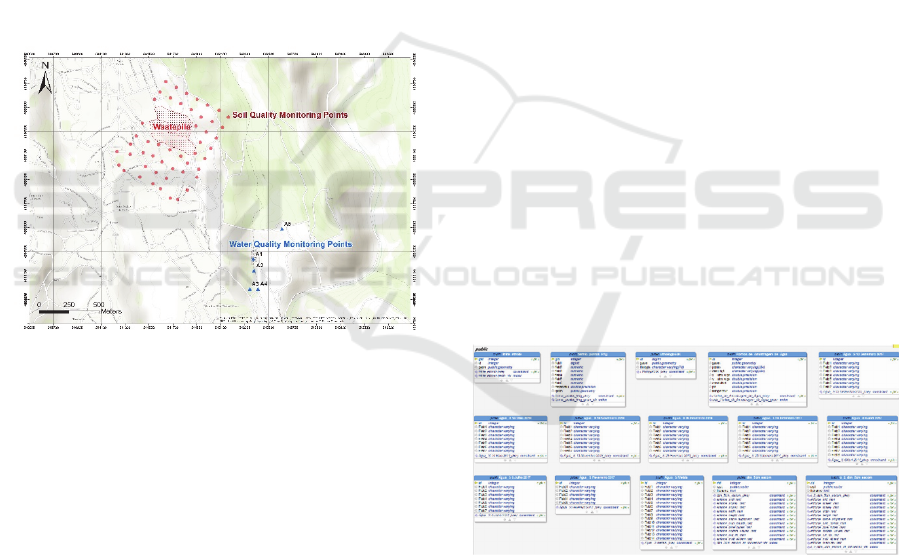
2019. Figure 2 presents the location of the soil and
water quality monitoring points.
Figure 2: Location of soil and water quality monitoring
points.
For the acquisition of the imagery data, 2
campaigns of flights considering an unmanned aerial
vehicle (UAV) were done. The first campaign
occurred on the 23 July 2019 and the second occurred
on the 30 December 2019. Each flight acquired data
from three different sensors, namely, a thermal
infrared (TIR) sensor, an RGB camera and a
multispectral sensor (blue, green, red, red edge and
near infrared bands).
3 METHODOLOGY
3.1 PostGIS Database
The data acquired was stored in PostGIS 3.0
relational database, which is an extension of
PostgreSQL 12.1 relational database manager. The
database was stored locally (PostGIS, 2020).
The vector data, in shapefile format, was imported
to the database using the PostGIS Shapefile
Import/Export Manager 3.0.0 functionality from
PostGIS 3.0 software (PostGIS, 2020). Consequently,
a connection was established between the database
and the QGIS 3.10 software. The Database Manager
tool from QGIS 3.10 software was used to insert in
the database the alphanumeric data, already existent
(in excel format). The raster data was imported to the
database through the raster2pgsql algorithm,
included in the PostGIS 3.0 software.
As a relational database, connections between
common elements must be assured, in order to reduce
the computational effort of the database. For tabular
data, this connection is established by the definition
of one or more columns, with unique values, as the
primary key and the definition, in a different table, of
the identical of columns with the same data as the
foreign key. The primary key uniquely identifies a
line within the table, while the foreign key constraints
a table to only the records that match the primary key
of another table, in the process referencing and
connecting the two tables (PostGIS, 2020). Figure 3
shows part of the different tabular data found in the
public schema of the database and the identification
of the columns and primary keys that compose it. This
includes data from water and soil analysis, metadata
of the raster files and the punctual temperature
measurements. The aforementioned process of
linking different tabular data is still ongoing, as the
data acquisitions and database optimization.
Figure 3: Tabular data of public schema of the database.
In the created database, every record is identified
with the number of the sample and the date in which
the sample was collected. A connection is, then,
established between the table where these records are
kept and the table where the location of each sample
number is stored, giving not only a temporal, but also
a spatial dimension to the stored data.
GISTAM 2020 - 6th International Conference on Geographical Information Systems Theory, Applications and Management
288
3.2 GIS Application
3.2.1 Coal Mine Implementation
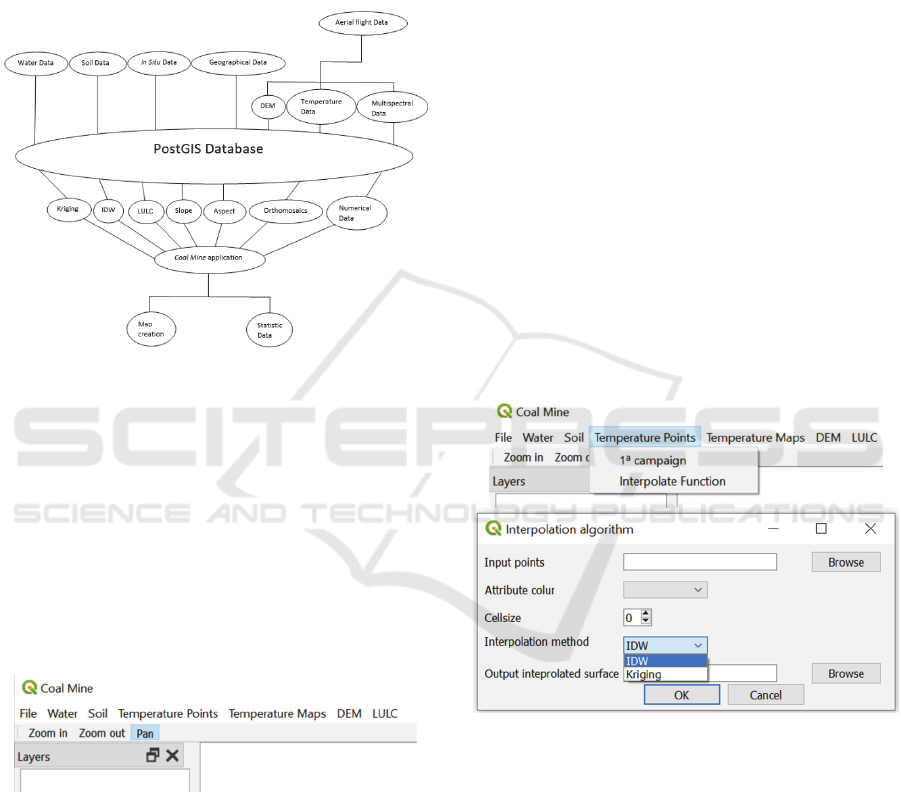
The figure 4 presents a diagram containing all the
procedures performed under this project, since the
PostGIS database and the Coal Mine application
development.
Figure 4: Diagram of Coal Mine application development.
The Coal Mine application was developed under
QGIS 3.10 software, using Python programming
language (QGIS, 2020). The graphic interface was
created based on the composition of Qt Designer
framework widgets (QGIS, 2020). Qt Designer is a
Qt tool which allows to design and build graphical
user interfaces (GUI) through QWidgets. The
windows and dialogs can be personalized in this
framework. The application was created as a toolbar
button. This button opens a main window built as a
QMainWindow class (Figure 5; Qt API, 2020).
Figure 5: Coal Mine application main window.
The main window is composed by 7 menus: File,
Water, Soil, Temperature Points, Temperature Maps,
Digital Elevation Model (DEM) and Land Use Land
Cover (LULC); basic and standard tools to
manipulate the maps such as Zoom in, Zoom out and
Pan; a table of contents named Layers and the canvas
where the layers are spatially presented (Figure 5).
The menu File allows to open vector or raster files
in the application canvas.
The Water and Soil menus connects to the
database where the information of water and soil are
saved and present options to open a specific campaign
(by date) chosen by the user.
The Temperature Points menu also connects to
the database and presents the temperature information
measured in the field) and provides a functionality
that incorporates Kriging algorithm and Inverse
Distance Weighting (IDW) in order to automatize the
procedure to create a continuous temperature surface
(Figure 6). This implementation was based on a
previous GIS application which allows to create
temperature interpolation maps using Kriging
algorithm (Duarte et al., 2017).
The IDW method was implemented based on
v.surf.idw algorithm from GRASS library (GRASS,
2020) and the kriging method was implemented based
on Ordinary Kriging algorithm from SAGA library
(SAGA, 2020).
In this GUI, 5 fields were created based on the
parameters of v.surf.idw algorithm: the field to input
the points, the field to choose the attribute with the
values to interpolate, the cell size of the final raster
surface, the interpolation method (IDW or Kriging),
and finally the field to the output surface (Figure 7).
Figure 6: GUI of Temperature Points menu.
The Temperature Maps menu allows to open, in
the canvas, the temperature maps already created.
These maps where created combining several
methods. The thermal imagery, acquired by the TIR
sensor, was aligned and juxtaposed using the Agisoft
Metashape 1.5.5 software (Agisoft, 2019). The
images were orthorectified, based on the DEM,
creating an orthomosaic of the surface temperatures.
Finally, the orthomosaic was clipped to the extent of
the coal mines’ waste pile using Clip raster with
polygon from SAGA library, (SAGA, 2020). This
menu is connected to the PostGIS database and opens
the temperature maps in raster format.
An Integrated Environmental Monitoring Approach through the Development of Coal Mine, a GIS Open Source Application
289
The DEM menu also provides two options: the
DEM generated in a specific campaign (generated
from UAV imagery) and the Terrain Analysis
functionality which allows to create slope and aspect
maps from DEM. The algorithm implemented,
r.slope.aspect belongs to GRASS library (GRASS,
2020). This GUI is composed by 3 fields: an input
field to DEM, and 2 output fields to slope and aspect,
respectively.
The LULC menu also connects to the database to
access the LULC map already created. The LULC
map was obtained based on K-Means Cluster
Analysis Operator 1.0 algorithm from SNAP 7.0
software (SNAP, 2019). Also, this menu provides a
functionality to derive the LULC using the K-Means
unsupervised classification method algorithm from
SAGA (SAGA, 2020). The GUI that allows to create
the classification is composed by 3 fields: an input
field, a spin box widget to define the number of
clusters and an output field.
All the data provided in this application is hosted
in the PostGIS database. The application connects
automatically to the database, filters the request and
allowed to access to the information.
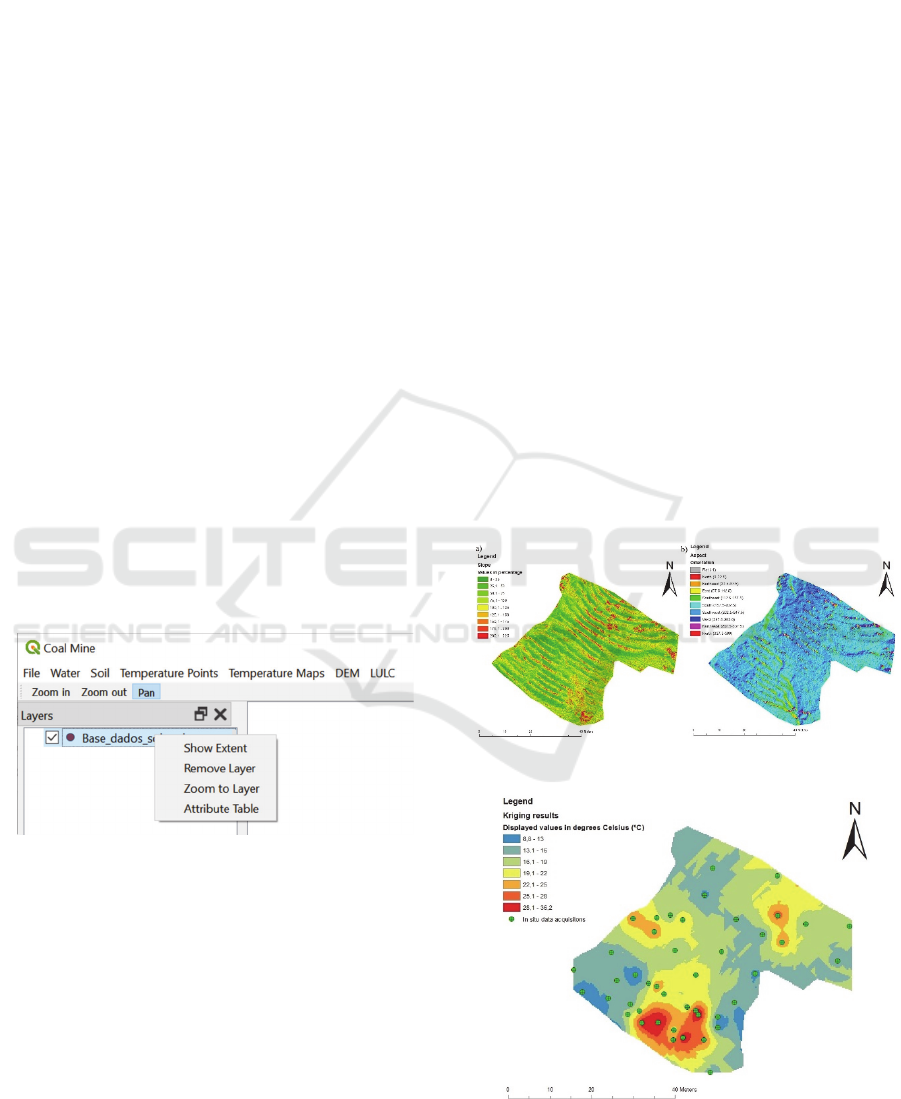
The table of contents also provides some
functionalities when a layer is opened, such as: Show
extent which provides the extent of the layer; Remove
layer which allows to remove the layer from canvas;
Zoom to Layer and access to the Attribute Table
(Figure 7).
Figure 7: Basic standard tools of table of contents.
In order to create the application canvas to
visualize the data, a QWidget was built in Qt Designer
and it was promoted to QgsMapCanvas.
3.2.2 PostGIS Connection
As explained in the previous section, the data
acquired in the field campaigns are available to
visualize and analyse in Coal Mine application. This
visualization is only possible through the connection
to a local PostGIS database where the data is hosted
(see section 3.1). The connection to the PostGIS
database under the application and using Python
functions were performed with the following code
lines:
uri = QgsDataSourceUri()
uri.setConnection("localhost", "5432",
"Database", "postgres", "postgres")
uri.setDataSource("public",
"distritos2", "geom", '', "gid")
db = QSqlDatabase.addDatabase("QPSQL");
db.setDatabaseName(uri.database())
db.setPort(int(uri.port()))
db.setUserName(uri.username())
db.setPassword(uri.password())
db.open()
4 RESULTS AND DISCUSSION
The application was tested with the data connected to
PostGIS database. This possibility allows to evaluate
and analyse multiple layers which are opened and can
be overlapped. Also, the new functionalities were
tested, and some results are showed, such as slope and
aspect maps (Figure 8), the interpolation of
temperature values using kriging algorithm (Figure 9)
and the LULC using K-Means algorithm (Figure 10).
Figure 8: Slope map (left) and aspect map (right).
Figure 9: LULC map.
GISTAM 2020 - 6th International Conference on Geographical Information Systems Theory, Applications and Management
290
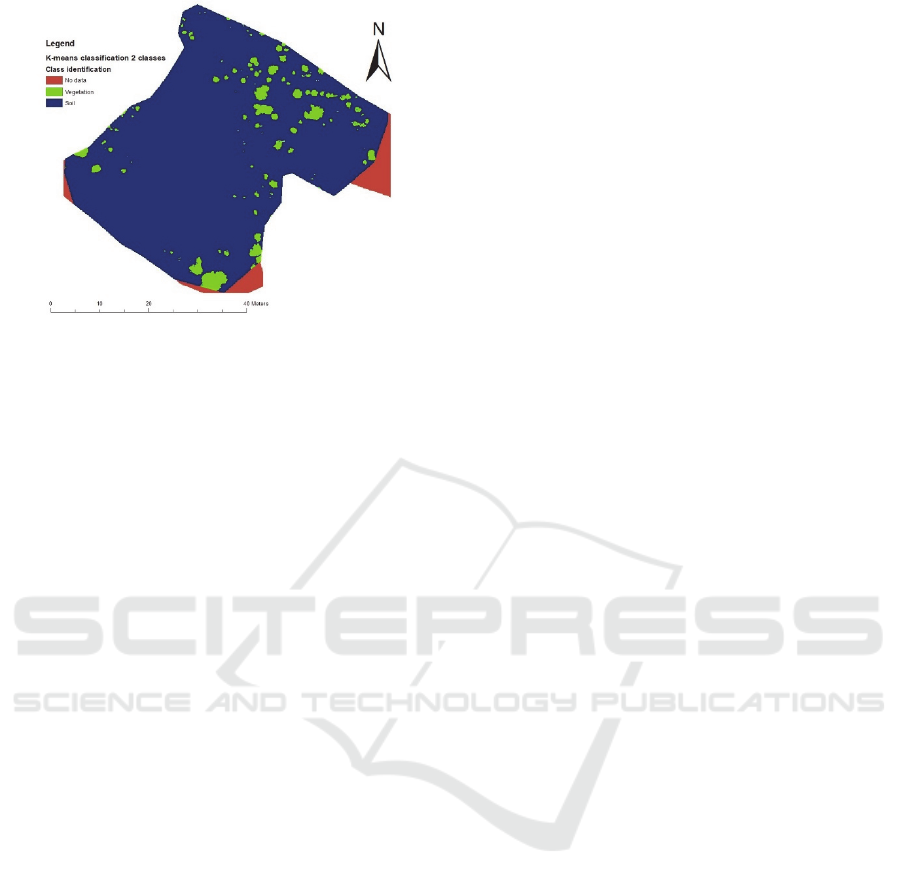
Figure 10: Unsupervised classification with 2 clusters
defined.
The developed application allowed to create
several maps such as: slope and aspect maps, LULC
map and temperature map. An analysis was
performed considering the referred variables. The
temperature values are independent of the slope
values. However, based on the aspect map, the waste
pile is facing a southerly direction, receiving direct
sunlight for most of the daylight. Despite this, the heat
dispersed on the surface by the sun cannot explain the
presence of the verified high temperatures. This
conclusion stems from the fact that the results
attained, so far, were very similar, despite the
significantly different conditions of both flights. One
campaign was conducted during summer and the
second during winter, under substantially different air
temperature conditions. The winter flight recorded a
maximum surface temperature of 50,9 ⁰C, while,
during the flight that took place in the summer the
highest surface temperature detected was 57,8 ⁰C. It
was also observed that high temperatures seem to be
a deterrent for vegetation growth, regarding the
LULC map and the temperature map. The areas with
the higher temperatures featured little or no
vegetation.
The development of Coal Mine application
present several advantages in coal mine
environmental monitoring context: i) it automatize
several procedures that allows to integrate and
analyse all the data acquired in the field; ii) it is
composed by several methodologies such as the
creation of interpolation surfaces for punctual data,
the creation of slope and aspect maps from DEM and
the automatic land cover classification through
unsupervised classification and; iii) to update the data
acquired in the field through the database. These
possibilities implemented in the GIS application will
improve time-efficiency and automatize the
procedures to study the coal mine environmental
legacy.
Given the periodic nature of these monitoring
campaigns, the Coal Mine application should help to
minimize the potential input errors, automatizing the
data procedures. The results will contribute to support
decision making.
5 CONCLUSIONS
The Coal Mine Project aims the characterization and
quantification of the impacts on surrounding
environment ecosystems and have negative impacts
on human health of population living nearby S. Pedro
da Cova mine waste pile. Under this project, the Coal
Mine application was created in a GIS open source
software in order storage all the data obtained in the
field and generates useful information. The
application allows to visualize, manipulate and create
relevant data. The Coal Mine application can be used
as a decision support tool to help to mitigate and
minimize the severe impacts in the environment
nearby S. Pedro da Cova. The main advantage of the
Coal Mine application is to improve and optimize the
manipulation of the data obtained in situ and using
geo-processing algorithms which will help in the
future to perform the management of the coal mine,
to improve the safety and the automatization of
several processes.
This is an ongoing project where some campaigns
were conducted and different spatial information was
obtained, such as water and soil samples in the field.
Through the UAV flights, several maps were also
obtained such as LULC maps and thermal images. A
lot of information has been collected until now and
with future campaigns this volume tends to grow, so
a spatial and open source database was crucial to
integrate all the data.
In the future, this application will incorporate
other functionalities to provide other maps such as
fire risk maps, groundwater vulnerability to pollution
maps and soil erosion maps. Also, it will provide the
possibility to perform statistical analysis providing
results in the format of histograms, plots and
variograms. The results will also allow the analysis of
the dynamics of the combustion process in the coal
waste pile as well as predict evolution scenarios. The
GIS application is free and open and available to any
user.
An Integrated Environmental Monitoring Approach through the Development of Coal Mine, a GIS Open Source Application
291

ACKNOWLEDGEMENTS
This work was funded through the Foundation for
Science and Technology, through the CoalMine
project with the ref. POCI-01-0145-FEDER-030138,
02-SAICT-2017 and by FEDER funding through the
COMPETE 2020 programme and framed within the
activities of the UIDB/04683/2020. ICT financed
through the European Regional Development Fund
(COMPETE 2020), with ref. POCI-01-0145-ERDF-
007690.
REFERENCES
Agisoft. Agisoft. 2020. https://www.agisoft.com/.
Accessed January 2020.
Chen, Y., Li, D., 2008. A Web-GIS based Decision Support
System for Revegetation in Coal Mine Waste Land. In
7
th
WSEAS Int. Conf. on Applied Computer & Applied
Computational Science (ACACOS '08), Hangzhou,
China, April 6-8.
Díaz-Cuevas, P., Camarillo-Naranjo, J.M., Pérez-
Alcántara, J.P., 2018. Relational spatial database and
multi‑criteria decision methods for selecting optimum
locations for photovoltaic power plants in the province
of Seville (southern Spain). Clean Technologies and
Environmental Policy, 20:1889–1902.
Duarte, L., Teodoro, A.C., Gonçalves, J.A., Ribeiro, J.,
Flores, D., Lopez-Gil, A., Dominguez-Lopez, A.,
Angulo-Vinuesa, X., Martin-Lopez, S., Gonzalez-
Herraez, M., 2017. Distributed Temperature
Measurement in a Self-Burning Coal Waste Pile
Through a GIS Open Source Desktop Application.
ISPRS Int. J. Geo-Inf., vol. 6, pp. 87, 2017.
GRASS. The world’s leading Free GIS software. 2020.
http://grass.osgeo.org/. Accessed January 2020.
Guo, X., Wang, R., Wu, Z., 2016. Research and Application
of WebGIS in Coal Mine Information Management
System. In 6th International Conference on Advanced
Design and Manufacturing Engineering (ICADME
2016).
Kostecki, R., 2018. Application of the Spatial Database for
Shoreline Change Analysis and Visualization: Example
from the Western Polish Coast, Southern Baltic Sea.
Quaestiones Geographicae 37(3).
Kumar, K., Ledoux, H., Stoter, J., 2016. Comparative
Analysis of Data Structures for Storing Massive Tins in
a DBMS. In The International Archives of the
Photogrammetry, Remote Sensing and Spatial
Information Sciences, Volume XLI-B2, 2016 XXIII
ISPRS Congress, 12–19 July 2016, Prague, Czech
Republic.
Lee, S., Park, I., 2013. Application of decision tree model
for the ground subsidence hazard mapping near
abandoned underground coal mines. Journal of
Environmental Management 127, 166-176.
Liu, X., Hao, L., Yang, W., 2019. BiGeo: A Foundational
PaaS Framework for Efficient Storage, Visualization,
Management, Analysis, Service, and Migration of
Geospatial Big Data—A Case Study of Sichuan
Province, China. ISPRS Int. J. Geo-Inf., 8, 449.
Medeiros, A., Pereira, E., Moreira, A., 1980. In Notícia
explicativa da folha 9-D (Penafiel) da Carta Geológica
de Portugal à escala 1:50 000. Serviços Geológicos de
Portugal, Lisboa, 47 pp.
Mert, B.A., Dag, A., 2018. Development of GPS and GIS-
Based Monitoring System for the Quality of Excavated
Coal. Acta Montanistica Slovaca Volume 23, number 1,
62-71.
Obeidavi, Z., Rangzan, K., Kabolizade, M., Mirzaei, R.,
2019. A web-based GIS system for wildlife species: a
case study from Khouzestan Province, Iran.
Environmental Science and Pollution Research (2019)
26:16026–16039.
Pinto de Jesus, A., 2001. A Génese e evolução da Bacia
Carbonífera do Douro (Estefaniano C inferior, NW de
Portugal); um modelo. Faculdade de Ciências da
Universidade do Porto, 232 pp.
PostGIS. Spatial and Geographic objects for PostgreSQL.
2020. http://postgis.net/. Accessed January 2020.
QGIS API. QGIS API Documentation. 2020.
http://www.qgis.org/api/. Accessed January 2020.
QGIS. QGIS Project. 2020. http://www.qgis.org/. Accessed
January 2020.
Qt API. Qt Documentation. 2020. https://doc.qt.io/qt-
5/reference-overview.html. Accessed January 2020.
Ribeiro, J., Ferreira da Silva, E., Flores D., 2010. Burning
of coal waste piles from Douro Coalfield (Portugal):
Petrological, geochemical and mineralogical
characterization. International Journal of Coal
Geology 81, 359-372.
Ribeiro, J., Ferreira da Silva, E., Pinto de Jesus, A., Flores,
D., 2011. Petrographic and geochemical
characterization of coal waste piles from Douro
Coalfield. International Journal of Coal Geology 87,
226-236.
Ribeiro, J., Silva, T.F., Mendonça Filho, J.G., Flores, D.,
2012. Polycyclic aromatic hydrocarbons (PAHs) in
burning and non-burning coal waste material. Journal
of Hazardous Materials 199-200, 105-110.
Ribeiro, J., Sant’Ovaia, H., Gomes, C., Ward, C., Flores,
D., 2015. Mineralogy and magnetic parameters of
materials resulting from mining and consumption of
coal from Douro Coalfield (NW Portugal). In: Stracher,
G. B., Prakash, A., Sokol E.V. (Eds.), Coal and Peat
Fires: A Global Perspective. Elsevier. Volume 3: Case
Studies - Coal Fires, pp. 493-507.
Roychoudhury, A., 2018. Mine Closure Planning Issues
and Strategies in Neyveli Mines by using Open Source
Software. International Journal of Engineering
Research & Technology (IJERT), Vol. 5 Issue 11.
SAGA. System for Automated Geoscientific Analyses.
2020. http://www.saga-gis.org/. Accessed January
2020.
SNAP. Sentinel Application Platform. 2020. https://step.
esa.int/main/toolboxes/snap/. Accessed January 2020.
GISTAM 2020 - 6th International Conference on Geographical Information Systems Theory, Applications and Management
292

Tama, A., Adamek, K., Pargiela, K., Ochalek, A.,
Krawczyk, A., Lupa, M., 2018. Monitoring of historical
land use changes caused by underground mining in
Miedzianka town, based on a WebGIS tool and inSAR
observations. JCEEA, t. XXXV, z. 65 (1/18), styczeń-
marzec 2018, s. 127-140, DOI:10.7862/rb.2018.14.
Tama, A., Malinowska, A., 2018. The Possibilities of Water
Hazard Managements in transformed Area with Open
Geographical Information System (QGIS). In: Baltic
Geodetic Congress (BGC-Geomatics 2018).
An Integrated Environmental Monitoring Approach through the Development of Coal Mine, a GIS Open Source Application
293
