
When to Collect What? Optimizing Data Load via Process-driven
Data Collection
Johannes Lipp
1,2 a
, Maximilian Rudack
3
, Uwe Vroomen
3
and Andreas B
¨
uhrig-Polaczek
3
1
Fraunhofer Institute for Applied Information Technology FIT, Schloss Birlinghoven, Sankt Augustin, Germany
2
Institute of Information Management in Mechanical Engineering, RWTH Aachen University, Aachen, Germany
3
Chair for Comprehensive Foundry Science and Foundry Institute, RWTH Aachen University, Aachen, Germany
Keywords:
Data Acquisition, Industry 4.0, Internet of Production, Semantics, Process Modeling.
Abstract:
Industry 4.0 and the Internet of Production lead to interconnected machines and an ever increasing amount of
available data. Due to resource limitations, mainly in network bandwidth, data scientists need to reduce the
data collected from machines. The amount of data can currently be reduced in breadth (number of values) or
depth (frequency/precision of values), which both reduce the quality of subsequent analysis.
In this paper, we propose an optimized data load via process-driven data collection. With our method, data
providers can (i) split their production process into phases, (ii) for each phase precisely define what data to
collect and how, and (iii) model transitions between phases via a data-driven method. This approach allows
a complete focus on a certain part of the available machine data during one process phase, and a completely
different focus in phases with different characteristics. Our preliminary results show a significant reduction of
the data load compared to less flexible interval- or event-based methods by 39%.
1 INTRODUCTION
Recent trends in Industry 4.0, Internet of Production
(Pennekamp et al., 2019) and similar research fields
lead to a massive interconnection between machines
and systems. Modern protocols such as OPC UA
(Hannelius et al., 2008) and MQTT (Stanford-Clark
and Hunkeler, 1999) enable flexible data collection
that is independent from manufacturer specifications.
Production machines often offer hundreds of nodes
via OPC UA, each representing a real-time machine
value or even a set of these (cf. Section 5). Common
data collection methods specify two details, namely
what to collect and how. The former is done by list-
ing all values of interest and the latter is achieved
by either fixed time intervals or subscriptions on data
changes. The integration of more and more produc-
tion machines leads to a significant amount of net-
work traffic, because detailed analyses of observed
processes require a fine granularity, and therefore
high frequency or precision, in the collected data. A
higher collection frequency linearly increases the data
load and quickly reaches the limitations of available
network and processing resources. However, the need
a
https://orcid.org/0000-0002-2639-1949
for high-frequency data often arises only for a certain
duration during a process cycle, while these measure-
ments are of reduced relevance during other process
stages. To the best of our knowledge, there do not
exist proper methods that change data collection rates
based on the currently observed production process.
In this paper, we propose both concept and imple-
mentation of a process-driven data collection that al-
lows machine operators to (i) split the digital shadow
of their production process into phases, (ii) for each
phase precisely define what data to collect and how,
and (iii) model transitions between phases via a data–
driven scheme. The resulting data collection follows
the actual information need instead of static rules and
thus reduces the amount of unnecessarily captured
data significantly.
The remainder of this paper is structured as fol-
lows. We describe a real-world use case that requires
flexible data collection in Section 2 and highlight re-
lated work in Section 3. Section 4 proposes our con-
cept for process phases and transitions between them,
followed by an implementation with preliminary re-
sults in Section 5. We conclude this work in Section 6.
220
Lipp, J., Rudack, M., Vroomen, U. and Bührig-Polaczek, A.
When to Collect What? Optimizing Data Load via Process-driven Data Collection.
DOI: 10.5220/0009439502200225
In Proceedings of the 22nd International Conference on Enterprise Information Systems (ICEIS 2020) - Volume 1, pages 220-225
ISBN: 978-989-758-423-7
Copyright
c
2020 by SCITEPRESS – Science and Technology Publications, Lda. All rights reserved

2 THE HPDC USE-CASE
The high pressure die casting (HPDC) process is
a discontinuous permanent mold based production
technology that is primarily used to cast light met-
als such as aluminum and magnesium alloys. One
process cycle typically lasts around 60 s for the pro-
duction of one casting and consists of multiple sub-
cycle phases in which the molten metal is injected into
a cavity (die), subsequently solidified and ejected as
a solid part afterwards. Parts made with the HPDC
process are frequently used for high volume automo-
tive applications including power train components,
such as transmission housings, but also crash-relevant
structural parts like shock towers.
A HPDC cell does not only include the HPDC ma-
chine itself, but also various auxiliary systems which
are used to enable a highly automated production sys-
tem which requires an adequate information network
(Rix et al., 2016). A common machine consists of the
shot end, which uses a hydraulic drive system to inject
molten metal into the cavity and to keep the metal un-
der high pressure during solidification. The machine
is supported by external cell components such as a
molten metal holding furnace, a ladle system to trans-
fer the metal to the machine, multiple oil- or water-
based thermal regulation units that deliver coolant to
the die, a vacuum system that evacuates the cavity
shortly before injection, and a spraying system to ap-
ply a release agent on the hot work steel surface of
the die. These auxiliary systems are used at differ-
ent points in time or sub-cycle phases of the over-
all cycle. Most sensors provide values continuously
throughout the cycle, one could gather all these values
simply by assigning a constant sampling rate indepen-
dent of the machine’s current state. The assignment
of this constant sampling rate does impose limitations
on the quality of the data acquisition. The overall cy-
cle duration and the times of the sub-cycle phases can
vary either due to adjustments to the process control
by the operator or production interruptions caused by
unstable process conditions. A constant sampling rate
over the full cycle limits the ability to differentiate
between sub-cycle phases. For this reason it is ben-
eficial to detect the transition from one sub-cycle to
the consecutive cycle phase, and to have the ability
to adjust sampling rates or to transmit the sampled
values only if the change of the absolute value is rel-
evant from an engineering stand point. For example,
the molten metal is dosed into a reservoir, referred to
as the shot chamber, and then injected by a plunger.
The plunger injection phase can be differentiated in
the slow shot and the fast shot. The dosing proce-
dure usually lasts around 4-7 s, the slow shot is in
the 750-1500 ms range and the fast shot which fills
the cavity typically lasts around 25-100 ms. Hori-
zontal real time controlled cold chamber HPDC ma-
chines have advanced PLCs and a hydraulic system
that enable the replication of these parameters. Due
to changes of the state of the machine (wear, aging
or losses of fluids, high operating temperatures) how-
ever irregularities and fluctuations can be introduced.
It is important to enable a clear reflection of these
changes within the data captured over time from the
machine. This can only be realized by a transition
from the constant acquisition approach to a more so-
phisticated, data-driven, approach, because sampling
rates without variable adjustments between sub-cycle
phases cannot achieve this objective. Improved detec-
tion and documentation of undesired state changes is
the first step towards continuous improvement of the
HPDC process.
3 RELATED WORK
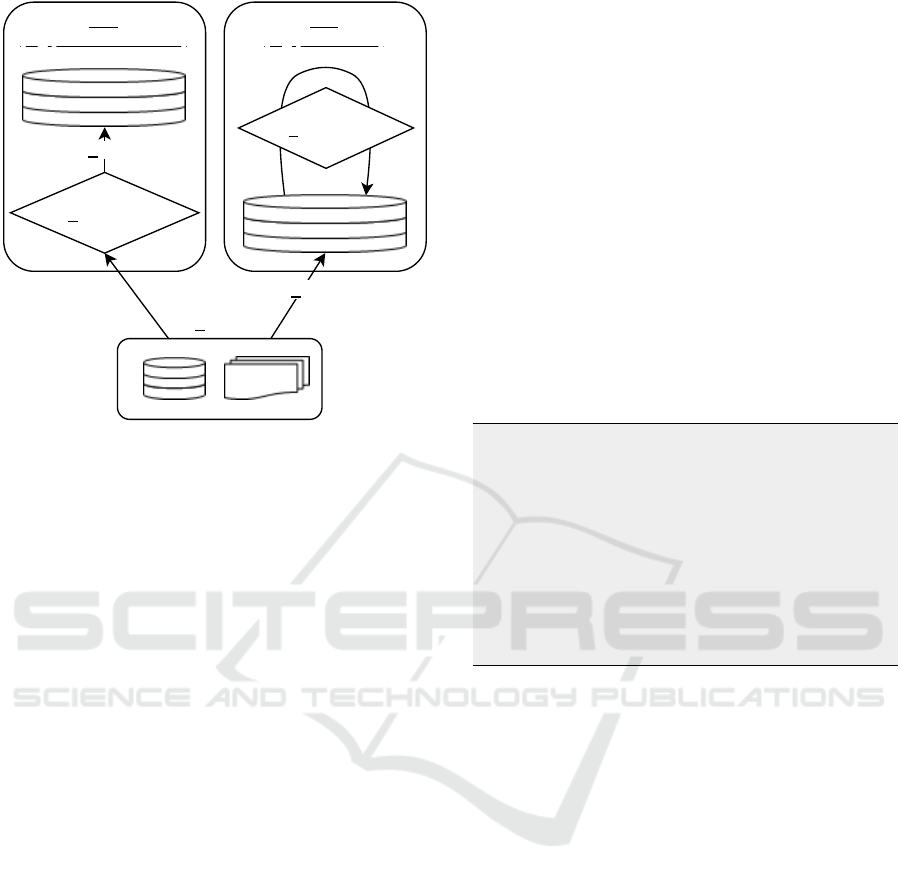
The context of this paper is shown in Figure 1, which
depicts the traditional extract-transform-load (ETL)
as well as the more modern extract-load-transform
(ELT) process. Solutions with relational data mod-
els, like data warehouses, first transform extracted
data into their designated schema and then load it
(Quix, 2003; Quix et al., 2016; Vassiliadis and Sim-
itsis, 2009). In contrast, data lakes and other NoSQL
systems make data quickly available by first loading it
and then in-place transforming it later in time (ELT).
The data collection approach we propose however
tackles the OPC UA data collection within the ex-
traction phase and thus is independent from the cho-
sen approach ETL or ELT, because either one starts
with the extraction (E). Therefore, we focus on related
work on the extraction phase, OPC UA in particular,
and skip the not directly related load and transform
steps in this section.
Common data collection systems using OPC UA
(Hannelius et al., 2008) either permanently read data
(polling) or use built-in subscription functionalities.
Polling is simple to implement as the client actively
reads data from the server, typically in fixed time in-
tervals. An example would be to collect a certain
temperature value every 2000 ms. Depending on the
actual value pattern, this approach can be very in-
efficient because of two reasons: It can miss value
changes if the polling interval does not hit them, or
it collects the same value over and over again for in-
frequently changing sensor values. The latter can be
tackled by decreasing the polling frequency, which
worsens the former, and vice versa.
When to Collect What? Optimizing Data Load via Process-driven Data Collection
221
Transform
Transform
Load
Load
ETL
(e.g., Data Warehouse)
ELT
(e.g., Data Lake)
Extract
Figure 1: Common data integration processes. Data ware-
houses typically implement relational models and transform
extracted data before loading it (ETL). NoSQL approaches
like data lakes load data directly after extraction and later
perform in-place transformations (ELT). Note that our ap-
proach improves the extraction phase and thus is indepen-
dent from the ETL/ELT process.
OPC UA provides a more elegant functionality in
OPC UA Part 1 (OPC Foundation, 2017a), called sub-
scriptions. A client can subscribe to a set of nodes
and let the server monitor them. The server trans-
mits updated values to the client, which solves both
disadvantages mentioned above. In order to avoid ex-
cessive updates for minor changes (e.g., far after the
decimal point), the client can control which changes
should be reported via filters introduced in OPC UA
Part 4 (OPC Foundation, 2017b).
An even more sophisticated functionality was
published in OPC OA Part 14 (OPC Foundation,
2018), called PubSub. It defines a publish subscribe
pattern which allows distributing data to any inter-
ested observer (client) inside a network. For this pa-
per, we could not evaluate the OPC UA PubSub fea-
ture in a real-world scenario, because available ma-
chine manufactures did not implement the defined
standard in their products yet. We will include this
in future research as soon as it becomes more promi-
nent in production.
The subscriptions available in OPC UA serve well
in controlling what data to collect when, but do not
support flexible adoptions based on the current state
of the production process. Updating the subscrip-
tions in order to minimize the data load and pre-
processing effort further remains at the client and is
not yet solved properly.
4 PROCESS PHASES APPROACH
This section describes our concept of modeling pro-
cess phases, transitions between them, phase-based
data collection, start/end conditions and their syntax.
Listing 1 shows an extract of the general structure,
which we present in detail below. The approach fol-
lows the assumption that we can split any process
into phases. A process phase describes conditions
for it to start/end, transitions to/from other process
phases, and what parts of available information is of
interest during that phase. A process as whole starts
with one or more phases and either has a finite phase
or is cyclic. We present details of our implementa-
tion in Java using OPC UA, which is still undergoing
changes and will be released as open source for the
research community soon.
" pha s es " : [
{
" n a me ": " Phas e 1 " ,
" wh at T o C o l le ct " : [ ... ] ,
" ho wT oC o l l e c t " : [ . . . ] ,
" st a r t C o nd i t i on s " : [ ... ] ,
" en dC o n d i t io ns " : [ ... ]
},
[ ... ]
]
Listing 1: JSON extract showing the general structure of
process phases. Each phase consists of a name, what to
collect and how during that phase, and start/end conditions.
4.1 Process Phases
Process phases represent phases of the observed pro-
duction process, and they can be active in parallel, in
sequence or independent of each other. The level of
precision of the process phases depends on the view
of the data scientist, and thus can be specified. A pro-
cess phase includes:
1. a name and/or description,
2. a list with data of interest (what),
3. rules for acquiring the data (how),
4. a start condition, and
5. an end condition.
Start and end conditions in our current implementa-
tion cover the observation of values (boolean, integer,
double etc.) via polling or subscriptions.
ICEIS 2020 - 22nd International Conference on Enterprise Information Systems
222
4.2 Phase-driven Data Collection
Phase-driven data collection defines a strategy of what
data to acquire while a particular phase is active and
how to do so. In our implementation, what to collect
is represented by a list of OPC UA node ids. Note
that our approach is not limited to OPC UA, but could
be extended to also support other data sources like
databases. We currently support three different data
acquisition rules, which follow the related work pre-
sented in Section 3:
1. interval-based (polling): Read values based on a
fixed time interval, e.g. 500 ms,
2. subscription-based (absolute): The current value
is fixed and data collection is triggered whenever
the current value exceeds the given absolute dead-
band value, e.g. when the temperature changes by
more than 2 degrees Celsius,
3. subscription-based (relative): Same rule as for ab-
solute, but the change calculation is relative in-
stead of absolute.
These rules could easily be extended by more flexible
or complex rules, or even a combination of these.
4.3 Transitions
Besides the start and end conditions based on values,
we allow triggering a phase start based on the state
of other phases, i.e. start a phase once another phase
ends. With combinations of these rules, it is possible
to traverse through all phases linearly, but also to have
phases running in parallel. A possible extension could
include more complex rules (cf. to a process diagram
or a Petri net (Peterson, 1977)), to model rules like
”start phase k once phases l,m and n have ended”.
5 PRELIMINARY RESULTS
This section presents preliminary results of our ap-
proach. We model process phases including the
above-mentioned required details for a use-case at the
Foundry Institute of the RWTH Aachen University.
This HPDC use-case is described in detail in Section 2
and the machine offers data via an OPC UA server,
which we collect in the process phases as depicted in
Figure 2 using our approach proposed in Section 4
and finally discuss preliminary benefits.
5.1 Setup
We use a horizontal cold chamber HPDC machine (cf.
Section 2) with an embedded OPC UA server, which
we access via an Ethernet cable. A Java-based client
installed on an edge device connects to the machine
using OPC UA, and is capable of collecting, process-
ing and storing collected data. We create a config for
process-driven data collection (cf. Section 4) and load
it on the edge device. At the edge device, we perform
precise measurements during one work shift to com-
pare our approach with a fixed collection baseline.
5.2 HPDC Process Phases
We analyzed the HPDC process and identified re-
quirements for data collection, to enable a reduced
data load during times in which high sampling rates
are not necessary on a specific machine. The resulting
process phases including their transitions are depicted
in Figure 2, and divide the HPDC process in five pro-
cess phases. The collection intervals and other corre-
sponding practical steps are shown as a JSON config
in Listing 2.
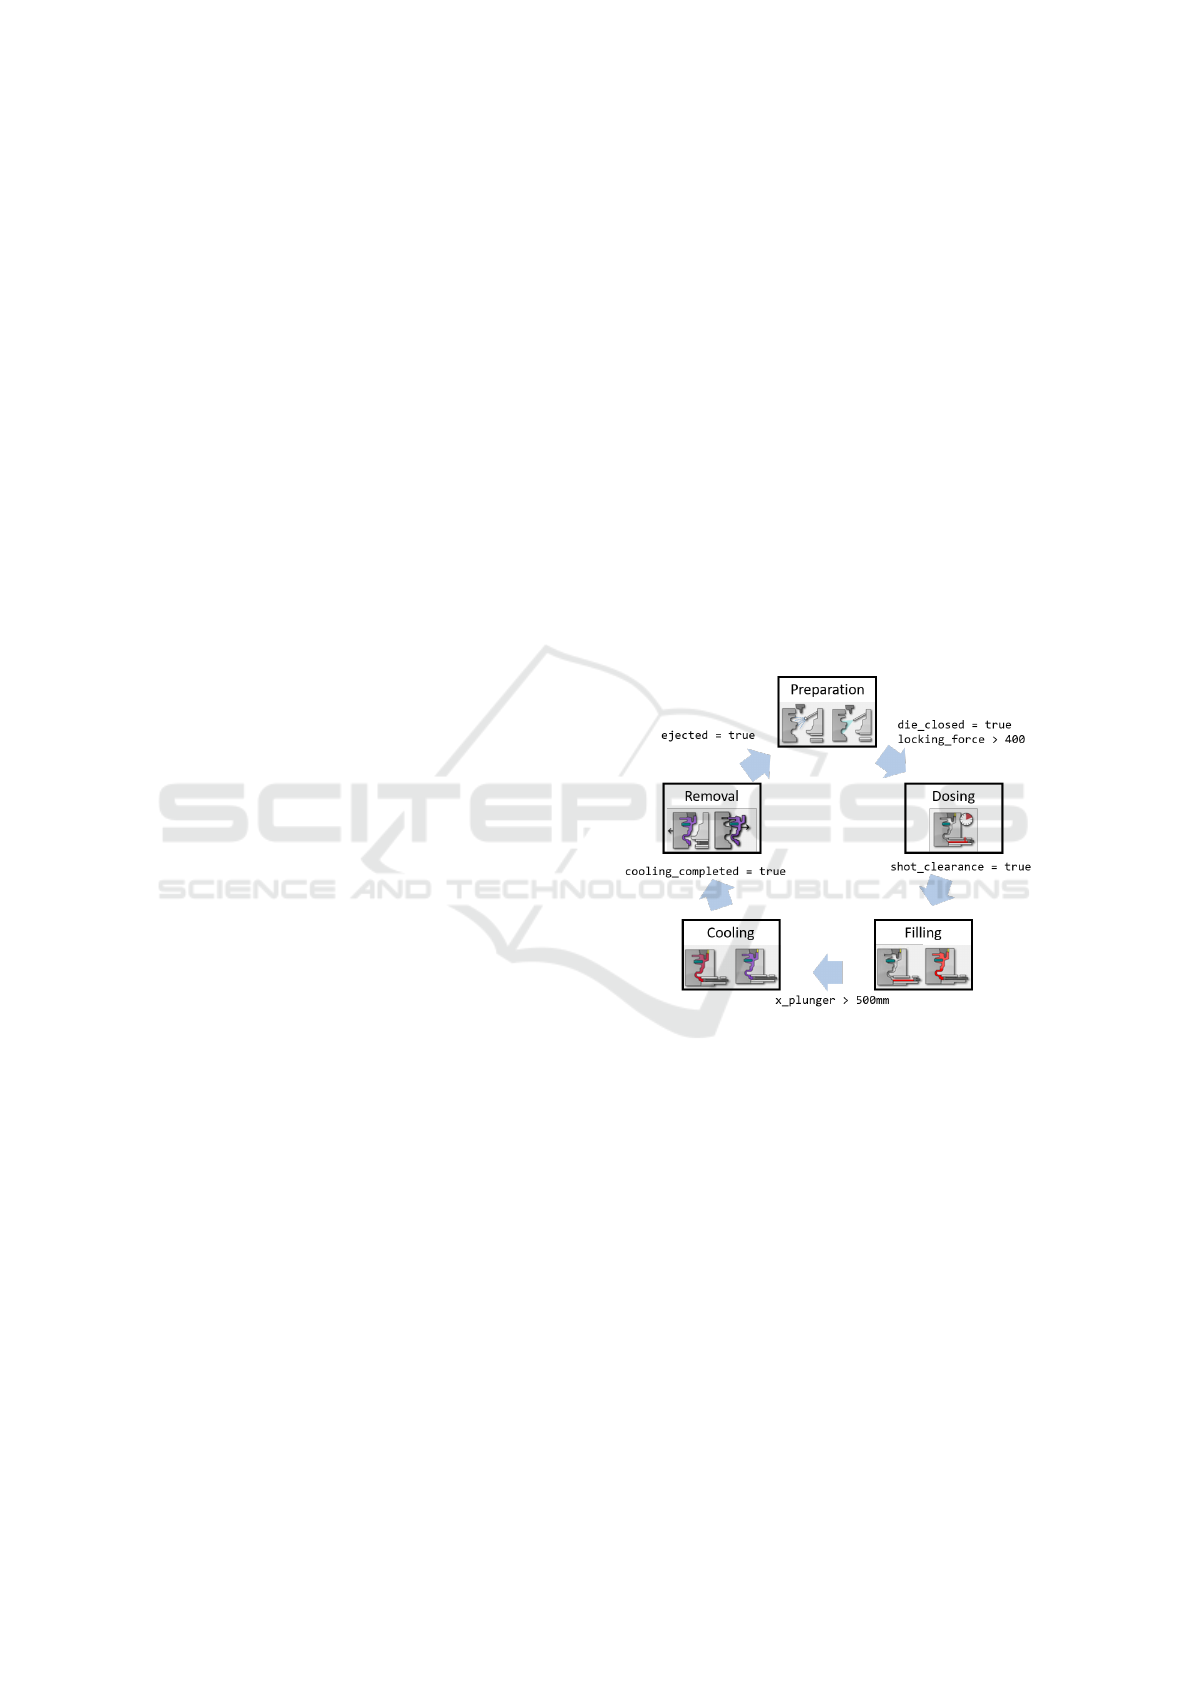
Figure 2: The five process phases for HPDC and their tran-
sition conditions as discussed with HPDC process owner.
The process starts with preparation of the machine, which
is followed by dosing and filling. After cooling, the work-
piece is removed and the process starts over. Images are
extracted from Magmasoft (MAGMA Gießereitechnologie
GmbH, 2019).
Preparation of the machine is the initial process phase,
which affects some parts of the HPDC cell while other
components are idle. A low data collection frequency
of 4000 ms for certain temperature values is sufficient
(cf. Listing 2). Note that the list of nodes to col-
lect in this use-case focuses on temperature values,
whose OPC UA identifiers we omit for better read-
ability. The preparation phase has two end conditions,
namely a closed die as well as an applied locking
force of at least 400 tons. The dosing phase specifies
a significantly smaller collection interval of 200 ms
When to Collect What? Optimizing Data Load via Process-driven Data Collection
223

" pha s es " : [
{
" n a me ": " Pr ep a r a t i o n " ,
" wh at T o C o l le ct " : [ ... ] ,
" ho wT oC o l l e c t " : { i n te rv al : 4 0 0 0 },
" st a r t C o nd i t i on s " :
[ PH A S E _E ND : " Rem ov a l " ] ,
" en dC o n d i t io ns " :
[ di e _ c l o s e d = t rue ,
lo c ki n g_ f or ce > 4 0 0 ]
},
" n a me ": " Dos ing " ,
" wh at T o C o l le ct " : [ ... ] ,
" ho wT oC o l l e c t " : { i n te rv al : 2 0 0 },
" st a r t C o nd i t i on s " :
[ PH A S E _E ND : " Pr ep ar at io n " ] ,
" en dC o n d i t io ns " :
[ sh ot _ c l ea ra n c e = true ]
},
" n a me ": " Fi l li ng " ,
" wh at T o C o l le ct " : [ ... ] ,
" ho wT oC o l l e c t " : { i n te rv al : 2 0 0 },
" st a r t C o nd i t i on s " :
[ PH A S E _E ND : " Dos i ng " ] ,
" en dC o n d i t io ns " :
[ x _plu n ger > 5 0 0 ]
},
" n a me ": " Co o li ng " ,
" wh at T o C o l le ct " : [ ... ] ,
" ho wT oC o l l e c t " : { i n te rv al : 2 0 0 },
" st a r t C o nd i t i on s " :
[ PH A S E _E ND : " Fil li n g " ] ,
" en dC o n d i t io ns " :
[ co o l i ng _ c o mp l e t ed = true ]
},
" n a me ": " Re m ov al " ,
" wh at T o C o l le ct " : [ ... ] ,
" ho wT oC o l l e c t " : { i n te rv al : 4 0 0 0 },
" st a r t C o nd i t i on s " :
[ PH A S E _E ND : " Coo li n g " ] ,
" en dC o n d i t io ns " :
[ eje ct e d = t r u e ]
},
]
Listing 2: Config defining the five process phases depicted
in Figure 2 and their transitions. In this use-case, the
collection intervals range from 200 to 4000 ms, which is
a factor 20. Note that the preparation phase also follows the
removal and thus constructs a cyclic execution. We omit
the list of OPC UA node ids in whatToCollect for better
readability.
and ends as soon as the shot clearance in the ma-
chine is fulfilled and set. This high data collection
frequency is held throughout the next two phases fill-
ing and cooling. A transition from filling to cooling
happens as soon as the plunger closes in on its ter-
minal position after cavity filling (x plunger > 500).
The HPDC machine sets a flag, defined by the oper-
ator, when the cooling is completed, which triggers
the removal phase to start. After cast part ejection,
the process starts over with the preparation phase. We
achieve this functionality by adding an additional start
condition to the preparation phase (cf. Listing 2).
5.3 Results
Our preliminary results are based on measurements
during the experiments described above. The goal is
to investigate the total amount of data that needs to
be processed and forwarded by the edge device. We
ignore infrequent OPC UA control messages and fo-
cus on the data flow itself instead. Table 1 on the
next page gives an overview of the average duration
of each process phase. While the filling phase is short
(1.2 s), the dosing takes 6.5 s and removal, prepara-
tion and cooling take much longer on average. The
collection intervals are not part of measurements, but
were defined by HPDC process owner in Section 5.2.
Preparation and removal only require one data value
every 4000 ms, while the phases dosing, filling and
cooling demand an interval of 200 ms.
The data collection baseline with a fixed interval
allows to specify one interval for the entire process.
Since it is crucial to meet the requirements at any
time, the smallest interval of 200 ms must be selected.
The average cumulative cycle time for the observed
HPDC process is the sum of all averages in Table 1,
which is 54.7 s in the case of a regular cycle. Keeping
up the data collection interval of 200 ms leads to 238
(rounded up) data messages throughout one process
cycle.
Our proposed process-driven data collection flex-
ibly changes the collection interval to perfectly meet
the required intervals in each phase. That leads to (all
rounded up) 4 messages for the preparation phase, 33
for dosing, 6 for filling, 100 for cooling and 3 for re-
moval. This is a total of 146 messages for one process
cycle, which is about 61% of the baseline and thus
saves about 39% bandwidth.
6 CONCLUSION AND OUTLOOK
In this paper, we proposed a process-driven data col-
lection that optimizes the data load by flexibly adapt-
ICEIS 2020 - 22nd International Conference on Enterprise Information Systems
224

Table 1: The average duration of each process phase during our experiments altogether with the respective data collection
intervals for a specific thermocouple in the HPDC die were specified together with the HPDC process owner.
Preparation Dosing Filling Cooling Removal
Average duration 15 s 6.5 s 1.2 s 20 s 12 s
Collection interval 4000 ms 200 ms 200 ms 200 ms 4000 ms
ing collection frequencies. Process experts split their
production process into phases and for each phase de-
fine (i) what data to collect, (ii) how to collect the
data (e.g., interval), and (iii) transitions to and from
other phases. Our implementation uses an edge de-
vice with a Java client, which connects to a produc-
tion machine via the widely supported OPC UA pro-
tocol and controls data collection based on a config
file with the above-mentioned process-driven details.
Experiments in a real high-pressure die casting use-
case show that our approach reduces the data load
compared to a fixed-interval baseline by 39%.
Our approach is an important step towards sup-
porting the ever growing number of interconnected
production devices in the Internet of Production,
where simple ”collect, then analyse” solutions will
not be sufficient. It is particularly strong in scenarios
where even small changes during the process have ex-
tensive effects. Using the knowledge from experts, it
focuses the data collection on important parts (phases)
of the process and thus reduces the overall data load.
Our experiments only cover one practical use-
case and do not even demonstrate all benefits of our
process-driven approach. We analyzed the optimiza-
tion ”collection intervals”, but did not cover other op-
tions like (i) control what data to collect (i.e., ignore
values that are not relevant for a phase), (ii) more so-
phisticated collection methods, and (iii) more com-
plex transitions to and from other phases. With proper
combinations of available optimizations, we believe
to further optimize the data load significantly.
As future work, we will evaluate more complex
use-cases to demonstrate our approach’s benefits bet-
ter and further optimize the data load. We also plan
more precise measurements as well as publishing our
implementation open-source for the community.
ACKNOWLEDGEMENTS
Funded by the Deutsche Forschungsgemeinschaft
(DFG, German Research Foundation) under Ger-
many’s Excellence Strategy – EXC-2023 Internet of
Production – 390621612.
REFERENCES
Hannelius, T., Salmenpera, M., and Kuikka, S. (2008).
Roadmap to adopting OPC UA. In 2008 6th IEEE
International Conference on Industrial Informatics,
pages 756–761. IEEE.
MAGMA Gießereitechnologie GmbH (2019). MAG-
MASOFT Autonomous Engineering. https://www.
magmasoft.com/en/solutions/magmasoft/. [Accessed
02.02.2020].
OPC Foundation (2017a). OPC UA Part 1: Overview and
Concepts. https://reference.opcfoundation.org/v104/
Core/docs/Part1/. [Accessed 06.12.2019].
OPC Foundation (2017b). OPC UA Part 4: Ser-
vices. https://reference.opcfoundation.org/v104/Core/
docs/Part4/. [Accessed 06.12.2019].
OPC Foundation (2018). OPC UA Part 14: Pub-
Sub. https://reference.opcfoundation.org/v104/Core/
docs/Part14/. [Accessed 06.12.2019].
Pennekamp, J., Glebke, R., Henze, M., Meisen, T., Quix,
C., Hai, R., Gleim, L., Niemietz, P., Rudack, M.,
Knape, S., Epple, A., Trauth, D., Vroomen, U., Bergs,
T., Brecher, C., B
¨
uhrig-Polaczek, A., Jarke, M., and
Wehrle, K. (2019). Towards an Infrastructure En-
abling the Internet of Production. In 2019 IEEE In-
ternational Conference on Industrial Cyber Physical
Systems (ICPS), pages 31–37.
Peterson, J. L. (1977). Petri nets. ACM Computing Surveys
(CSUR), 9(3):223–252.
Quix, C. (2003). Metadata Management for Quality-
Oriented Information Logistics in Data Warehouse
Systems. PhD thesis, RWTH Aachen University.
Quix, C., Hai, R., and Vatov, I. (2016). Metadata extraction
and management in data lakes with gemms. Complex
Systems Informatics and Modeling Quarterly, (9).
Rix, M., Kujat, B., Meisen, T., and Jeschke, S. (2016). An
agile information processing framework for high pres-
sure die casting applications in modern manufacturing
systems. Procedia CIRP, 41:1084–1089.
Stanford-Clark, A. and Hunkeler, U. (1999). MQ Teleme-
try Transport (MQTT). http://mqtt.org/. [Accessed
06.12.2019].
Vassiliadis, P. and Simitsis, A. (2009). Extraction, transfor-
mation, and loading. Encyclopedia of Database Sys-
tems, 10.
When to Collect What? Optimizing Data Load via Process-driven Data Collection
225
