
Opinions regarding Virtual Reality among Older People in Taiwan
Diana Barsasella
1,2,3 a
, Shwetambara Malwade
1
, Chia-Chi Chang
4,5
, Megan F. Liu
4
, Sruthi Srikanth
6
,
Ajith Kumar Panja
7
, Yu-Chuan Jack Li
1
and Shabbir Syed-Abdul
1,2
1
International Center for Health Information Technology, Taipei Medical University, Taipei, Taiwan
2
Graduate Institute of Biomedical Informatics, Taipei Medical University, Taipei, Taiwan
3
Health Polytechnic of Health Ministry Tasikmalaya, Tasikmalaya, West Java, Indonesia
4
School of Gerontology Health Management, College of Nursing, Taipei Medical University, Taipei, Taiwan
5
College of Interdisciplinary Studies, Taipei Medical University, Taipei, Taiwan
6
Department of Biomedical Engineering, College of Engineering, Guindy, Anna University, Chennai, India
7
Department of Computer Science and Engineering, College of Engineering, Guindy, Anna University, Chennai, India
ajithkumarpanja@gmail.com, {jack, drshabbir}@tmu.edu.tw
Keywords: Elderly People, Virtual Reality, Technology Acceptance Model, Opinion.
Abstract: In recent years, older population aged 60 years and above has been increasing from 900 million in 2015 into
2 billion by 2050. With advancing age, older people experience decreasing social activities, decreased
physical activities, issues related to mental health, disturbed sleep and overall poor quality of life. Virtual
reality has shown applications in healthcare domain to help mitigate these problems. The aim of our study
aim is to investigate the opinions of older population about virtual reality through dimensions of technology
acceptance model. We used the data generated in our previously published research to measure the opinions
of older population toward VR use. Thirty participants of older age group were involved in this study (twenty-
four females and 6 males) from March to May 2018. They were exposed to 12 sessions of VR experiences
for 15 minutes each, twice a week for 6 weeks. Kaiser-Meyer-Olkin measure of sampling adequacy and
Bartlett's Test were conducted to test the reliability of each questions. From Likert scale analysis, positive
opinions (more than 70%) were seen towards the use of VR for entertainment, raising mood, attractiveness
and fun to use VR. While the highest choice showing negative opinions in the difficulty of learning to use VR
(33.3%). Our study indicates the opinion of older population that they showed positive opinions for all of the
TAM variables, the index being 72% to 78.44%. The perceived VR as enjoyable to use, but they still needed
time to be skillful in using it. Our study showed that providing training and ease of use is an essential element
while introducing VR among older adults.
1 INTRODUCTION
Older population aged 60 years and above has been
increasing in number from 900 million in 2015 into 2
billion by 2050. Nowadays, the number of older
people aged 80 years or older has reached 125 million
(WHO, 2018). By 2030, older age group of Taiwan
population will be 24% (Council ND, 2016).
As people grow older, they are prone to
experience a decline in social activities. The issue has
a higher impact among older adults staying in long-
term care communities. They are often structurally
and socially isolated. Moreover, older adults in long-
a
https://orcid.org/0000-0002-6063-7711
term care communities are affected by dementia and
depression (Lin et al, 2018; Harris-Kojetin et al,
2013). Currently, technology interventions are used
as a support for isolation and loneliness. But it has
shown mixed results in its effectiveness to provide
social stimuli and enhance social interactions (Lin,
2018; Cotten et al, 2013; Miyazaki, 2013; Chao,
2015; Burmeister, 2016). Virtual reality (VR) as a
computing technology can help to establish improved
brain health in terms of cognitive functioning, neural
efficiency and instrumental activities of daily living
(Liao, Y. Y., 2019). VR reality system called Balance
Rehabilitation Unit can be used to improve the
balance and physical performance (Phu, S., 2019).
Barsasella, D., Malwade, S., Chang, C., Liu, M., Srikanth, S., Panja, A., Li, Y. and Syed-Abdul, S.
Opinions regarding Virtual Reality among Older People in Taiwan.
DOI: 10.5220/0009425801650171
In Proceedings of the 6th International Conference on Information and Communication Technologies for Ageing Well and e-Health (ICT4AWE 2020), pages 165-171
ISBN: 978-989-758-420-6
Copyright
c
2020 by SCITEPRESS – Science and Technology Publications, Lda. All rights reserved
165

Virtual environments are interactive. The virtual
image displays an enhanced version by special
processing and by non-visual display modalities used
to convince users that they are in a synthetic space
(Ellis SR. 1994). For older population who are unable
to travel or attend family events, can escape their
isolation to a certain extent through virtual reality.
Studies suggest that immersing older adults in virtual
reality may stimulate the brain and reactivate some
neuro-pathways by taking away distractions or serve
as a distraction from confusion or pain (Adéla
Plechatá, 2019). Thus, it is important to assess the
opinions of older adults and their acceptance with
regards to VR.
The Technology Acceptance Model (TAM) is
often recognized as the foremost influential and
commonly employed theory for describing an
individual’s acceptance of knowledge systems (Kai
R. Larsen 2003). TAM was derived from the Theory
of Reasoned Action (TRA) (Ajzen and Fishbein,
1980) and initially proposed by Davis (1986). TRA
was a model focus on determinants of consciously
intended behaviours. Behaviour is determined by
their behavioural intention, which depends on attitude
(A) and subjective norm (SN).
The rating scale is a term describing instruments
to evaluate and use the item to select one value.
Rating scales can be used to determine the attitudes
and opinions, record direct observation and
assessment. (Colton, 2007). Researchers feel
comfortable making Likert items for their surveys
because of their wide use. For the same reason, survey
respondents are accustomed to and respond
comfortably (Cooper, 2016). Researchers use a
variety of rating scale formats with varying numbers
of response categories and changing label formats to
assess many dimensions of attitudes and opinions
(Mary Lee Gregory 2015).
2 METHOD
Thirty participants were involved in this study
(twenty-four females and six males) from March to
May 2018. Participants were included if they were
aged 60 years and older, those visiting the Taipei
Medical University (TMU) aging center and agreed
to be a participant in this research.
2.1 Data Collection
A research assistant explained the aims of the study
to participants, following which they filled out and
signed the consent form as an agreement to
participate in the study. Participants were exposed to
VR experiences, for two sessions a week and 15
minutes per session, for a period of 6 weeks. At the
end of this duration, they were given the Mandarin
Chinese version questionnaire aimed to collect the
participant’s opinion.
The questionnaire was based on Technology
Acceptance Model (TAM) model (Davis et al, 1989)
and variables proposed by Venkatesh. TAM is theory
of information system derived from social
psychology principles explaining technology
acceptance behavior (Schnall & Bakken, 2011).
The reliability and validity of the questionnaire
has been tested in our previously published research
(Syed-Abdul, 2015), where the same responses were
analyzed.
2.2 Data Analysis
Data was analyzed by using SPSS vers. 21 (SPSS.
Chicago, II, USA). Correlation among the variables
in the dataset was specified by Exploratory Factor
Analysis (EFA).
One statistical approach to conduct factor
analysis and to perform the EFA is Principal
Component Analysis (PCA).
PCA is one of the approaches to conduct factor
analysis and show variance proportion. High values
of variables indicate well represented factor space,
while the low values variables indicate unwell
represented factor space. Varimax rotation was used
to conduct the PCA from questionnaire to extract the
factors. We conducted Kaiser-Meyer-Olkin measure
of sampling adequacy (KMO) and Bartlett’s test of
sphericity. The measure of KMO could be varying
between 0 and 1, and values closer to 1 are considered
adequate. A value of .6 is a suggested as minimum.
These two tests provide a minimum standard which
should be passed before a PCA. KMO indicates the
variance proportion in the variables caused by
underlying factors. Factor analysis will be considered
useful for the values that are close to 1.0, and not
useful for the values less than 0.50 (Armentano,
2015).
Our questionnaire was scored on a 5-point Likert
scale to measure the attitudes of older population in
VR use. In this question, we determined 5 choices: 1.
Strongly disagree, 2. Disagree, 3. Neutral, 4. Agree,
and 5. Strongly Agree. Based on the responses, we
produced the proportion of each answer, and the
index and category for each variable (PU, PEOU, PE,
SN, UE, IU) (Sullivan, 2013).
ICT4AWE 2020 - 6th International Conference on Information and Communication Technologies for Ageing Well and e-Health
166
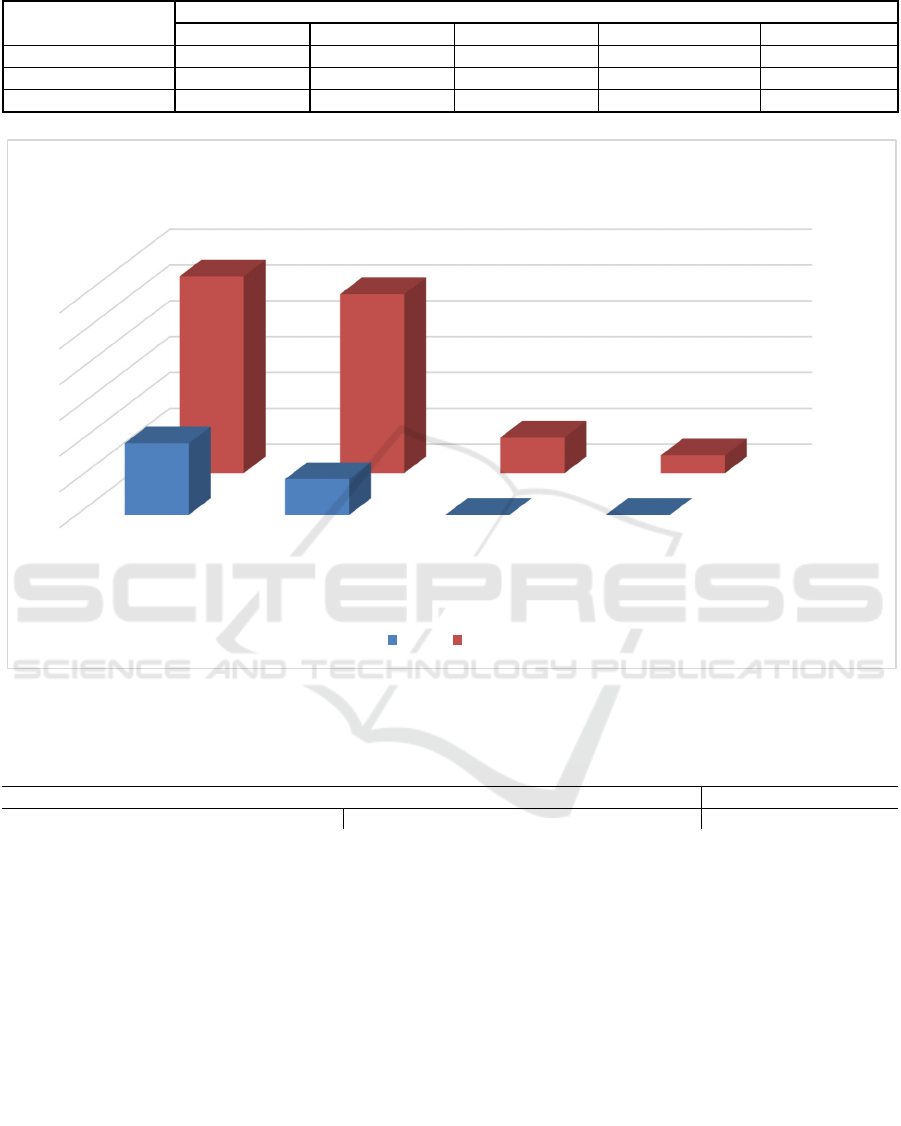
Table 1: Characteristics of participants.
Gender Age
60-70 70-80 80-90 >90
Male 4 2 0 0 6 (20%)
Female 11 10 2 1 24 (80%)
Total 15(50%) 12(40%) 2(6.7%) 1(3.3%)
Figure 1: Participant Characteristics.
Table 2: KMO and Bartlett’s Test.
KMO and Bartlett's Test
Kaise
r
-Meye
r
-Olkin Measure of Sampling Adequacy. 0.693
Bartlett's Test of S
p
hericit
y
Pvalue 0.000
3 RESULT
Table 1 shows the characteristics of participants. The
highest proportion (50%) of participants belonged to
60-70 years age range, with a majority of female
participants (80%). The lowest proportion of
participants belonged to >90 years age, comprising of
one female participant (3.3%)
Table 2 shows KMO and Bartlett’s Test result.
KMO measure of sampling adequacy was 0.693,
suggesting a moderately good index value. The p
value from Bartlett's test of sphericity was 0.000.
These results were indicative of the feasibility of
PCA.
Table 3 shows the result of factor analysis with
PCA. The range of values were 0.614 to 0.851,
determining the sufficient interrelation of all
variables. Table 4 indicates the details of the
responses on the Likert scale. We found that more
than 50% of the participants showed agreements in
the positive opinions about VR, whereas 20.31%
showed disagreements and 30.37% gave a neutral
opinion.
Based on the figure 2 and table 4, we determined
the result of the category for each variable in table 5.
All the variables indicated agreement in PU, PEOU,
PE, SN, UE, and IU to use VR, with a good index
value ranging from 72% to 78.44%.
Male
Female
0
2
4
6
8
10
12
60-70 70-80 80-90 >90
Age
REPRESENTATION OF PARTICIPANT CHARACTERISTICS
Male Female
Opinions regarding Virtual Reality among Older People in Taiwan
167
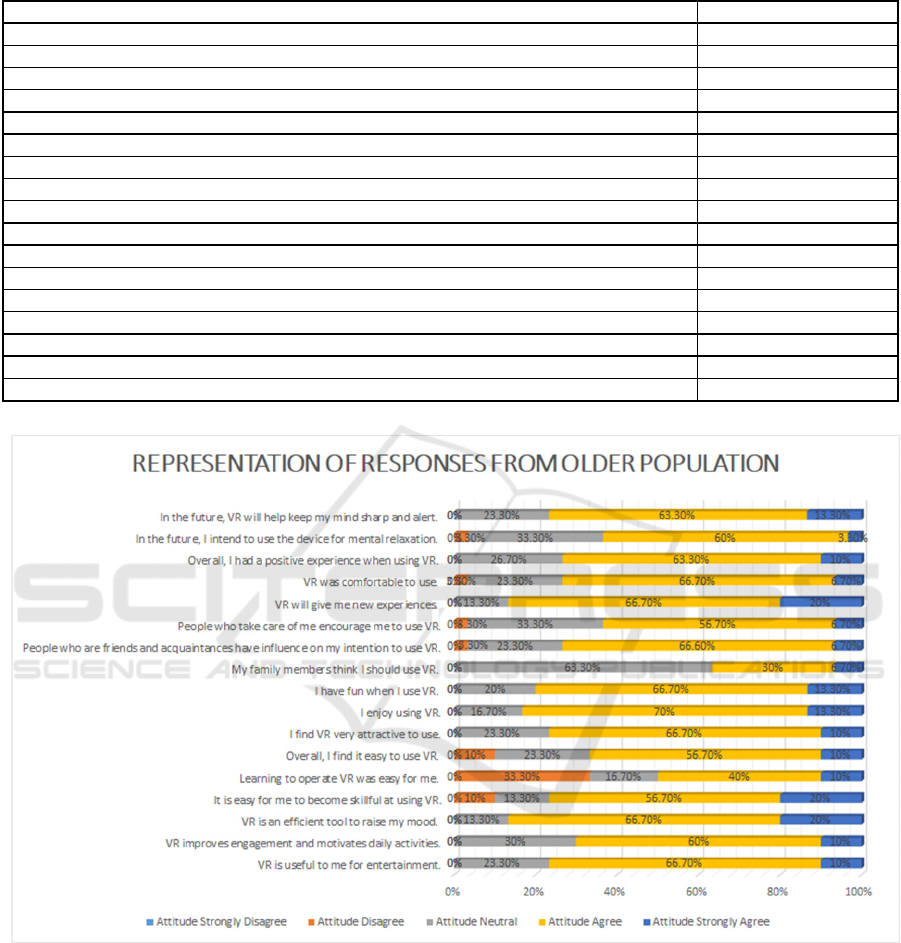
Table 3: Principal Component Analysis (PCA).
Item in Questionnaire Extraction
VR is useful to me fo
r
entertainment. 0.716
VR improves engagement an
d
motivates dail
y
activities. 0.614
VR is an efficient tool to raise m
y
mood. 0.690
It is easy fo
r
me to
b
ecome skillful at using VR. 0.707
Learning to operate VR was eas
y
fo
r
me. 0.851
Overall, I fin
d
it easy to use VR. 0.652
I fin
d
VR ver
y
attractive to use. 0.760
I enjo
y
using VR. 0.718
I have fun when I use VR. 0.780
My family members thin
k
I shoul
d
use VR. 0.719
People who are friends an
d
acquaintances have influence on my intention to use VR. 0.792
People who take care of me encourage me to use VR. (SN3) 0.651
VR will give me new experiences. 0.632
VR was comfortable to use. 0.778
Overall, I ha
d
a
p
ositive experience when using VR. 0.787
In the future, I inten
d
to use the device fo
r
mental relaxation. 0.689
In the future, VR will help keep my min
d
sharp an
d
alert. 0.755
Figure 2: Representation of Responses from Older Population.
4 DISCUSSION
KMO of sampling acceptability is a statistic that
indicates the percentage of variance within the
variables that is probably due to underlying
factors.Values close to 1.0 commonly suggest that
factor analysis can be handy with the records since
patterns of correlations are reasonably compact.
Element analysis ought to yield fantastic and reliable
factors. For values less than 0.50, the results of the
element evaluation in all likelihood will not be
beneficial (Armentano, 2015). The measured KMO is
0.693 from our data, which is undoubtedly an
excellent index. It means that the sample is adequate
and
enough
for
this
research
and
it
doesn’t
need
to
ICT4AWE 2020 - 6th International Conference on Information and Communication Technologies for Ageing Well and e-Health
168
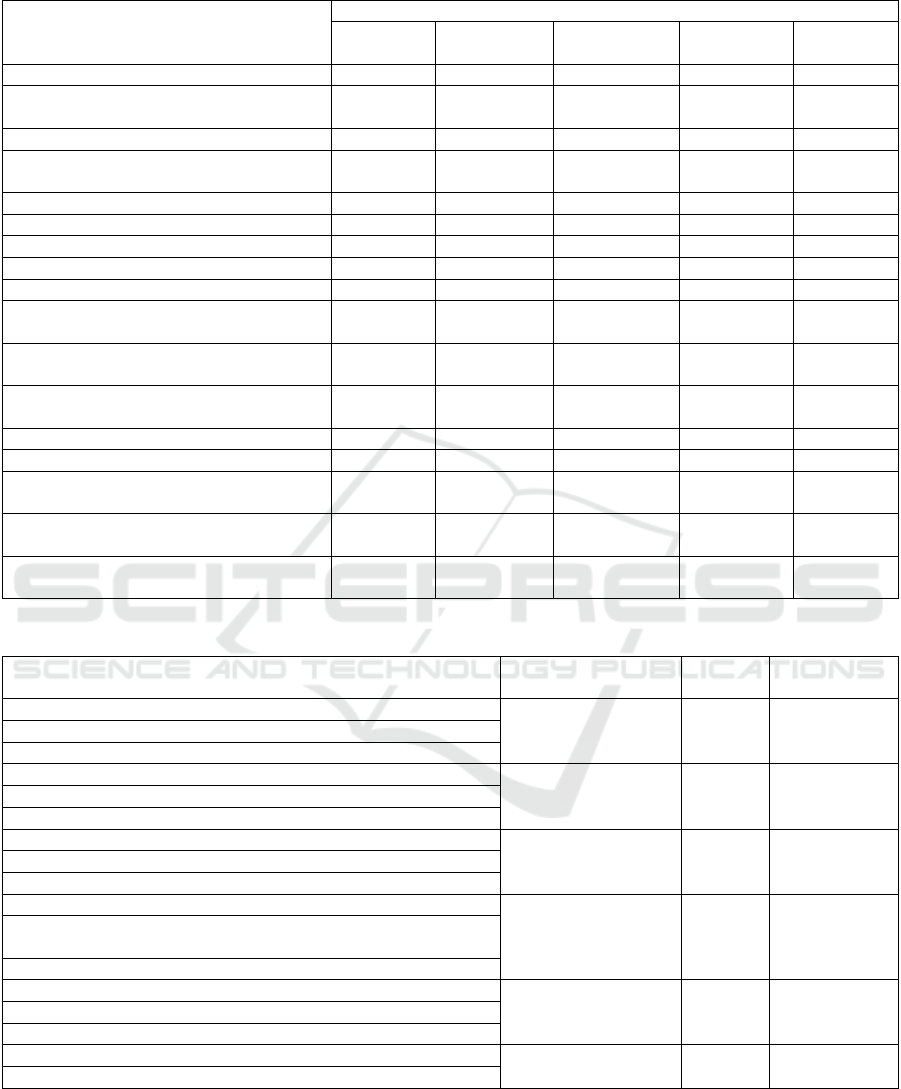
Table 4: Responses of older population.
Item in Questionnaire
Attitude
Strongly
Disagree
Disagree Neutral Agree Strongly
Agree
VR is useful to me fo
r
entertainment. 0 (0%) 0 (%) 7 (23.3%) 20 (66.7%) 3 (10%)
VR improves engagement and motivates
dail
y
activities.
0 (0%) 0 (%) 9 (30%) 18 (60%) 3 (10%)
VR is an efficient tool to raise m
y
mood. 0 (0%) 0 (%) 4 (13.3%) 20 (66.7%) 6 (20%)
It is easy for me to become skillful at
usin
g
VR.
0 (0%) 3 (10%) 4 (13.3%) 17 (56.7%) 6 (20%)
Learning to operate VR was eas
y
fo
r
me. 0 (0%) 10 (33.3%) 5 (16.7%) 12 (40%) 3 (10%)
Overall, I fin
d
it easy to use VR. 0 (0%) 3 (10%) 7 (23.3%) 17 (56.7%) 3 (10%)
I fin
d
VR ver
y
attractive to use. 0
(
0%
)
0
(
%
)
7
(
23.3%
)
20
(
66.7%
)
3
(
10%
)
I en
j
o
y
usin
g
VR. 0
(
0%
)
0
(
%
)
5
(
16.7%
)
21
(
70%
)
4
(
13.3%
)
I have fun when I use VR. 0
(
0%
)
0
(
%
)
6
(
20%
)
20
(
66.7%
)
4
(
13.3%
)
My family members think I should use
VR.
0 (0%) 0 (%) 19 (63.3%) 9 (30%) 2 (6.7%)
People who are friends and acquaintances
have influence on my intention to use VR.
0 (0%) 1 (3.3%) 7 (23.3%) 20 (66.6%) 2 (6.7%)
People who take care of me encourage me
to use VR.
0 (0%) 1 (3.3%) 10 (33.3%) 17 (56.7%) 2 (6.7%)
VR will give me new experiences. 0 (0%) 0 (0%) 4 (13.3%) 20 (66.7%) 6 (20%)
VR was comfortable to use. 0 (0%) 1 (3.3%) 7 (23.3%) 20 (66.7%) 2 (6.7%)
Overall, I had a positive experience when
using VR.
0 (0%) 0 (0%) 8 (26.7%) 19 (63.3%) 3 (10%)
In the future, I intend to use the device for
mental relaxation.
0 (0%) 1 (3.3%) 10 (33.3%) 18 (60%) 1 (3.3%)
In the future, VR will help keep my mind
sharp an
d
alert.
0 (0%) 0 (0%) 7 (23.3%) 19 (63.3%) 4 (13.3%)
Table 5: Category and Index for each variable according to older population responses.
Item in Questionnaire Variable Index
(%)
Category
VR is useful to me fo
r
entertainment. Perceived Usefulness
(PU)
78.22 Agree
VR im
p
roves en
g
a
g
ement an
d
motivates dail
y
activities.
VR is an efficient tool to raise m
y
mood.
It is easy fo
r
me to
b
ecome skillful at using VR. Perceived ease of use
(PEOU)
72 Agree
Learning to operate VR was eas
y
fo
r
me.
Overall, I fin
d
it easy to use VR.
I fin
d
VR ver
y
attractive to use. Perceived Enjoyment
(PE)
78.44 Agree
I en
j
o
y
usin
g
VR.
I have fun when I use VR.
My family members thin
k
I shoul
d
use VR. Social Norms (SN) 72.44 Agree
People who are friends and acquaintances have influence on my
intention to use VR.
Peo
p
le who take care of me encoura
g
e me to use VR.
(
SN3
)
VR will give me new experiences. User Experience
(UE)
77.77 Agree
VR was comfortable to use.
Overall, I ha
d
a
p
ositive ex
p
erience when usin
g
VR.
In the future, I inten
d
to use the device fo
r
mental relaxation. Intention to Use (IU) 75.33 Agree
In the future, VR will hel
p
kee
p
m
y
min
d
shar
p
an
d
alert.
Opinions regarding Virtual Reality among Older People in Taiwan
169

resample again. Bartlett’s test of sphericity evaluates
the speculation that the correlation matrix is a unit
matrix, which specifies unrelated variables and is
consequently not suitable for shape detection. For
factor analysis to function, we require a few
relationships between variables, and if the R-matrix
is a unit matrix, then all correlations coefficients
might be zero. (Armentano, 2015). For our data,
Barlett’s test is highly significant (p<0.001), and
therefore, factor analysis is appropriate. It means all
of the variables are suitable to use in this research to
check the opinion on older population.
Extraction communalities estimates the variance
of every variable considered for the factors in the
factor solution. Small values indicate variables that
don't match well with the factor solution and should
presumably be dropped from the analysis
(Armentano, 2015). The extraction communalities for
our factors are acceptable, with the least value of
0.614 corresponding to PU (VR improves
engagement and motivates daily activities). It
indicates that variables are represented well in this
research by every extracted component.
Older population selected the choice "agree" in 7
queries that suggest VR is useful to them for
entertainment, VR is an efficient tool to raise their
mood, find VR very attractive to use, have fun when
they use VR, People who are friends and
acquaintances have influenced the intention to use
VR, VR will give new experiences, and VR was
comfortable to use.
These seven questions indicate the attitude of
agreement of the older population in using VR. While
the highest choices answering Disagree was 10
(33.3%) founded in the question "Learning to operate
VR was easy for me". 30% expressed difficulties in
the use of VR. A majority showed neutral opinions
and an easy opinion on the thoughts of family
members to use VR. Our study used a similar rated
scale to measure attitude with Hanne Huygelier et al.'s
study.
Comparing with other research, the older
population expressed positive and negative reactions
for each VR variable, gave some preferences and
opinions for improving the usability of the
equipment, and identified facilitators and barriers that
influenced usefulness. Recommendations for
developing this technology include maximizing the
positive aspects of VR through enlarging
interactivity, helping them to socialize with friends or
family, and enhancing older adults’ ease of use.
Desired content of simulations involved travel,
continuing education, reminiscence, and self-
care/therapy. This research is based on using TAM to
process the acceptance of virtual reality. The methods
used by the user to adopt this technology was
analyzed meticulously, bringing in perceived
enjoyment, social interactions, and power of the
social ties to the basic TAM. The outcomes of this
study indicate that social interactions and strength of
the social relationships enhanced perseverance to
enjoy. Perceived enjoyment has a higher significant
effect on purpose to utilize than perceived usefulness,
which is the importance of TAM. These outcomes
have theoretical inferences for consumer adoption
behaviour and empirical conclusions for the best
marketing strategies for virtual reality devices
(Robert et al, 2019).
5 CONCLUSION
Our study showed that older population expressed
positive opinion for all of the TAM variables, the
index being 72% to 78.44%. The highest agreement
is PE and the lowest is PEOU. The older people
perceived that it was enjoyable to use VR, but they
still needed time to be skillful in using it. Future
research should be more focused to provide a longer
time duration and training to older population.
ACKNOWLEDGMENT
We would like to thank to the Research Center for
Active Ageing, Taipei Medical University for
facilitating the data collection of participants.
REFERENCES
Ajzen, I., & Fishbein, M., 1980. Understanding attitude
and predicting social behavior. Englewood Cliifs, NJ:
Prentice-Hall.
Armentano, M. G., Christensen, I., & Schiaffino, S. 2015.
Applying the technology acceptance model to
evaluation of recommender systems. Polibits, (51), 73-
79.
Burmeister, O. K., Bernoth, M., Dietsch, E., & Cleary, M.
2016. Enhancing connectedness through peer training
for community-dwelling older people: A person centred
approach. Issues in Mental Health Nursing, 37(6), 406-
411.
Chao, Y. Y., Scherer, Y. K., & Montgomery, C. A. 2015.
Effects of using Nintendo Wii™ exergames in older
adults: a review of the literature. Journal of aging and
health, 27(3), 379-402.
ICT4AWE 2020 - 6th International Conference on Information and Communication Technologies for Ageing Well and e-Health
170

Colton, D., & Covert, R. W. 2007. Designing and
constructing instruments for social research and
evaluation. John Wiley & Sons.
Cooper, I. D., & Johnson, T. P. 2016. How to use survey
results. Journal of the Medical Library Association:
JMLA, 104(2), 174.
Cotten, S. R., Anderson, W. A., & McCullough, B. M.
2013. Impact of internet use on loneliness and contact
with others among older adults: cross-sectional
analysis. Journal of medical Internet research, 15(2),
e39
Council ND. Populations Projection for Republic of China:
2016-2060 2016 [Available from: https://www.ndc.
gov.tw/en/cp.aspx?n=2E5DCB04C64512CC.
Davis, F. D., Bagozzi, R. P., & Warshaw, P. R. 1989. User
acceptance of computer technology: a comparison of
two theoretical models. Management science, 35(8),
982-1003.
Ellis, S. R. (1994). What are virtual environments? IEEE
Computer Graphics and Applications, 14(1), 17-22.
Gregory, M. L., Burton, V. J., & Shapiro, B. K. 2015.
Developmental disabilities and metabolic disorders. In
Neurobiology of brain disorders (pp. 18-41). Academic
Press.
Harris-Kojetin, L. D., Sengupta, M., Park-Lee, E., &
Valverde, R. 2013. Long-term care services in the
United States: 2013 overview.
Huygelier, H., Schraepen, B., van Ee, R., Abeele, V. V., &
Gillebert, C. R. 2019. Acceptance of immersive head-
mounted virtual reality in older adults. Scientific
reports, 9(1), 4519.
Larsen, Kai. R. T. & Kozar, K. A. 2003. The technology
acceptance model: Past, present, and future.
Communications of the Association for information
systems, 12(1), 50.
Lee, Y., Kozar, K. A., & Larsen, K. R. 2003. The
technology acceptance model: Past, present, and future.
Communications of the Association for information
systems, 12(1), 50.
Liao, Y. Y., Tseng, H. Y., Lin, Y. J., Wang, C. J., & Hsu,
W. C. (2019). Using virtual reality-based training to
improve cognitive function, instrumental activities of
daily living and neural efficiency in older adults with
mild cognitive impairment: a randomized controlled
trial. European journal of physical and rehabilitation
medicine.
Lin, C. X., Lee, C., Lally, D., & Coughlin, J. F. 2018, July.
Impact of virtual reality (VR) experience on older
adults’ well-being. In International Conference on
Human Aspects of IT for the Aged Population (pp. 89-
100). Springer, Cham.
Miyazaki, M., Sano, M., Naemura, M., Sumiyoshi, H.,
Mitsuya, S., & Fujii, A. 2013, September. A social tv
system for the senior community: Stimulating elderly
communication using information and communications
technology. In 2013 16th International Conference on
Network-Based Information Systems (pp. 422-427).
IEEE.
Phu, S., Vogrin, S., Al Saedi, A., & Duque, G. (2019).
Balance training using virtual reality improves balance
and physical performance in older adults at high risk of
falls. Clinical interventions in aging, 14, 1567.
Plechatá, A., Sahula, V., Fayette, D., & Fajnerová, I. 2019.
Age-related differences with immersive and non-
immersive virtual reality in memory assessment.
Frontiers in Psychology, 10.
Roberts, A. R., De Schutter, B., Franks, K., & Radina, M.
E. 2019. Older adults’ experiences with audiovisual
virtual reality: Perceived usefulness and other factors
influencing technology acceptance. Clinical
gerontologist, 42(1), 27-33.
Schnall, R., & Bakken, S. 2011. Testing the Technology
Acceptance Model: HIV case managers' intention to use
a continuity of care record with context-specific links.
Informatics for Health and Social Care, 36(3), 161-
172.
Sullivan, G. M., & Artino Jr, A. R. 2013. Analyzing and
interpreting data from Likert-type scales. Journal of
graduate medical education, 5(4), 541-542.
Syed-Abdul, S., Malwade, S., Nursetyo, A. A., Sood, M.,
Bhatia, M., Barsasella, D., ... & Li, Y. C. J. 2019.
Virtual reality among the elderly: a usefulness and
acceptance study from Taiwan. BMC geriatrics, 19(1),
223.
WHO, 2018, Ageing and Health, World Health
Organization, WHO, 5 February 2018, https://
www.who.int/news-room/fact-sheets/detail/ageing-
and-health.
Opinions regarding Virtual Reality among Older People in Taiwan
171
