
Qualitative Feature Assessment for Longitudinal and Lateral
Control-features
Jacob Langner
1
, Christian Seiffer
1
, Stefan Otten
1
, Kai-Lukas Bauer
2
, Marc Holz
¨
apfel
2
and Eric Sax
1
1
FZI Research Center for Information Technology, 76131 Karlsruhe, Germany
2
Dr. Ing. h.c. F. Porsche AG, 71287 Weissach, Germany
kai-lukas.bauer@porsche.de, marc.holzaepfel@porsche.de
Keywords:
Qualitative Feature Assessment, Representativity, Test Coverage, Data Analytics, Real-World-Driving-Data.
Abstract:
Control features take over a multitude of driving tasks in today’s vehicles. The complexity of the underlying
software code and control parameters has grown to a staggering size. It is no longer viable to test and evaluate
features on a pure feature level while driving through real world traffic. The driving tasks and environmental
situations are too manifold to be lumped together undifferentiated. As time and resources during development
are scarce, test scopes are limited. However, test coverage and representativity are crucially important and can
not be neglected. We propose an approach that enables feature evaluation on a driving task basis and achieves
holistic assertions for the maturity level even on small test scopes. The approach is based on recorded road
tests and is demonstrated with a brief example.
1 INTRODUCTION
Today’s longitudinal and lateral control features are
ever growing in their complexity. With the help of
better sensing abilities of the surrounding environ-
ment, these control features take over more and more
driving tasks. What started as a simple cruise con-
trol feature, has been iteratively developed to react
adaptively towards the front vehicle, the driver’s pref-
erences, predictive road data and is today a highly
complex predictive cruise control (e.g. (Albrecht and
Holz
¨
apfel, 2018) (DAF, 2020)). The same is true for
lateral control, where lane departure warning features
have been developed into actively steering lane keep-
ing assists. As these systems become more and more
mature, the Operational Design Domain (ODD) will
be extended to include more complex cases such as
lane changes or taking turns in the near future.
A lot of effort is put into the safety analysis of
these features in order to bring them to market as soon
as possible. With extensive testing the proof of safety
is brought forward. While the goal of these tests is a
binary safety assertion, little focus is set on the quali-
tative assessment of the features in terms of passenger
comfort and overall maturity. However, with increas-
ing automation levels, passenger comfort and user ex-
perience will ultimately also have an impact on the
consumer acceptance in the long term.
Therefore, we propose an approach to tackle the
qualitative assessment for longitudinal and lateral
control features by using real world road test data. As
test scopes during development are limited, our focus
is on deriving representative assertions from smaller
test scopes and being able to compare different road
tests on a semantic level. We propose a method for a
driving task based evaluation, which grants compara-
ble results even for smaller test scopes. In section 2
we present an overview of current test methods during
feature development. Afterwards, the concept of the
driving task based evaluation is described in section
3. The required setup is outlined in section 4 and a
short example is given in section 5. The article ends
with a conclusion and an outlook on future work in
section 6.
2 STATE-OF-THE-ART
Automotive features - especially those with direct or
indirect control over the longitudinal or lateral mo-
tion of the vehicle - need to be tested exhaustively
to ensure their safety. The ISO26262 (ISO, 2011) re-
quires a risk analysis to be made for the Feature Under
Test (FUT). Afterwards, the fulfillment of the derived
safety goals has to be proven to ensure the highest
Langner, J., Seiffer, C., Otten, S., Bauer, K., Holzäpfel, M. and Sax, E.
Qualitative Feature Assessment for Longitudinal and Lateral Control-features.
DOI: 10.5220/0009425201150122
In Proceedings of the 6th International Conference on Vehicle Technology and Intelligent Transport Systems (VEHITS 2020), pages 115-122
ISBN: 978-989-758-419-0
Copyright
c
2020 by SCITEPRESS – Science and Technology Publications, Lda. All rights reserved
115

possible safety and security in traffic. Systematic test-
ing starts with unit and component tests, where cor-
rect behavior of each single entity is proven. The fol-
lowing integration tests aim at proving the correct in-
teraction between the units and components up to the
complete system. Finally, the complete system has to
be tested in interaction with its future environment.
(Bourque et al., 2014)
Today, there are many different test methods, best
suited for the different test goals. Unit and compo-
nent testing can be achieved with Model-in-the-loop
(MIL) and Software-in-the-loop (SIL) tests (Shokry
and Hinchey, 2009) (Albers et al., 2010). With each
integration step the complexity of the tests increases
drastically as the number and thereby the possible
combinations of inputs, internal states and outputs in-
crease. The focus of integration testing is the correct
behavior of the software on the target hardware as
well as the correct interaction between different units
and components. Hardware integration can be tested
with Hardware-in-the-loop (HIL) tests (Sax, 2008)
(Oral, 2013) whereas the correct interaction between
software components can also be tested in a SIL en-
vironment. System level testing requires at least the
complete control chain plus the relevant vehicle en-
vironment, the vehicle reacts to and interacts with.
Therefore, these tests are done with prototype vehi-
cles either on the proving ground or in real traffic.
Testing, however, does not start with the release
approval. It is crucial, that the feature is extensively
tested during development. Prototype vehicles offer
the developers the possibility to experience the fea-
ture under realistic conditions. While these tests are
valuable due to their high realism and direct feed-
back for the developer, they are time consuming and
costly. Since there are many iterations of testing and
development, time and resource costs of test itera-
tions are critical. However, their validity and com-
pleteness needs to remain on the highest level possi-
ble. This gap can be filled by complementing the real
world tests with simulation approaches, which offer
less realism but more scalability and especially repro-
ducibility of tests.
The realism and thereby the validity of the asser-
tions made within a simulation environment strongly
depends on the quality of the models used to substi-
tute the real world. Depending on the use case models
for the vehicle, road topology, traffic and e.g. other
road users must be provided (Wachenfeld and Win-
ner, 2016). One possible way to obtain lots of realistic
data for the simulation is to reuse recorded real world
driving data from test campaigns and other road tests
(Zofka et al., 2015) (Langner et al., 2017). This driv-
ing data contains information about the road layout
as well as information about other vehicles and road
users at the time of recording. With some interme-
diate processing even closed-loop simulations can be
achieved using the recorded data (Bach et al., 2017)
(de Gelder and Paardekooper, 2017).
However, for recurrent testing during develop-
ment and application - even in a simulation environ-
ment - it is not efficient to use all test drives within the
ever growing data pool. A strategy for selecting rep-
resentative test drives out of the data pool is required
as well as a method to extrapolate the results based on
this representative sample to the complete data pool.
For Verification and Validation (V&V) the pur-
pose of testing is the safety and thereafter the release
approval of the FUT. In order to achieve this, the fea-
ture’s correct behavior in every conceivable situation
has to be proven - e.g. by successfully completing
each possible test once. Completeness of testing can
be argued in several ways.
For one, stochastic measures can be applied. Met-
rics like fatalities, injuries or disengagements per
x kilometers may give an indication of the sys-
tem’s safety (Shalev-Shwartz et al., 2017). How-
ever, Wachenfeld and Winner (Wachenfeld and Win-
ner, 2016) show, that billions of driven test kilometers
are required for statistically valid assertions for higher
SAE levels due to the rarity of crashes or critical situ-
ations in real world traffic.
To counter the problem of rare occurrences of crit-
ical situations, scenario-based testing (Conrad et al.,
2005) has been introduced. Here, test content is not
randomly generated through driving in the real world
but explicitly specified via scenarios. Each scenario
represents a certain situation that is to be tested. Thus,
rare situations can explicitly be tested independent of
their frequency in normal traffic. For the safety argu-
ment the focus is set on critical scenarios which are
more relevant for the release approval (Junietz et al.,
2017).
However, both approaches have little validity to-
wards the assessment of the overall feature maturity
in terms of passenger comfort and feature quality as
they focus only on safety relevant aspects. Specific
situations are either not considered at all or are cherry
picked while the frequency of the situations is com-
pletely neglected. For a quality assessment the fre-
quency of the situations in real world traffic has to
be identified and must be taken into account. For in-
stance, corner cases are less important for the driver
experience than for the safety argument. In contrast,
the frequent situations that occur more often than the
corner cases have to be weighted higher for an overall
comfort evaluation.
In this work, we want to focus on the quality as-
VEHITS 2020 - 6th International Conference on Vehicle Technology and Intelligent Transport Systems
116

sessment of complex control features like upcoming
SAE level 3 features. We present the argument, that
global, undifferentiated evaluations on the basis of
real world test drives have little value towards feature
improvement and application. A driving task based
evaluation approach is presented, that evaluates the
feature with regard to the different challenges and sit-
uations in real traffic. Our contribution aims to enable
comparability of continuous tests during development
with smaller testsets while still achieving globally
valid assertions of the feature’s maturity level.
3 FEATURE EVALUATION
DURING REAL WORLD
TESTING
Road tests typically consist of various environmental
situations, such as winding roads, highways or moun-
tain passes. Quantity and characteristics of these situ-
ations predominantly shape the properties of a certain
road test as a whole, which makes different road tests
highly heterogeneous. Even when driving the same
route twice, different situations due to other vehicles
and road users may occur. Additionally, the time gap
between two test drives makes a direct comparison of
different test drives with potentially different software
versions or control parameters difficult, if not impos-
sible. The assertions made while test driving in real
traffic are always subjective and with only a small test
scope the assertions will never be holistically valid.
One solution to the subjectivity of the assertions
made and the time gap between two tests is to record
the test drives and compare the data with objective
metrics. The recorded data combined with a closed-
loop simulation environment allows for direct com-
parison of different software versions and control pa-
rameters. However, on a holistic view it is difficult
to determine, which changes benefited in which situ-
ation and which changes may not have had the desired
effects.
In order to derive valid assertions from a test drive
or simulation, it is crucial to make correct evaluations.
Meaning, changes that only take effect in certain sit-
uations must be evaluated based on these situations.
Since the number of relevant situations per test drive
may vary and is unknown, there is no valid assertion
to be made from any evaluation made on a per test
drive basis.
Figure 1 depicts the results of a simulation test
setup, where only one control parameter has been var-
ied and the feature has been evaluated using multi-
ple test drives. The effects on the performance metric
Figure 1: Section of an Evaluation with Complete Test
Drives. A Large Variance in the Evaluation Metric between
Test Drives Is Visible.
massively depend on the chosen simulated road test.
Large variance as well as ambivalent changes in the
metric between different road tests do not allow for
any well-founded derivations as to which value the
control parameter should be set to. Figure 2 shows
permutations of 130 different test drives. There is
no convergence behavior to be derived - meaning no
valid assertions about the holistic feature performance
to be made.
Figure 2: 10.000 Permutations of 130 Different Test Drives
with a Total Length of 9950 Km Evaluated on a per Test
Drive Basis.
As most control parameters only take effect in cer-
tain situations, there is no way to determine whether
a certain value of a control parameter is actually bet-
ter than another or just better for the situations, that
occurred in that specific test drive. It remains un-
clear, how many relevant situations in each test drive
occurred and therefore how relevant the test drive is
for the evaluation of the specific control parameter.
The same holds true for changes in the software code.
Therefore, evaluations should focus on more distinc-
tive parts within the road tests with regard to the FUT
and the goal of the evaluation.
A suitable design choice for the control features
is to implement sub-modules, which each handle a
specific driving task matching one or more situations
Qualitative Feature Assessment for Longitudinal and Lateral Control-features
117
System
Driving task
Longitudinal
control
Cornering
Follow front
vehicle
Approach
speed limit
Give way and
stop signs
Take turn
...
Lateral
control
Combined
maneuvers
Variations
Lane count and width Lane condition Curvature and slope Field of view
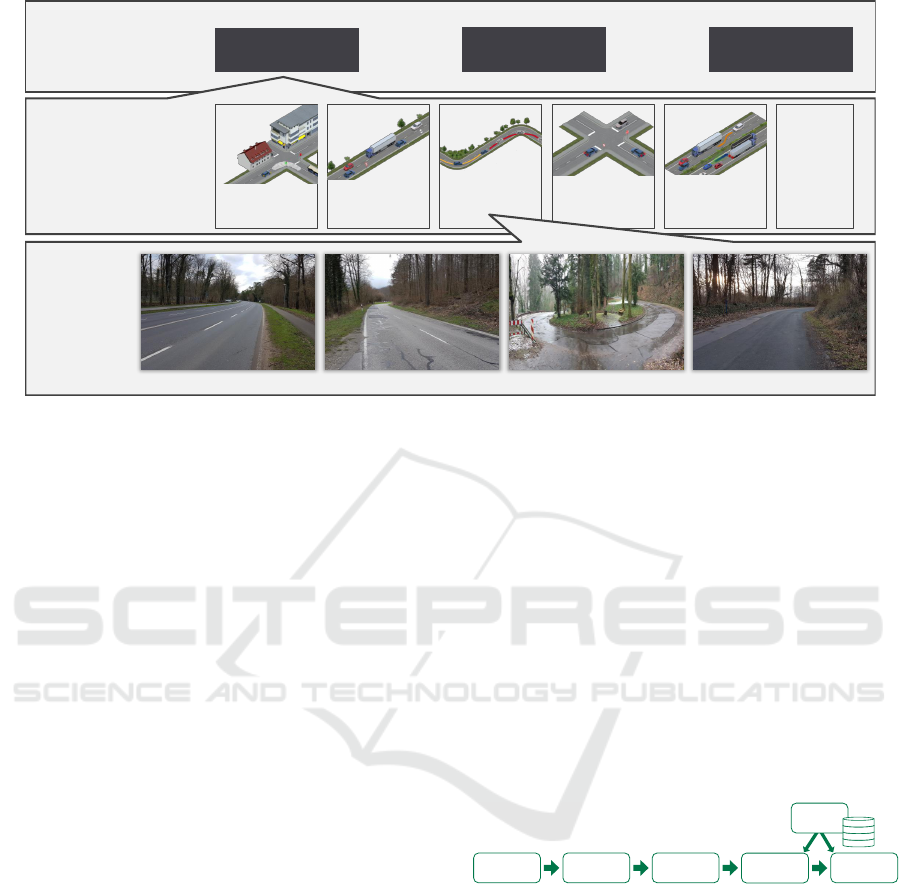
Figure 3: Breakdown of the Lateral and Longitudinal Control into Driving Tasks with Multiple Relevant Attributes Leading
to a Manifold of Variations for Each Driving Task.
occurring in real world traffic. Exemplary driving
tasks for the longitudinal control are setting the cur-
rent speed to the legal speed limit, following a preced-
ing vehicle, reacting towards upcoming traffic signs
and approaching crossings or exits. The lateral con-
trol’s main task is to keep the vehicle centered in the
lane. However, different environment situations di-
vide this task into different subtasks. Depending on
the width of the lane, the vehicle should either be cen-
tered in the lane or kept to the right respectively left
side. If only the right respectively left lane marking
can be detected, the driving task is to follow that lane
marking. Furthermore, lane switches, crossings, ex-
its, side roads, multiple lanes and dashed or dotted
lane markings have to be handled.
Each sub-module is only active during the respec-
tive driving task and thereby can and should only be
evaluated during this task. Additionally, each sub-
module having its own software code and control pa-
rameters naturally supports this approach. Figure 3
depicts the proposed breakdown and shows exem-
plary driving tasks for the longitudinal control.
The driving task based evaluation is separated in
two parts: A one time setup is required to extract in-
formation about the frequency and characteristics of
the driving tasks from the complete data pool. After-
wards, representative and comparable evaluations on
smaller test scopes can be conducted.
4 SETUP OF THE DRIVING TASK
BASED EVALUATION
Figure 4 depicts the required setup steps. At first,
the driving tasks as well as characteristic attributes
for each task have to be specified. With the help of
detectors, these tasks can be identified in recorded
test drives, which are then used to extract informa-
tion about the frequency and characteristics of each
task from the data pool. The extracted information is
required to derive weighting factors for the different
variations of a given driving task.
Driving Task
Specification
Attribute
Definition
Driving Task
Detectors
Binning and
Distributions
Global
Weights
Complete
Data Pool
Figure 4: Required Preparation Steps for the Driving Task
Based Evaluation of Longitudinal and Lateral Control Fea-
tures.
The specification of the driving tasks can be done
with the help of expert knowledge or via derivation
from the feature specification. In either way all parts
of the ODD should be covered by the union of all
driving tasks. The events could also be derived from
different environment situations, independent of the
feature’s driving tasks. If the insights into the fea-
ture are available and the required information is con-
tained in the recorded driving data, we suggest to use
the feature knowledge and derive the driving tasks di-
rectly, as the results will better match the feature’s
sub-modules and can directly be transferred into fur-
VEHITS 2020 - 6th International Conference on Vehicle Technology and Intelligent Transport Systems
118

ther development steps.
For each driving task a set of characteristic at-
tributes has to be selected to describe and distinguish
the variations of each specific task. Optimally, these
attributes match the inputs the feature uses to control
the vehicle during that driving task. Thereby, the rel-
evant input space is covered later on in the evaluation.
Different tasks may have different attributes describ-
ing them. For the front vehicle the distance to the
vehicle and the relative speed may be fitting attributes
to describe the ’front vehicle’ driving task. For cor-
nering on the other hand, the front vehicle plays no
significant role. Therefore, attributes like the curva-
ture or lane width are more suitable to describe the
’cornering’ driving task.
With the formalized description, driving task de-
tectors can be programmed which detect the time slots
or position segments in the data where these tasks are
active. The determined occurrences of the various
tasks provide initial weighting indicators for each test
drive in regard to a specific driving task evaluation.
This, however, is only part of the solution. In or-
der to evaluate the feature semantically, the possible
variations of each driving task have to be included in
the evaluation. In case of the cornering driving task
the single occurrences might have different attribute
values for the curvature, slope, lane width, lane count,
lane condition or field of view. Figure 5 depicts a test
setup schematically. In order to compare the different
test runs, which may or may not have the same test
drives, a holistic evaluation for each test run has to be
derived.
Assuming a sufficiently large number of test
drives, the naturally occurring frequency of the curve
variations could simply be used as a representa-
tive sample for the importance in real world traffic.
Thereby, a simple average over all instances could be
used for the holistic evaluation result. But, for a lim-
ited number of test drives this representative coverage
of the high dimensional attribute space can not be as-
sumed. Therefore, an implicit weighting of the oc-
curring instances is not a valid solution. The implicit
weights have to be transformed into explicit weight-
ing factors. The main challenge is to preserve the
representativity of the complete data pool in order to
maintain validity of the assertions made on smaller
test scopes.
With the help of the complete data pool, a holistic
picture of the attribute distributions of all instances
for each driving task can be drawn. These distribu-
tions can serve as a ground truth for the frequency
and characteristics of the driving tasks. By binning
the attribute space- either combinatorial or for each
attribute - occurrences per bin can be extracted.
These occurrences can then be transformed into
weighting factors. These weighting factors allow the
holistic evaluation of smaller test scopes, where the
attribute distribution of the driving tasks may not re-
flect the overall distribution. Thereby, the former im-
plicit weighting can explicitly be enforced by calcu-
lating the result for each bin and multiplying it with
the corresponding weighting factor.
Regarding the ’cornering’ driving task, curvature
and slope are two relevant attributes. Figure 6 illus-
trates the resulting two dimensional attribute space
with concrete detected instances from the data pool.
The distribution of these instances within the attribute
space is far from balanced. While the slope values re-
semble a normal distribution around zero, the curva-
ture values are clustered around two points near zero
with some heavy outliers on both sides.
Optionally, a representative set of test drives can
be derived using the attribute space distributions. Se-
lecting test drives, so that the complete attribute space
is covered, guarantees the holistic validity of the as-
sertions made while using the selected test drives.
5 EXEMPLARY USAGE OF THE
DRIVING TASK BASED
EVALUATION
Figure 7 depicts the steps for the usage of the driv-
ing task based evaluation. It can be applied to ei-
ther recorded test drives or simulation based results.
In these time or position based recordings, the given
driving task has to be detected, using the already spec-
ified detectors. Then, each single instance has to be
evaluated in terms of feature performance. After-
wards, the weighting factors can be applied in order
to aggregate the single results to a valid holistic asser-
tion.
The ’cornering’ driving task shall be used to pro-
vide a small exemplary use case for the driving task
based evaluation. With the help of the proposed
method, a holistic evaluation result for three differ-
ent test runs shall be calculated in order to determine
the best combination of control parameters and soft-
ware version. The test runs have all been simulated
with the same test drives but different control param-
eter sets and software versions (see Figure 5 Test 1-3).
Curves have a multitude of relevant attributes that
determine the optimal speed for the specific curve in-
stance. In order to prove the optimal velocity predic-
tion in every possible situation, all combinations of
relevant attribute values have to be considered. For
the sake of simplicity, this example is reduced to the
Qualitative Feature Assessment for Longitudinal and Lateral Control-features
119
Test setup
Test 1
Holistic
evaluation
Control parameter set X
Software version A
Test drive
Single event Single event
Single event Single event
Single event Single event
Test drive
Single event Single event
Single event Single event
Single event
Test drive
Single event Single event
Single event
Test drive
…
Test 2
Holistic
evaluation
Control parameter set X
Software version B
Test drive
Single event Single event
Single event Single event
Single event Single event
Test drive
Single event Single event
Single event Single event
Single event
Test drive
Single event Single event
Single event
Test drive
…
Test 3
Holistic
evaluation
Control parameter set Y
Software version B
Test drive
Single event Single event
Single event Single event
Single event Single event
Test drive
Single event Single event
Single event Single event
Single event
Test drive
Single event Single event
Single event
Test drive
…
Single event
Evaluation result
Attribute: field of view
Attribute: curvature
Attribute: slope
Attribute: lane condition
Attribute: lane width
Single event
Evaluation result
Attribute: field of view
Attribute: curvature
Attribute: slope
Attribute: lane condition
Attribute: lane width
Single event
Evaluation result
Attribute: field of view
Attribute: curvature
Attribute: slope
Attribute: lane condition
Attribute: lane width
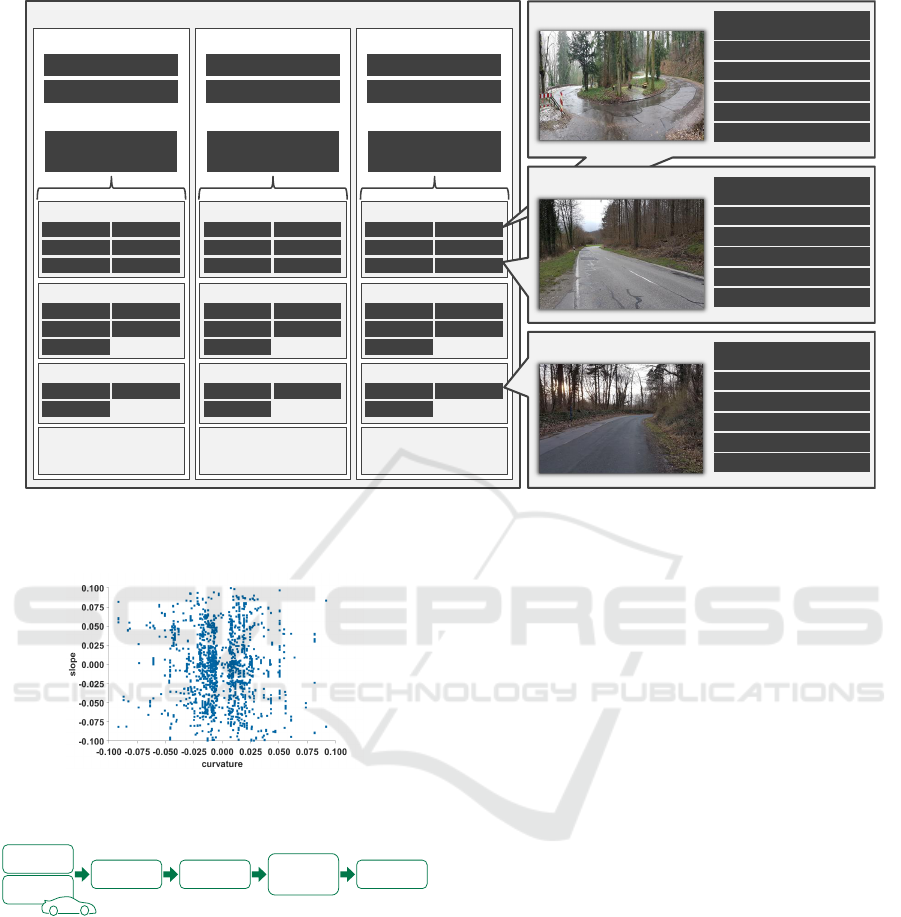
Figure 5: Test Setup with Different Software Versions and Control Parameter Sets Simulated with the Same Test Drives. Each
Test Drive Has a Number of Relevant Events, Which Are Individually Evaluated. However, a Holistic Evaluation for Each
Test Run Is Required to Compare the Tests.
Figure 6: Distribution of Concrete Curve Events within the
Curvature-Slope Attribute Space.
Driving Task
Detection
Recorded Test
Drives
Re-Simulation
of Test Drives
Driving Task
Evaluation
Application of
the Global
Weights
Holistic
Assertions
Figure 7: Usage of the Driving Task Based Evaluation of
Longitudinal and Lateral Control Features.
curvature and slope attributes. Further attributes can
be added by either spanning a high dimensional at-
tribute space or covering all two dimensional cross
attribute spaces. The curvature and slope value ranges
were each limited to -0.1 to 0.1 and then binned into 8
bins each. The limits and the number of bins were de-
rived from the distribution of concrete curve instances
from the complete data pool (see Figure 6).
The distribution from the complete data pool is
used as a reference distribution, that smaller test
scopes can be compared against. If the distribution
of the small test scope differs from the reference, the
result can be weighted accordingly. In areas where
a certain threshold of instances was not exceeded in
the complete data pool, the bins have been marked, so
that missing instances in smaller test scopes are not
considered negatively and thereby do not affect the
overall result. For all other bins representatives are
expected and therefore a penalty is set to the overall
result, if some of these bins are not represented in a
given testset.
With the curvature and slope attributes having
each been binned to eight fields within their relevant
value ranges, the resulting parameter space is divided
into 64 groups. For each group the aggregated result
over all instances in that group has to be calculated.
Here, different metrics can be applied. We chose the
Root-Mean-Square Error (RMSE) to penalize large
deviations from the optimal behavior heavier. Fig-
ure 8 depicts the curvature-slope attribute space of the
two test runs. The single instances are depicted as
well as the RMSE results for each group. The groups
that did not exceed the threshold in the analysis of the
complete data pool have been marked with stripes.
If no weighting factors are applied, the overall re-
sult may vary heavily based on the curve instances in
the test scope, as shown in Table 1. When combining
the 64 groups by calculating the arithmetic mean, the
parameter set and software version of Test 2 would be
the best result. However, using the derived weighting
VEHITS 2020 - 6th International Conference on Vehicle Technology and Intelligent Transport Systems
120
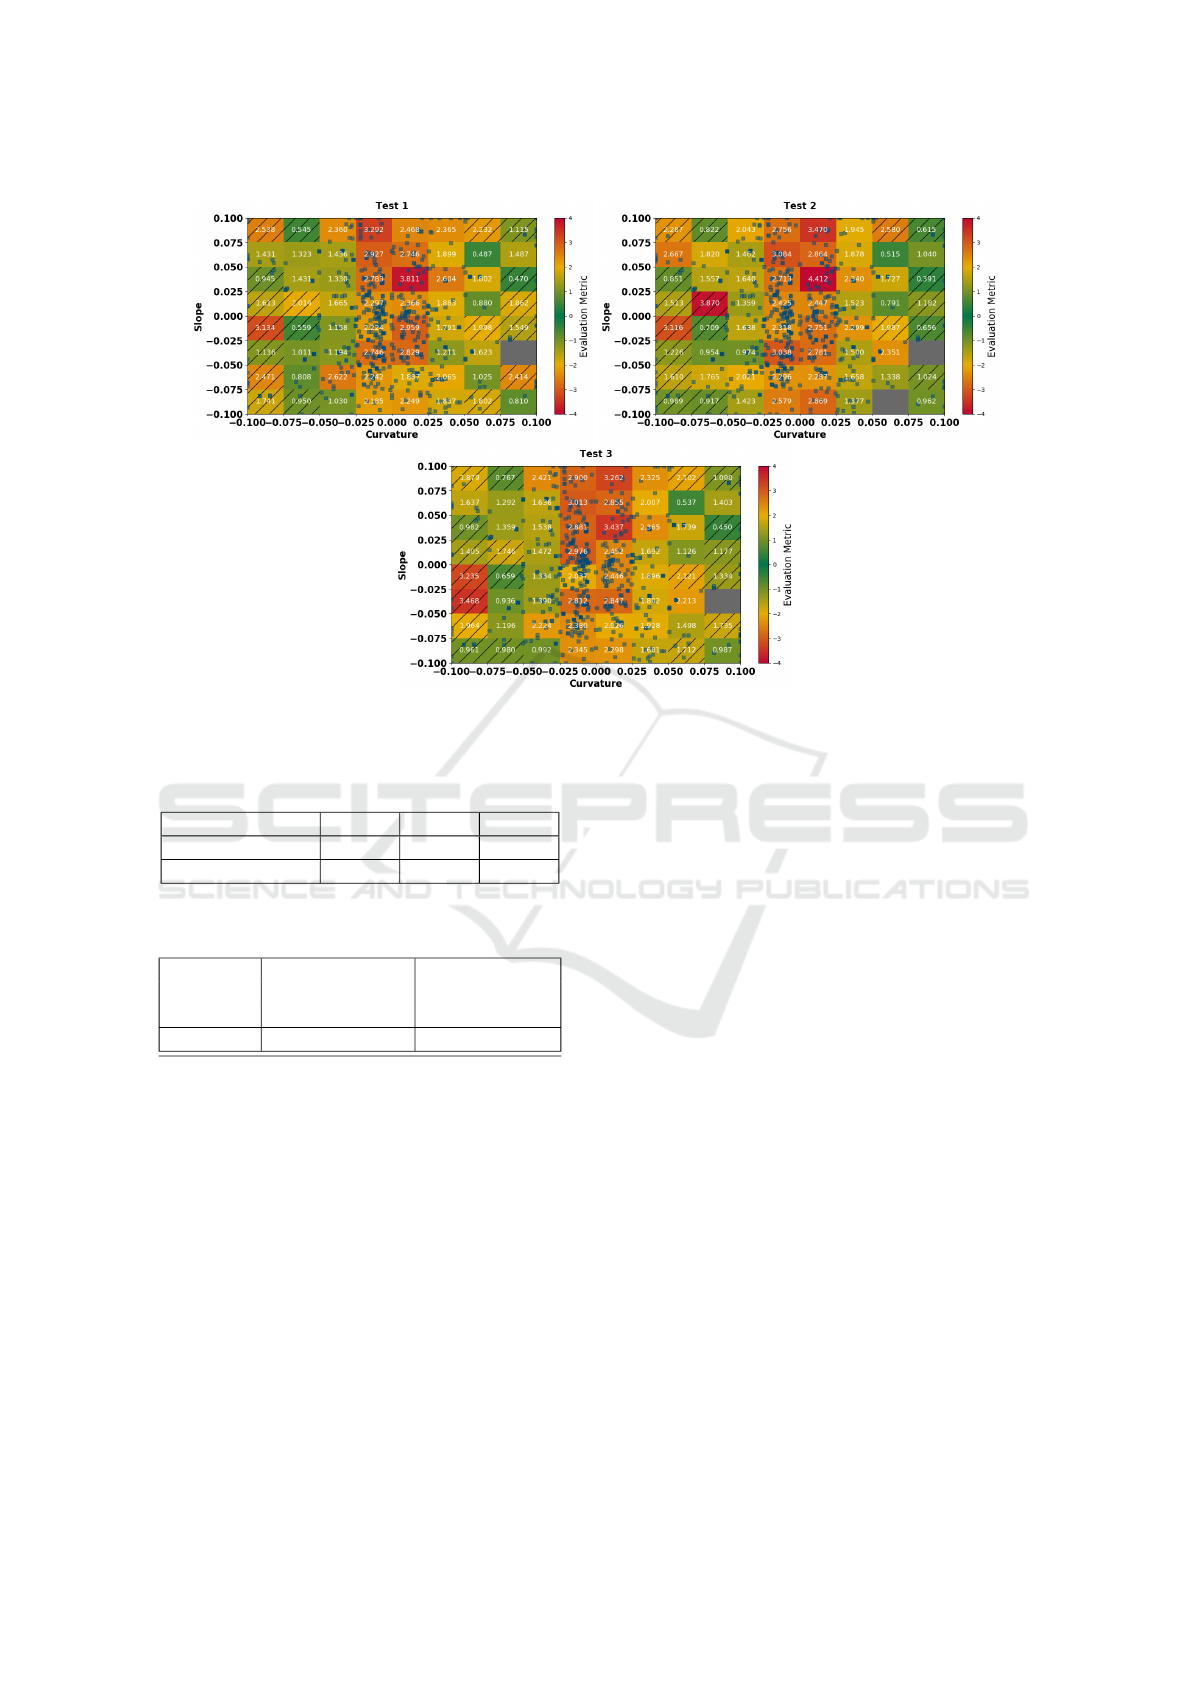
Figure 8: Comparison of Three Different Test Results Using a Binning of the Curvature-Slope Attribute Space.
Table 1: Holistic Evaluation Results for the Three Different
Tests Using a Normal Arithmetic Mean and the Weighted
Mean Based on the Derived Weighting Factors.
Test 1 Test 2 Test 3
Arithmetic mean 1.9708 1.9469 2.0071
Weighted mean 2.4047 2.4257 2.3823
Table 2: Comparison of Arithmetic Mean and Weighted
Mean with Results for the Complete Data Pool.
Complete Small test Small test
data scope with scope with
pool arithmetic mean weighted mean
2.6525 1.8356 2.6572
factors from the complete data pool, the results look
different. Groups in the center are weighted heavier as
they are more frequent in real world traffic and there-
fore have a higher impact on the overall feature per-
formance. For the weighted mean using the global
weighting factors Test 3 is the best result. These re-
sults show that the arithmetic mean on smaller testsets
does not provide a globally valid evaluation result. By
using the weighting factors a different test was identi-
fied as optimal. Furthermore, all results are relatively
worse than their local arithmetic means. Meaning, by
using the weights the different distribution of driving
task occurrences in the smaller testset has been com-
pensated.
In order to verify the correct representation of the
complete data pool through the weighting factors, we
used the same control parameters and software ver-
sion on a smaller test scope as well as on the com-
plete data pool. The single instances for both setups
are depicted in Figure 9. By calculating the holis-
tic evaluation results with and without the weighting
factors, we can show that the approximation with the
weighting factors matches better to the overall result.
Table 2 shows the results for the comparison. The
weighted mean approximates the global mean accu-
rately whereas the arithmetic mean for the small test
scope is not representative for the holistic feature per-
formance.
6 CONCLUSION & FUTURE
WORK
Testing and evaluation are crucial parts of the fea-
ture development. Especially for complex control fea-
tures, a lot of effort is put into exhaustive testing.
However, holistic assertions based on test scopes that
are feasible during development are far from repre-
sentative. The proposed approach takes these lim-
ited test scopes into account and provides a systematic
way to extrapolate these test results towards a globally
valid assertion.
With the help of driving tasks, the complete test
drives are separated into semantically coherent situ-
ations that are then evaluated independently. Thus,
delivering direct feedback towards software modules
Qualitative Feature Assessment for Longitudinal and Lateral Control-features
121
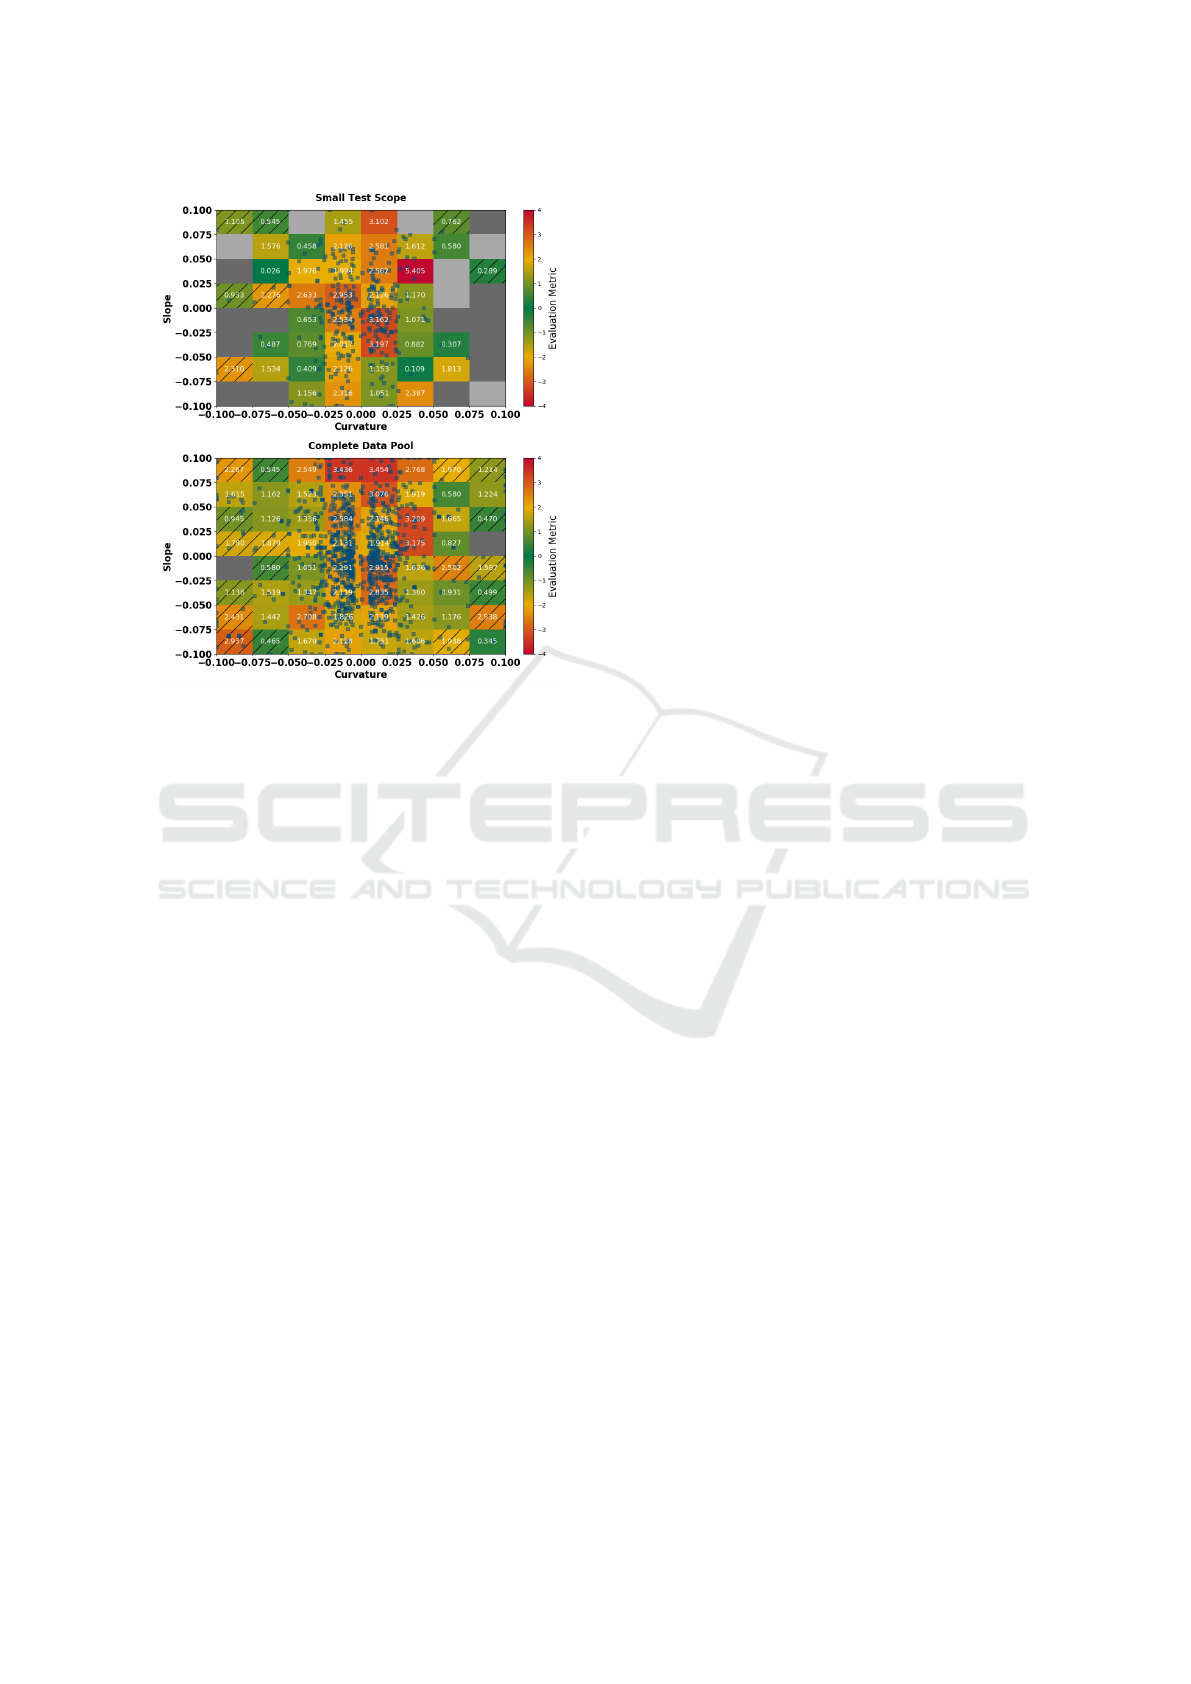
Figure 9: Test Results for the Verification of the Derived
Weighting Factors Using the Same Control Parameters and
Software Version on a Small Test Scope as Well as One the
Complete Data Pool.
and control parameters responsible for handling these
situations. A ground truth distribution for the possi-
ble variations of each driving tasks has been derived
from the complete data pool and is used as a weight-
ing factor for smaller test scopes. The results differ
significantly taking the weighting factors into account
achieving a more realistic and representative evalua-
tion.
In the future we will look further into approxi-
mating the high dimensional attribute spaces for the
driving tasks. We have already looked at different ap-
proaches to sample the attribute spaces. Several clus-
tering approaches have failed to give a good repre-
sentation in the high dimensional space. For combi-
natorial approaches, the full factorial design results
in too many combinations. A feasible but still valid
reduction is required. While binning the two dimen-
sional attribute spaces works for most driving tasks,
we will look for other methods in the future. In terms
of binning, quantile binning may be able to handle
sparse and distorted distributions better than conven-
tional binning.
REFERENCES
Albers, A., D
¨
user, T., Sander, O., Roth, C., and Henning,
J. (2010). X-in-the-loop-framework f
¨
ur fahrzeuge,
steuerger
¨
ate und kommunikationssysteme. ATZ elek-
tronik, 5:60–65.
Albrecht, M. and Holz
¨
apfel, M. (2018). Vorausschauend
effizient fahren mit dem elektronischen co-piloten.
ATZextra, 23(5):34–37.
Bach, J., Otten, S., Holz
¨
apfel, M., and Sax, E. (2017).
Reactive-replay approach for verification and valida-
tion of closed-loop control systems in early develop-
ment. In SAE Technical Paper 2017-01-1671.
Bourque, P., Fairley, R. E., et al. (2014). Guide to the soft-
ware engineering body of knowledge (SWEBOK (R)):
Version 3.0. IEEE Computer Society Press.
Conrad, M., Fey, I., and Sadeghipour, S. (2005). Sys-
tematic model-based testing of embedded automotive
software. Electronic Notes in Theoretical Computer
Science, 111:13–26.
DAF (03.01.2020). Daf – predictive cruise control.
de Gelder, E. and Paardekooper, J.-P. (2017). Assessment
of automated driving systems using real-life scenarios.
In Intelligent Vehicles Symposium (IV), 2017 IEEE,
pages 589–594. IEEE.
ISO, I. (2011). 26262: Road vehicles-functional safety. In-
ternational Standard ISO/FDIS, 26262.
Junietz, P., Schneider, J., and Winner, H. (2017). Metrik
zur bewertung der kritikalit
¨
at von verkehrssituationen
und-szenarien. In 11. Workshop Fahrerassistenzsys-
teme.
Langner, J., Bach, J., Otten, S., Sax, E., and Holz
¨
apfel, M.
(2017). Framework for using real driving data in au-
tomotive feature development and validation. In 8.
Tagung Fahrerassistenz, M
¨
unchen.
Oral, H. A. (2013). An effective modeling architecture for
mil, hil and vdil testing. SAE International Journal
of Passenger Cars-Electronic and Electrical Systems,
6(2013-01-0154):34–45.
Sax, E., editor (2008). Automatisiertes Testen eingebetteter
Systeme in der Automobilindustrie. Hanser, M
¨
unchen.
Shalev-Shwartz, S., Shammah, S., and Shashua, A. (2017).
On a formal model of safe and scalable self-driving
cars. arXiv preprint arXiv:1708.06374.
Shokry, H. and Hinchey, M. (2009). Model-based verifica-
tion of embedded software.
Wachenfeld, W. and Winner, H. (2016). The release of au-
tonomous vehicles. In Autonomous Driving, pages
425–449. Springer.
Zofka, M. R., Kuhnt, F., Kohlhaas, R., Rist, C., Schamm,
T., and Z
¨
ollner, J. M. (2015). Data-driven simulation
and parametrization of traffic scenarios for the devel-
opment of advanced driver assistance systems. In In-
formation Fusion (Fusion), 2015 18th International
Conference on, pages 1422–1428. IEEE.
VEHITS 2020 - 6th International Conference on Vehicle Technology and Intelligent Transport Systems
122
