
Intelligent Regulation System to Optimize the Service Performance of
the Public Transport
Nabil Morri
1,3 a
, Sameh Hadouaj
2,3 b
and Lamjed Ben Said
3c
1
IT Department, Emirates College of Technology, Abu Dhabi, U.A.E.
2
Computer Information Systems Department, Higher Colleges of Technology, U.A.E.
3
SMART Lab., Institut Supérieur de Gestion de Tunis, Université de Tunis, Tunisia
Keywords: Multi-agent Systems, Public Transportation, Regulation System, Optimization, Key Performance Indicators.
Abstract: The urban public transport systems deal with dynamic environments and evolve over time. Frequently, we
dispose of a lot of correlated information that is not well exploited to improve the public transport quality
service, especially in perturbation cases where a regulation system should be used in order to maintain the
public transport scheduled time table. The quality service should be measured in terms of public transport key
performance indicator (KPI) for the wider urban transport system and issues like regularity, punctuality and
correspondence criteria. In fact, in the absence of a set of widely accepted performance measures and
transferable methodologies, it is very difficult for public transport to objectively assess the effects of specific
regulation system and to make use of lessons learned from other public transport systems. Unfortunately,
most of the existing traffic regulation systems do not take into consideration part or most of the performance
criteria when they propose a regulation maneuver. Therefore, the applicability of these models is restricted
only to specific contexts. This paper sets the context of performance measurement in the field of public traffic
management and presents the regulation support system of public transportation (RSSPT). The aim of this
regulation support system is (i) to detect the traffic perturbation by distinguishing the non-equability of
scheduled and the current time table of vehicle passage at the station (ii) and to find the regulation action by
optimizing the performance of the service quality of the public transportation. We adopt a multi-agent
approach to model the system. The validation of our model is done by simulating two scenarios on Abu Dhabi
transport system and shows the efficiency of our system when we want to use many performance indicators
to regulate a disturbance situation.
1 INTRODUCTION
The study of public transportation systems has
changed significantly during recent years in modeling
and simulation. In particular, the increasing use of the
vehicle and the amplification of the public transport
system, make traffic management more complex.
This complexity is due to the difficulty of respecting
the scheduled timetable of vehicle passage and the
emergence of random phenomena that disturbs the
network traffic of vehicle. Thus, to improve the
quality service of public transport, we have to design
and build a regulation support system that detects
disturbances and regulates the traffic of public
a
https://orcid.org/0000-0002-1642-9309
b
https://orcid.org/0000-0002-6743-4036
c
https://orcid.org/0000-0001-9225-884X
transport. The quality service should be measured in
terms of public transport key performance indicators
(KPIs).
Against this perspective, modeling and simulating
such systems show real problems because there is no
clear knowledge of the notion of KPIs and no
common framework standard of quality in public
transport.
Moreover, the current methods and simulation
tools don’t combine various KPI measures into a
single performance value, potentially covering
multiple dimensions or goal categories. Nowadays,
several types of research have been carried out in the
field of the regulation of public transport; (Newell
416
Morri, N., Hadouaj, S. and Ben Said, L.
Intelligent Regulation System to Optimize the Service Performance of the Public Transport.
DOI: 10.5220/0009416104160427
In Proceedings of the 22nd International Conference on Enterprise Information Systems (ICEIS 2020) - Volume 1, pages 416-427
ISBN: 978-989-758-423-7
Copyright
c
2020 by SCITEPRESS – Science and Technology Publications, Lda. All rights reser ved

and Potts, 1964) studied for the first time the
management of bus disturbances. On the basis of a
simplified model, the authors proved the instability of
a line by the approximation of the buses without
studying the coordination between the vehicles of
different lines.
The regulation strategies are usually based on
scheduling control and try to reduce the number of
buses by adjusting bus schedules. This is based on an
analysis of the cause of the disturbance (Moreira-
Matias et al., 2012) (Verbich et al., 2016), as well as
its impact on calendar-based traffic (Newell, 1977)
(Zhao et al., 2006) (Feng and Figliozzi, 2011)
investigated the main causes of the disturbance and
recommended switching from static regulation based
on a scheduled time table (TMT) to a dynamic
regulation based on the frequency of buses of the
same line. An important problem of this approach is
to find a compromise between the regularity and the
optimal frequency of the service.
The regulation strategies have become more
interesting with the availability of real-time data
provided, such as the Automatic Vehicle Locator
(AVL) systems. Previous to this, most control
methods used decision models that included only bus
arrival times at stops. The works of regulation
systems made in real-time differ in the techniques and
data used. The regulations of this strategy can be
divided into two categories: regulation at stations and
inter-station regulation.
In the first category, the action is carried out at the
station as waiting at a station to regulate only
punctuality. Other criteria like regularity or taking
account of the transfer time in changing the line for
the passenger are neglected. For example, the
research by (Gershenson and Pineda, 2009) is based
on the static exploitation of time and minimum and
maximum waiting time and (Newell, 1974)
(Zolfaghari et al., 2004) (Bartholdi and Eisenstein,
2012) which are based on the dynamic exploitation of
boarding times and the limitation of downtime
(Dwell: time spent by the vehicle at station). Dynamic
strategies are advantageous over static strategies. We
found that dynamic strategies may require up to 40%
less downtime in the schedule (Xuan et al., 2011),
which increases the scheduled commercial speed of
the trip based on AVL data in real-time.
However, in the second category, the control is
done on the links between stations, like the control of
the speed of bus (Pilachowski, 2009) (Daganzo and
Pilachowski, 2011) (He, 2015), the overtaking of
buses or priority mechanisms for traffic signals for
public transit (Albright and Figliozzi, 2012) (Bhouri
et al., 2011). These approaches do not take into
account the real cause of the disturbance.
Based on the above analysis we can conclude that
most of the existing traffic regulation systems do not
take into consideration part or most of the
performance criteria when they propose a regulation
maneuver. Therefore, the applicability of these
models is restricted only to specific contexts.
This paper sets the context of performance
measurement in the field of public traffic
management and presents the regulation support
system of public transportation (RSSPT). The aim of
this regulation support system is to detect the traffic
perturbation by verifying the adequacy between the
planned and the current performance measures and
find the most appropriate regulation action by
optimizing the performance of the service quality of
the public transportation. We adopt a multi-agent
approach to model the system.
This paper is organized as follows. Section 2
introduces and discusses the state of the art of
performance measures. Section 3 describes our
regulation process and the Multi-Agents System
design. Section 4 defines the optimization problem.
Section 5 validates our model by providing
experimentation and result of two reels scenarios
happened in Abu Dhabi transport system. In section 6
we conclude and give some perspectives.
2 STATE OF THE ART OF
PERFORMANCE MEASURES
2.1 Literature Review
The performance of the public transport service is
considered one of the main issues influencing the
level of passengers’ satisfaction. There is abundant
literature on various aspects of key performance
indicators. This review describes selected papers that
focus on the models of passengers’ waiting time at the
station and the suggested regulation strategies for
improving the performance service. Several
publications offer quantitative measures of
performance in regard to the public transportation
service.
(Mark Trompet et al. 2011) evaluates the
performance by the excess waiting time (EWT:
Excess wait time). This indicator is defined as the
difference between the actual waiting time (AWT)
and the scheduled waiting time (SWT). Moreover, in
(M. Napiah et al., 2015) and (Mark Trompet, 2010),
this performance is defined by the average waiting
Intelligent Regulation System to Optimize the Service Performance of the Public Transport
417

time expected by passengers. This indicator
calculates the perceived regularity that measures the
average additional waiting time of passengers. In fact,
the low EWT means that the performance of the
service is fairly regular.
(Oded Cats et al., 2010) defines the performance
by the deviations of the time intervals observed
between the trips of the same line with respect to the
regular frequency of the vehicles during a given
period. This indicator is calculated as a standard
deviation between the observed frequency and the
programmed frequency. In addition, in other specific
projects, to give more meaning to the evolution of the
performance during abrupt changes in the transport
traffic state, (M. Napiah et al., 2015), (Mark Trompet,
2010) and (Oded Cats et al., 2010) provide another
complementary definition for performance. This
performance is defined as a percentage of deviations
that no longer deviate from a quantity in absolute
minutes. It represents the coefficient of variation.
(Neila Bhouri et al., 2016) and (Gay H. et al.,
1991) describe the Gini index as another indicator by
regularity index. Economists and sociologists use the
Gini ratio to measure the degree of income inequality
within groups of people. By analogy in the field of
public transport, the authors measure by this ration
the degree of inequality of performance within a
group of trips of the same line to quickly detect the
abnormal phenomena that disturb the traffic. (S.
Carosi a, et al., 2015) describes regularity as an index
based on vehicle entries at stations. This indicator is
specific to a line. Its formula is expressed as a
percentage of unpunctual vehicle entries in relation to
the total number of planned entries at the stations.
Other projects define the punctuality as another
indicator that determines the performance.
(Noorfakhriah Y. and Madzlan N., 2011) defines the
punctuality as a comparison of the actual departure
times and scheduled departure times at the station. In
(Xumei Chen et al., 2009) the authors distinguish
three types of punctuality measures: the Punctuality
Index based on Routes (PIR), the Deviation Index
based on Stops (DIS) and the Evenness Index based
on Stops (EIS). The PIR is defined as the probability
that a bus will arrive at the terminals during a given
period. The DIS is the ability to maintain distances
and minimize the typical waiting time of a passenger
at the stop, while the EIS is the ability to determine
the consistency and balance of the distance between
the vehicles. However, in (Vaniyapurackal, 2015),
the author considers the punctuality index for a race,
P = 0 if the bus arrives on time in all the stations of its
trip and P = 1 if the bus does not arrive on time at all
stations. For convenience, the punctuality index, P
can be converted to percent for as in P (%) = (1 - P) ×
100 to define the proportion of the trip that was
punctual.
In (Saberi, Meead, et al., 2013), three alternative
performance measures are proposed: Earliness Index
(EI), Width Index (WI), and Second-Order Stochastic
Dominance Index (SSD). These indices are used in
two forms to capture the characteristics of the
unreliability of bus service: (i) the distribution of the
time interval deviations of trips for frequent services,
(ii) the distribution of delays for non-frequent
services.
(Ceder, 2007) adds the transfer time as another
indicator. This indicator covers the time spent when
the passenger is waiting for the vehicle in changing
the line at a connecting station. Other authors add the
running time (time needed to change stop by walking
in the transfer station) in the calculation of the transfer
time.
(Zhenliang, 2013) details and explains the
formula of the Headway Buffer Time. This indicator
indicates the additional travel time required to allow
passengers to arrive on time. It can be used to capture
the additional unreliability caused by an incident.
The authors of (Kenneth et al., 2004) (TRT, 2017)
and (Levinson, Herbert, 1983) examine another
indicator called "Dwell" which is the bus downtime
at stations including terminuses. This indicator refers
to the time a vehicle, such as a bus or a train, goes to
a stop without moving. In general, this time is spent
onboarding or on embarking passengers, but it can
also be used to wait for traffic to be restored (Vu The
Tran et al., 2012) (Cats et al., 2011). For example
when the regulator wants to coordinate between trips
in the transfer station or to be equal as possible to the
scheduled time table.
2.2 Discussion
According to the literature review presented above,
there is no standard significance of the key
performance indicators. The challenge in defining
KPIs is to select the right ones that will give a
sufficient accepting of overall performance on public
transportation. To define KPIs, four strategic themes
in the urban traffic management and the Intelligence
Transportation System (traffic efficiency, traffic
safety, pollution reduction, and social inclusion and
land use) are presented in the white papers by the
European Commission’s strategy on the future of
transport (European Commission, 2011). Also, these
indicators are classified according to objectives in
(Theuns Henning et al, 2011). For benchmarking
purposes, a number of KPIs must be chosen to cover
ICEIS 2020 - 22nd International Conference on Enterprise Information Systems
418
the most critical aspects of public transport from a
user's point of view. In the context of this study, we
tackle only KPIs of traffic efficiency. The index of
traffic efficiency represents three major KPIs: (i)
punctuality for the respecting theoretical schedules at
stations, (ii) the regularity for the respecting of the
scheduled headway, and (iii) the correspondence for
the respecting of the scheduled transfer time of the
passengers in the transfer station. Consequently, we
standardize all performance criteria presented in the
literature into three main KPIs: punctuality,
regularity, and correspondence. We describe the
formulas of these performances in section 4.
Moreover, goals and objectives should be clear,
concise, and achievable, in order to model the good
performance formula for the regulation process.
Indeed, the performance of public transport is an
abstract term. In order to include performance
considerations in a detailed engineering public
transportation design and to evaluate the differences
between existing and suggested service alternatives,
it is necessary to describe it in mathematical terms. In
fact, with a mathematical function, we can apply an
optimization approach to the performance formula to
reach the target. In addition, the main drawback of
possible real-time performance regulation actions is
the lack of prudent modeling and software that can
activate automatically or semi-automatically these
actions. Hence, build a regulation system to optimize
the service performance based on key performance
indicators in case of perturbation becomes an absolute
necessity.
3 THE REGULATION SYSTEM
OF PUBLIC TRANSPORT
3.1 Regulation Process
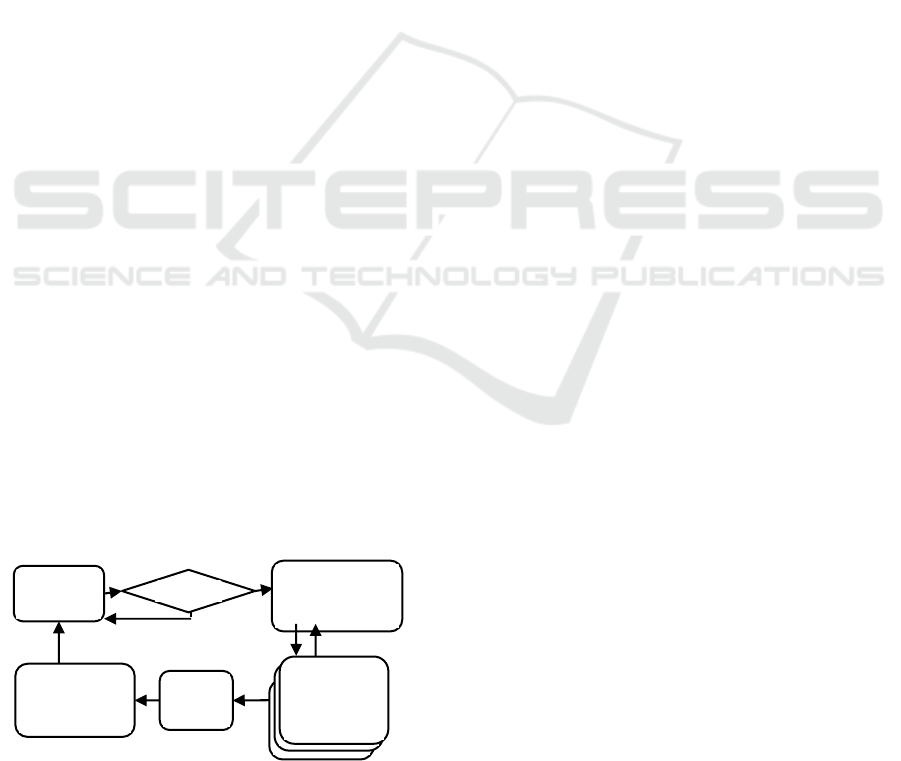
The below figure 1 describes the regulation process
of our system.
Figure 1: Regulation process in our RSSPT.
This process involves five steps:
Operations supervision: In this step, races are
monitored to see if everything is going as
planned. The same thing happens for boarding
passengers. the surveillance is done on route
and at station after gartering information from
(i) the Automatic vehicle location Module
(AVLM) that is the GPS vehicle tracking
system that continuously records and
automatically transmits the geographic location
and the speed of a vehicle, and (ii) detectors or
loops to provide the properties of roads (length,
speed max, density max, and current density)
and station (passenger embarking and
passenger boarding flow).
Disturbance identification and evaluation: If an
event occurs, for example, if an accident or
works take place on a road, a rapid assessment
is performed to determine if a regulation action
is required. Otherwise, monitoring continues.
The detection is based on the impact of the
performance variability of the KPIs.
Evaluation of possible regulation actions: the
system selects the possible regulation actions
from the existing list by using a classification
method. This list is defined and updated by
experts. An example of this list can be found in
(Froloff et al., 1989).
Decision making: After filtering out possible
solutions, a decision must be made by using an
optimization resolution then, the system
chooses the adequate action.
Implementation of Decision: After choosing
the decision, it must be applied to the
environment with the update of the operational
plan.
3.2 Multi-agent Design
3.2.1 Multi Agents System for Regulation
Support System Modeling
Multi-agent modeling can give a suitable solution to
public transport network activities where autonomous
entities, called agents, interact with each other in a
distributed, open, heterogeneous and dynamic
environment. We note that multi-agent systems are
increasingly present in the field of traffic regulation.
The following is a short description of the main
characteristics for public transport regulation system:
Distributed: the information is geographically
dispersed over the network requires distributed
agents.
Deviation
Yes
No
More actions
Operations
supervision
Disturbance
identification and
evaluation
Conflict?
Evaluation of
possible
regulation
Decision
making
Implementation
of Decision
Intelligent Regulation System to Optimize the Service Performance of the Public Transport
419
Dynamic: there is a daily change of
information, for example, a vehicle can move
forward, slow down, accelerate and
communicate its passage with other agents like
stations. As well, when the operator detects
perturbation, a new state should be introduced
in the traffic network and derive the bus to
another route as regulation action.
Open: the vehicles can enter or exit the traffic
network.
Heterogeneous: The actors of the system are
varied with different natures: vehicle, station,
regulator, etc.
These entities can reason, communicate via
messages to solve conflicts and reach the best
solution. These characteristics demonstrate that the
use of the multi-agents system in regulation support
system modeling has the advantages of introducing
more flexible and efficient representation in the
processes that it models.
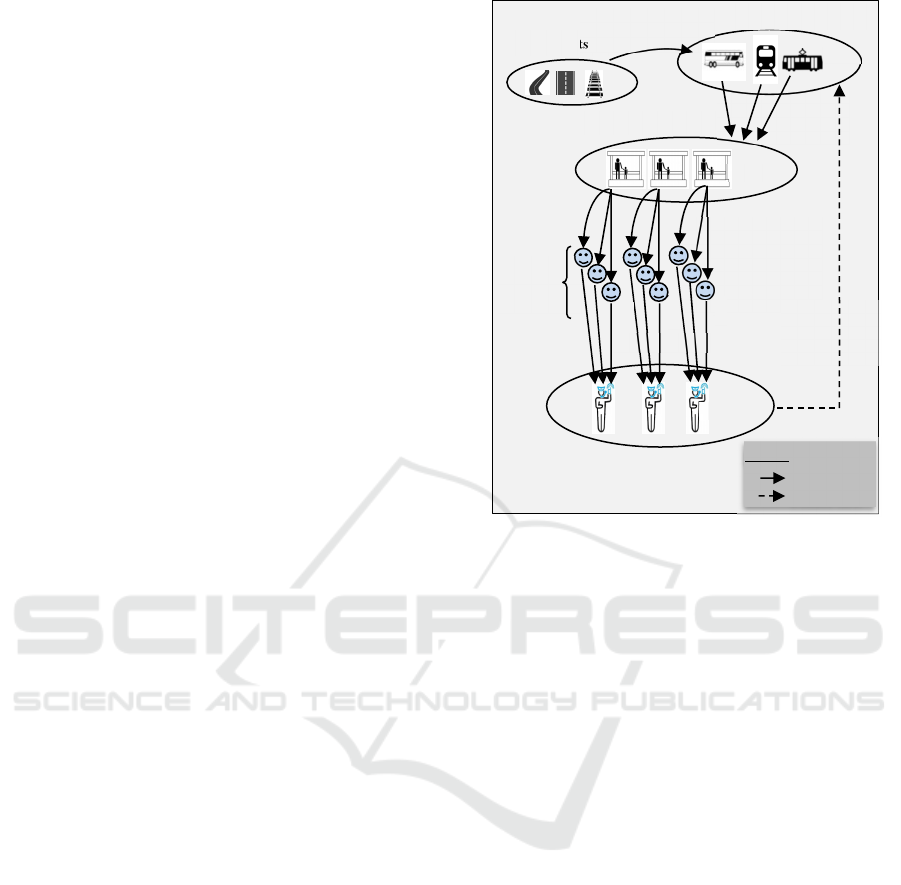
3.2.2 Knowledge Components Modeling
The proposed system provides a baseline modeling to
the system knowledge components independently of
the performance model. In order to construct the
system as a whole, we explore separately each agent
with its both interactions “agent-agent” and “agent-
environment”; this will also make it easier to define
the system’s elements. The proposed multi-agent
model is composed of the following agents: vehicle,
link, station, criteria, and regulator. We describe the
behavior and the interactions of each agent in the
following figure (figure 2).
The agents are described as follows:
Vehicle: Vehicle agent memorizes all its
properties such as position, type (bus, metro,
and tramway), speed, capacity, number of
passengers, line, mission (school bus, special,
and passenger), driver, and the properties of the
current link. Then, these data are sent to the
concerned agents: Station.
Station: It represents a departure or arrival of
one or more links. It must memorize all
scheduled and real passage hours of vehicle. It
calculates the delayed time for the arrived
vehicle. Then it creates the necessaries KPI
agents for each coming vehicle and sends to
them the calculated delayed time and the
waiting passenger number to calculate the key
performance criteria value.
Figure 2: Multi-agent architecture of RSSPT.
Link: It represents the connection between two
consecutive stations. It should be related at
least to one line. It memorizes two types of
information: static properties (length, speed
max, and density max) and dynamic properties
(average of vehicle speeds and current density).
These data are sent to the Station agent to
estimate the needed time of the delayed vehicle
to reach the station.
KPI: It calculates the value of the Key
Performance Indicator and sends it to the
regulator agent.
Regulator: Each "regulator" agent is
responsible for a geographical area of the
network. It receives the KPI values of each
disturbed vehicle. Then it defines the
perturbation cause (vehicle breakdown, exceed
parking time, driver uneasiness, an accident on
the road, etc.) and follows an optimization
process to find the regulation action. The
optimization process is explained in section 5.
A unique characteristic of this model is that the
same agents are used to ensure the detection and the
regulation process. This makes the model simpler and
solves the problem of data duplication. The KPIs used
in the regulation process can be adjusted according to
the needs of the optimization problem.
Vehicle Agents
Station Agents
Vehicle and link
properties
Delays, scheduled
Time table,
Waiting time
KPI
Agents
Link Agents
Static & dynamic
properties
Regulation
action
Legend
Data flow
Control flow
Criteria
Regulator Agents
ICEIS 2020 - 22nd International Conference on Enterprise Information Systems
420

4 OPTIMIZATION RESOLUTION
4.1 Linear Programming Optimization
This section introduces the notion of optimization,
using operations research (OR) principles and
methods. Optimization usually means finding the best
solution to some problem from a set of alternatives
respecting constraints. Formally, an optimization
problem can be described by a set U of potential
solutions, a set L
U of feasible solutions, and an
objective function F: L → IR. In the regulation
problem, we are looking for regulation maneuver x
∗
∈
L that minimizes the value of the objective function
F overall feasible solutions. There is a list of feasible
regulation actions that can be used to handle public
transport traffic. This list should respect the
constraints of the optimization problem.
In an existing problem, F is arbitrary and the
question is whether the set of feasible solutions is
nonempty. The optimization should take into account
all KPIs and constraints fixed by experts of the traffic.
We present a method that can be applied to regulate
different traffic perturbations. This method is inspired
by the work of
(Hartani, 1995)
In the RSSPT, a linear program with n criteria
(KPIs) and m constraints is a minimization problem
defined on a vector x=(x
1
,...,x
n
) of real-valued KPIs.
The objective function is a linear function F of x, i.e.
F : IR
n
→ IR with F(x)=c*x, (1)
Where c = ( c1,..., cn ) is called cost vector. It is
relative to the importance of different KPIs. E.g.
punctuality criteria for buses of low-frequency lines
(large headways) is more important than regularity
while regularity for buses of high-frequency lines
(large headways) is more important than punctuality,
against keeping good transfer time criteria is more
interesting for lines presented transfer stations with a
high passengers’ crowding. The variables are
constrained by m linear constraints of the form:
a
i
*x
⋈
i
b
i
, Where
⋈
i
∈
{≤,≥,=}, a
i
= (a
i1
,...,a
in
)
∈
IR
n
, and b
i
∈
IR
f
or i
∈
1..m.
(2)
Consequently, the vector of criteria values of the
feasible solutions is given by:
L={x
∈
IR
n
:
∀
i
∈
1..m and j
∈
1..n: x
j
≥
0
∧
a
i
*x
⋈
i
b
i
}
(3)
4.2 Optimization Formulas
4.2.1 Formulation of the Optimization
Function
We establish the three KPIs related to traffic
efficiency: punctuality, regularity, and
correspondence for the delayed vehicle.
They are
based on
passengers’ waiting time at the station.
These measures are applicable essentially when it is
assumed that passengers go to the station without
expectations of boarding a particular vehicle at a
particular time (i. e., those passenger arrivals are
Poisson distributed) We formulate the objective
function as follows:
𝐹𝑊
.𝑉
𝑊
.𝑉
𝑊
.𝑉
(4)
Here, the W
, W
and W
represent the
weight (cost) of the criteria in the calculation of the
performance value. It is necessary that: W
W
W
1. To calculate the weights, an
experimental method is suggested capable of
achieving a twofold objective: (i) to provide a
methodology for constructing a measure of
performance that can be adapted to any plan or
transport program, and (ii) providing a methodology
that can be transferred between projects. The
technique chosen by the experts is the Delphi method
(Linstone HA and Turrof M, 1975) .
Punctuality criteria: Punctuality is defined in
(Noorfakhriah Y. and Madzlan N., 2011) as a
comparison of actual departure times with expected
departure times at the station. Its formula is:
𝑉
with
𝑆
1
𝑛
∑
𝑡
𝑖
𝑡
𝑡
2
𝑛
𝑖1
(5)
n: the number of vehicles of the same line
arriving at the station in a defined period.
h
:
∑
t
t
the average headway for
n vehicles.
t
: the actual arrival time of the i-th vehicle.
t
: the scheduled arrival time of the i-th vehicle.
Regularity criteria: It measures the differences in the
time intervals observed between successive vehicles
of the same line with respect to the scheduled
headway. Its formula is:
𝑉
with
𝑆
∑
ℎ
ℎ
(6)
n: the number of vehicles of the same line
arriving at the station in a defined period.
h
i
: t
i
– t
i-1
(i=2,…I), the current headway of the
i-th vehicle.
h
: the scheduled headway of the i-th vehicle.
Intelligent Regulation System to Optimize the Service Performance of the Public Transport
421

Correspondence criteria: The correspondence
criterion signifies the differences between the
observed correspondence values with those of the
scheduled correspondence. His formula is as follows:
𝑉
̅
wit
h
𝑆
∑
𝑐
𝑐
(7)
n: the number of vehicles of the same line
arriving at the station in a defined period.
c
: the current correspondence of the i-th
vehicle.
c
: the scheduled correspondence of the i-th
vehicle.
𝑐̅ : the average of the correspondence for the n
vehicles.
The current correspondence value 'c
i
' (or the
scheduled 'c
t
') of the i-th vehicle is the sum of the
waiting time between the vehicle 'i' and all coming
vehicles to the transfer station. It is equal to:
𝐶
𝑓
(8)
𝑓
determines the importance factor of the vehicle
'j' which is in connection with the vehicle 'i'. This
factor is calculated by experts according to the
passengers waiting time of in the connection station
for the vehicle in connection "j"[19]. It is necessary
that:
𝑓
||
1
(9)
And
represents the gap time in relation to the
scheduled waiting time of i-th connecting vehicle. It
is equal to:
𝑡
𝑡
(10)
𝑡
is the current arrival time for the vehicle 'i',
while 𝑡
is the current departure time for the vehicle
in connection 'j'.
4.2.2 Formulation of the Constraints
The following constraints, based on (Ceder, 2007),
are accompanied by the following data notations and
assumptions.
H
: minimum headway in the i station.
H
: maximum headway in station i.
t
: t
t
time between the departure time t
of station j and the departure time t
of station
i. i and j represent respectively the two
successive stations of the link l
.
T
: estimated total travel time i.
T
: scheduled total travel time i.
N
: number of performed trips in station i.
V
: punctuality value in station i.
V
: permitted punctuality max value in
station i.
V
: regularity value in station i.
V
: permitted regularity max value in
station i.
The problem is feasible under the following
constraints:
I
I
(11)
I
minI
,I
(12)
t
N
.H
(13)
t
N
1
.H
(14)
T
T
with T
T
n∗
I
(15)
These constraints are mandatory in order to verify
the following:
not to exceed the maximum regularity value
permissible limit (equation 11).
the next trip does not catch up with the
regulated trip (equation 12).
the departure time at each station i does not
exceed the maximum hour allowed during a
regulation (equation 13).
respect the minimum regularity between the
vehicles of the same line (equation 14).
not to exceed the maximum time allowed for a
given trip (equation 15).
As a hypothesis, it is assumed that the first
departure for each trip must take place in the interval
[0, 𝐼
] in order to have not a conjunction of two
consecutive trips in the starting station.
4.3 Regulation Algorithm
The regulation process begins after the detection of
perturbation. In the following algorithm, pre-
conditions are defined which correspond to the
optimization constraints:
Algorithm 1: Regulation.
Iutput:
- Actual status of traffic network,
scheduled and real timetable of
public transport.
Output:
- Regulation action
begin
repeat
ICEIS 2020 - 22nd International Conference on Enterprise Information Systems
422
- Station Agent receives the
necessaries information from Vehicle
and link Agents
- Station Agent calculates the waiting
time of each coming vehicle
- Each KPI Agent receives the waiting
time of its corresponding vehicle
- Each KPI Agent calculates its
criteria value
- Each Regulator Agent receives all
criteria value of the corresponding
vehicle
- Each Regulator Agent calculates the
performance function “UF” of the
corresponding vehicle
until “F” falls down in the critical
area
- The Regulator Agent fixes the type
of vehicle with their properties
- The Regulator Agent fixes the
incident /*vehicle breakdown,
congestion, driver malaise*/.
- Optimization Module
end
We describe the optimization module in the
following algorithm:
Algorithm 2: Optimization module.
Iutput:
- Vehicle with their properties and
incident
Output:
- Regulation action
begin
switch (Type of vehicle and Incident)
case
- The Regulator Agent checks its
Knowledge Base /* familiar
perturbation, expressed by Basic
facts and Basic rules. */
if (incident exists) then
The Regulator Agent extracts
the list of feasible regulation
actions // use decision tree
The Regulator Agent calculates
the objective function “F” of
each regulation action
The Regulator Agent chooses the
optimal regulation maneuver.
else // new situation
the Regulator Agent produces a
new regulation action using its
expertise
the Regulator Agent updates his
knowledge base.
end
end
end
5 TESTING AND RESULT
5.1 Description
To validate the regulation strategy of our system, we
tested our model on a real traffic network of Abu
Dhabi. The resolution is expressed by an optimization
problem with the objective function F using linear
programming presented below. We used AnyLogic to
simulate traffic scenarios and estimate measures
needed to calculate The KPIs values. AnyLogic is a
program for computer-aided transport planning,
which determines the impacts of existing or planned
supply that can encompass public transportation by
simulating traffic scenarios
(https://www.anylogic.com/). In addition, AnyLogic
combines a dynamic simulation engine for animation
and analytical tools for optimization. By combining
these techniques, it provides models, which allow
both to visualize the animation of the model and its
logical analysis.
The scheduled data are collected from the
department of transport of Abu Dhabi, as well as the
map and the observed data are collected from the
OpenStreetMap as OSM files to model the public
transportation map data like lines, links, stations, and
vehicles.
As described above, the regulation process will be
activated only when F value falls down into a critical
zone. The critical zone is defined by experts of public
transport according to the treated zone of the network
traffic. To prove the efficiency of our system in
different situations, we tested results on two scenarios
of perturbation.
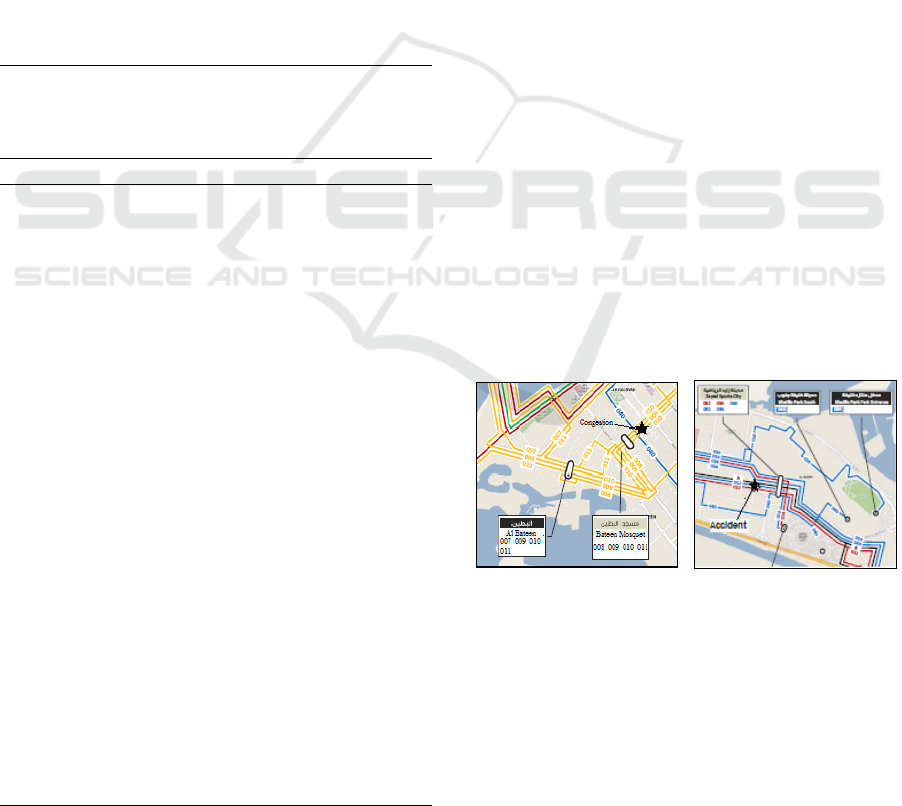
Figure 3: Traffic Network
zone of scenario 1.
Figure 4: Traffic Networ
k
zone of scenario 2.
The first scenario presents perturbation detected
in a station without correspondence (no transfer
station) and the second one presents perturbation
detected in a transfer station. We describe the two
scenarios in the sections below:
Intelligent Regulation System to Optimize the Service Performance of the Public Transport
423
5.2 Scenario 1
Scenario 1 presents traffic congestion in Al Falah
Street due to a school entrance: peak hour (see figure
3). The station represents stop for three lines 008, 009
and 010 that have the same next station in the two
directions. This means that there is no transfer time to
calculate the correspondence KPI. Consequently,
𝑊
0 . In addition, the distribution of criteria
weight gives more importance to the punctuality
criteria. It is due to the existence of many schools in
this area and there is a large main headway (20 min).
After calculating the objective function F of the
coming bus for each line, the regulator detects, at
different times, perturbation for each line 008, 009
and 010 (see table 1).
The system starts its optimization phase by using
the initial objective function value F
start
(see table 2).
Each regulator for each coming bus wants to find the
optimal regulation action with F
opt
value. For each
bus, the list of the feasible regulation actions was
extracted and simulated to let each regulator estimate
the objective function of each feasible regulation
action of each coming bus.
Table 1: Buses Information at Al Bateen Station.
Line
Frequency
Theoretical
time at
Station
Detecting
perturbation
time
Rt
W
REG
W
PUN
W
COR
08 20 07h: 33 a
m
07h: 38 a
m
8 0.25 0.75 0
09 20 07h: 37 a
m
07h: 42 a
m
10 0.25 0.75 0
10 20 07h: 37 a
m
07h: 42 a
m
10 0.25 0.75 0
After optimization, the regulator chooses the
derive maneuver for the three later buses of the three
lines, and accelerates after departure from the station
to reduce the delays and improve the travel time of
the busses (see table 2).
Table 2: Result Values in Regulation Process of Scenario 1.
Line
V
r
Detect.
V
r
Opt.
V
p
Detect.
V
p
Opt.
V
c
Detect.
V
c
Opt.
F
d
F
before
F
start
F
opt
08 25 33 5 13 7 7 4.25 1.25 8.26 6.15
09 25 35 5 15 6.5 6.5 4.13 1.88 9.13 6.63
10 25 35 5 15 7.5 22.5 4.13 1.88 9.13 6.63
In this case, the disturbed bus of line 08 comes 5
minutes earlier with F
opt
=6.15. The F
opt
return
progressively to the target value F
before
(value
corresponding to the theoretical value before
perturbation) and the disturbance was fully regulated
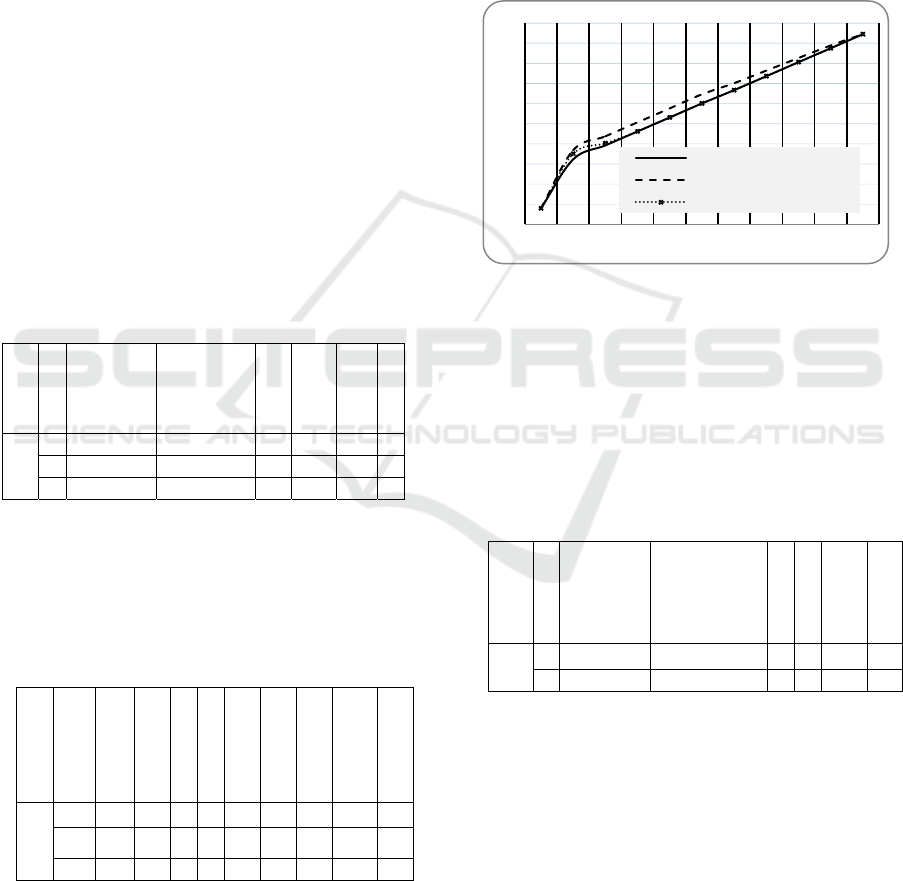
after 10 bus passages at 10h:27 min. We diagram the
regulation process for the bus of line 008 in figure 5.
It presents the three passage times of the bus at Al
Bateen station. This diagram shows that the passage
time curve after the regulation is closer to the
theoretical (scheduled) time passages curve (Bus 08 –
before perturbation) than the passage time curve
without the use of our regulation (Bus 08 – after
perturbation). The same results are obtained for the
other lines (009 and 010) of this scenario.
Figure 5: Time of passages for line 08 bus.
5.3 Scenario 2
Scenario 2 shows perturbation that was detected after
a delay for lines 032 and 052 on Zayed Sports City
station. This delay is due to an accident in the
embassy area (see Figure 4). Buses information and
distributed weights are given in table 3:
Table 3: Buses Information at Zayed Sport City.
Line
Fre
q
uenc
y
Theoretical
time at
Station
Detecting
perturbation
time
Rt
W
r
W
p
W
c
032 20 05h:42 pm 05h:47 pm 22 0.4 0.4 0.2
052 20 05h:38 p
m
05h:43 p
m
17 0.3 0.3 0.4
In this case, the two lines have at station four
correspondences buses for lines 040, 044, 052 and
054. We cite in table 4 all factor values f
i
of
correspondence buses. We note that when buses have
the same direction in the transfer station, the
correspondence factor value is zero (see table 4).
06:00
06:28
06:57
07:26
07:55
08:24
08:52
09:21
09:50
10:19
10:48
1234567891011
PassagenumberatAlBateenstation
Bus08‐Beforeperturbation
Bus08‐Afterperturbation
Bus08‐Afterregulation
ICEIS 2020 - 22nd International Conference on Enterprise Information Systems
424
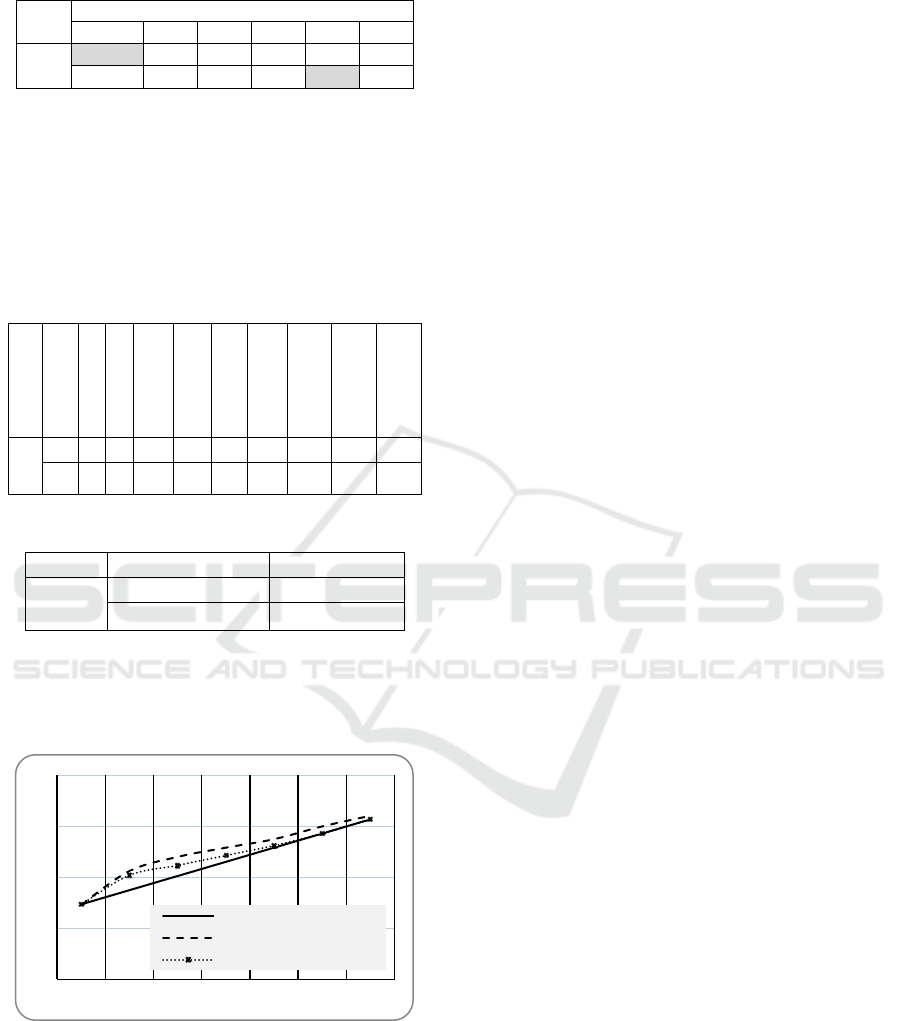
Table 4: Distribution of Factor Values.
Factor Values
f
i
for lines
Line 032 034 040 044 052 054
032 0.40 0.20 0.00 0.4 0.00
052 0.25 0.00 0.20 0.30 0.25
After simulation of the different feasible
regulation actions, the regulator of each coming bus
executes its optimization phase and recommends that
the better action is short-turning. Moreover, in order
to transport passengers witing in Zayed station to the
next one a Short-cut operation is recommended(see
table 5 and 6).
Table 5: Decision after Optimization Phase.
Line
V
r
Detect.
Vr Opt.
V
p
Detect.
V
p
Opt.
V
c
Detect.
V
c
Opt.
F
d
F
before
F
start
F
opt
032 25 39 5 24 13 23 4.61 2.61 17.77 14.21
052 25 31 5 11 16.3 22.5 8.03 2.52 17.13 12.23
Table 6: Result Values in Regulation Process - Scenario 2.
Line U-turn at station Save
032 06h: 03 pm 6 mn
052 06h: 00 pm 11 mn
The diagram of figure 6 proves the efficiency of
our system. The after regulation curve becomes
closer to the before perturbation one (scheduled time
passages).
Figure 6: Time of passages for bus of line 32.
The results of the two scenarios show that F
opt
, on
which the decision is based improves the service
performance of the passenger by minimizing the
travel time of disturbed busses.
6 CONCLUSION AND
PERSPECTIVES
This paper shows that the assessment of the quality of
the solution produced by traffic regulation systems
should be based on public transport key performance
indicators.
The first contribution of this paper has been to
provide an overview of the key performance
indicators measurement and how to compute these
KPIs to regulate perturbation. The second
contribution consists in introducing our Support
System of Public Transport (RSSPT). This system
ensures two phases of regulation: detection of
perturbation and optimization resolution to regulate
the disturbance. To detect perturbation, the system
distinguishes the degradation of the passenger quality
service in terms of waiting time at the station for the
coming busses. The optimization resolution is based
on the performance measures that describe the Key
Performance Indicators (KPIs) of the public
transportation traffic. Our system is based on a multi-
agent approach. It relies on the principle of
coordination between different autonomous agents in
a dynamic, open and complex environment.
To validate our model, we conducted tests by
simulating two perturbation scenarios in a real traffic
network. The obtained results show an improvement
of the performance of the passenger quality service in
perturbation cases.
In perspective, to minimize the development
effort in the optimization phase and avoid the
knowledge bottleneck of network traffic, we have to
improve the system behavior by adding a learning
module that would be used in case of new situations
like unfamiliar perturbations, new traffic parameter,
etc. Therefore, the regulator agent has to use the
outcomes and update its knowledge base to deal with
future situations.
REFERENCES
Newell, G.F. , Potts, R.B. , 1964. Maintaining a bus
schedule. In: Australian Road Research Board (ARRB)
Conference, 2nd, 1964, Melbourne, 2.
Moreira-Matias, L. , Ferreira, C. , Gama, J.A. , Mendes-
Moreira, J.a. , de Sousa, J.F. , 2012. Bus bunching
detection by mining sequences of headway deviations.
In: Advances in Data Mining. Applications and
Theoretical Aspects. Springer, pp. 77–91.
Verbich, D. , Diab, E. , El-Geneidy, A. , 2016. Have they
bunched yet? An exploratory study of the impacts of
15:36
16:48
18:00
19:12
20:24
1234567
PassagenumberatZayedSportsCitystation
Bus32‐beforeperturbation
Bus32‐afterperturbation
Bus32‐afterregulation
Intelligent Regulation System to Optimize the Service Performance of the Public Transport
425

bus bunching on dwell and 1 running times 2. running
times 2, 3 .
Newell, G. , 1977. Unstable Brownian motion of a bus trip.
In: Statistical Mechanics and Statistical Methods in
Theory and Application. Springer, pp. 645–667.
Zhao, J. , Dessouky, M. , Bukkapatnam, S. , 2006. Optimal
slack time for schedule-based transit operations.
Transp. Sci. 40 (4), 529–539.
Feng, W. , Figliozzi, M. , 2011. Empirical findings of bus
bunching distributions and attributes using archived
avl/apc bus data. In: Proc., 11th Int. Conf. of Chinese
Transportation Professionals (ICCTP). ASCE Reston,
VA
Gershenson, C. , Pineda, L.A. , 2009. Why does public
transport not arrive on time? the pervasiveness of equal
headway instability. PloS One 4 (10), e7292.
Newell, G.F. , Potts, R.B. , 1964. Maintaining a bus
schedule. In: Australian Road Research Board (ARRB)
Conference, 2nd, 1964, Melbourne, 2.
Zolfaghari, S. , Azizi, N. , Jaber, M.Y. , 2004. A model for
holding strategy in public transit systems with real-time
information. Int. J. Transp. Manage. 2 (2), 99–110.
Bartholdi, J.J. , Eisenstein, D.D. , 2012. A self-coördinating
bus route to resist bus bunching. Transp. Res. Part B 46
(4), 4 81–4 91.
Xuan, Y. , Argote, J. , Daganzo, C.F. ,2011. Dynamic bus
holding strategies for schedule reliability: optimal
linear control and performance analysis. Transp. Res.
Part B 45 (10), 1831–1845
Pilachowski, J.M. , 2009. An Approach to Reducing Bus
Bunching. University of California Transportation
Center.
Daganzo, C.F. , Pilachowski, J. , 2011. Reducing bunching
with bus-to-bus cooperation. Transp. Res. Part B 45 (1),
267–277.
He, S.-X. , 2015. An anti-bunching strategy to improve bus
schedule and headway reliability by making use of the
available accurate information. Comput. Ind. Eng. 85,
17–32.
Albright, E. , Figliozzi, M.A. , 2012. Analysis of the
impacts of transit signal priority on bus bunching and
performance. In: Proceedings of the Conference on
Advanced Systems for Public Transport (CASPT),
Santiago, Chile.
Bhouri, Balbo, Pinson and Tlig, 2011, Web Intelligence and
Intelligent Agent Technology, IEEE/WIC/ACM
International Conference on (2011) Lyon, France, Aug.
22, 2011 to Aug. 27, 2011, ISBN: 978-0-7695-4513-4
pp: 7-13
M. Napiah,, I. Kamaruddin and Suwardo, “Punctuality
index and expected average waiting time of stage buses
in mixed traffic”, WIT Transactions on The Built
Environment, Vol 116, © 2011 WIT Press. ISSN 1743-
3509 (on-line), 2015
Meead Saberi and Ali Zockaie K., 2013. “Definition and
Properties of Alternative Bus Service Reliability
Measures at the Stop Level”. Journal of Public
Transportation, 16 (1): 97-122
Kenneth J Dueker, Thomas J Kimpel, James G Strathman,
“Determinants of Bus Dwell Time”, Journal of Public
Transportation, March 2004, DOI: 10.5038/2375-
0901.7.1.2
"Dwell time - Transportation Research Thesaurus (TRT)".
trt.trb.org. Retrieved 2017-06-30.
Levinson, Herbert (1983). Analyzing transit travel time
performance, Transportation Research Record 915,
Vu The Tran, Peter Eklund, Chris Cook. 2012, “Toward
real-time decision making for bus service reliability”,
International Symposium on Communications and
Information Technologies (ISCIT), DOI:
10.1109/ISCIT.2012.6380856
Cats, Nabavi, Koutsopoulos and Burghout, 2011, “Impacts
of holding control strategies on transit performance: A
bus simulation model analysis”, Transportation
Research Record Journal of the Transportation
Research Board, Pages 51-58.
Theuns Henning, Mohammed Dalil Essakali et Jung Eun
Oh, 2011, Transport Research Support: A Framework
for urban transport benchmatking, The International
Bank for Reconstruction and Development / The World
Bank.
Linstone HA and Turrof M. The Delphi method -
Techniques and applications, Addison-Wesley
Publishing Company.
Todd Litman, “Public Transit’s Impact on Rural and Small
Towns, A Vital Mobility Link”, PUBLISHED BY
American Public Transportation Association. February.
Hugh M. Clark, Karen Basinger, Katie Maloney and Callie
Whiteman. “Who Rides Public Transportation”,
PUBLISHED BY American Public Transportation
Association. January
John Neff and Matthew Dickens, “Public Transportation
Fact PUBLISHED BY American Public Transportation
Association, ”, 67th Edition,.
Mark Tromp, Xiang Liu and Daniel J. Graham,
“Development of Key Performance Indicator to
Compare Regularity of Service Between Urban Bus
Operators”, Transportation Research Record Journal of
the Transportation Research Board 2216(-1), 2011
Mark Trompet.”The Development of a Performance
Indicator to Compare Regularity of Service between
Urban Bus Operators”, Skempton (Civil Eng.) Bldg,
Imperial College London, December 2010.
Oded Cats Oded Cats, Wilco Burghout, Tomer Toledo, and
Haris N. Koutsopoulos, “Mesoscopic Modeling of Bus
Public Transportation”, No. 2188, Transportation
Research Board of the National Academies,
Washington, D.C., 2010, pp. 9–18, 2010
Neila Bhouri, Maurice Aron and Gérard Scemama, “Gini
Index for Evaluating Bus Reliability Performances for
Operators and Riders”, Transportation Research Board,
Washington, United States. Transportation Research
Board, 13p, June 2016.
Gary Henderson, Philip Kwong and Heba Adkins,
“Regularity Indices for Evaluating Transit
Performance”, TRANSPORTATION RESEARCH
RECORD 1297, 1991.
Noorfakhriah Yaakub and Madzlan Napiah, “Public
Transport: Punctuality Index for Bus Operation”,
World Academy of Science, Engineering and
ICEIS 2020 - 22nd International Conference on Enterprise Information Systems
426

Technology, International Journal of Civil and
Environmental Engineering, Vol:5, No:12, 2011
Xumei Chen, Lei Yu, Yushi Zhang, and Jifu Guo,
“Analyzing Urban Bus Service Reliability At The Stop,
Route, and Network Levels”, Transportation Research
Part A 43, pp. 722–734, 2009
Vaniyapurackal Jilu Joseph, “Punctuality Index for the City
Bus Service”, International Journal of Engineering
Research Volume No.4, Issue No.4, pp : 206-208,
ISSN:2319-6890, April 2015.
S. Carosi a,, S. Gualandi b, F. Malucelli c and E. Tresoldi,
“Delay management in public transportation: service
regularity issues and crew re-scheduling”, 18th Euro
Working Group on Transportation, EWGT, Delft, The
Netherlands., July 2015.
Ceder, A. A., “Public Transit Planning and
Operation:Theory, modelling and practice”: Elsevier
Ltd, 2007.
E. Foloff, M. RIZI and A. Sapiroto, “Bases et pratiques de
regulation”, RATP Direction du reseau
routier,RC/MSE,
Zhenliang Ma, Luis Ferreira and Mahmoud Mesbah, “A
Framework for the Development of Bus Service
Reliability Measures”, Australasian Transport
Research Forum, Brisbane, Australia, October 2013
Hartani, Thesis, “Modélisation des systèmes fous :
Contributions théoriques et applications”.Univetsité de
Paris 6, Jun 95.
European Commission, “White paper – Roadmap to a
single European Transport Area” - Towards a
competitive and resource efficient transport system.
2011.
Intelligent Regulation System to Optimize the Service Performance of the Public Transport
427
