
A Data Driven Approach to Derive Traffic Intersection Geography using
High Resolution Controller Logs
Dhruv Mahajan, Tania Banerjee, Yashaswi Karnati, An. Rangarajan and Sanjay Ranka
Department of Computer and Information Science and Engineering, University of Florida, Gainesville, FL, U.S.A.
Keywords:
Loop Detectors Systems, ATSPM, Controller Logs, Detector Mappings, Detector Configuration, Data Mining.
Abstract:
Current traffic signal controllers are capable of recording events (signal events; vehicle arrival and departure)
at very high resolutions (usually, 10Hz). The high resolution data rates enable the computation and study of
various (granular) measures of effectiveness. However, without knowing the location of specific detectors on
an intersection and the phases they are mapped to, a number of measures of effectiveness (of signal perfor-
mance) cannot be evaluated. These mappings may not be available or up to date for many practical reasons
(e.g., old infrastructure, mappings not machine readable, maintenance or addition of new lanes, etc.). In this
paper, we develop an inference engine to map detectors to phases and distinguish between the stop bar and
advance detectors, or in other words, infer the location of the loop detectors with reference to the intersection.
1 INTRODUCTION
Traffic signals are crucial in managing vehicular and
pedestrian traffic at an intersection where two or more
road segments meet. The new generation of sig-
nal controllers, based on the latest Advanced Trans-
portation Controller (ATC) (Intelligent Transport Sys-
tems, 2009) standards, are capable of recording signal
events as well as vehicle arrival and departure events
at a very high resolution (10Hz). As a result of the
high resolution data rates, it is now possible to com-
pute signal performance metrics such as arrivals on
red, arrivals on green, and platooning ratios on a cy-
cle by cycle or sub cycle basis (U.S. Department of
Transportation, 2013). A standard 4-way intersection
with actuated or semi-actuated control, as shown in
Figure 2, has eight phases (or directions of vehicular
movement) and 4 ways to approach the intersection
given by Figure 1. Each approach usually has multi-
ple lanes and can have one or two permitted phases.
There may be more than one vehicle detector on each
lane. There are usually many detectors (e.g. stop bar
detectors and advanced detectors) at an intersection,
with more than one detector per lane. These can be of
different types, however most detectors (at the very
least) report vehicle arrivals and departures. Given
a detector identifier in the log file, it is essential to
know where the detector is located in the intersection
to make meaningful observations about traffic behav-
ior and the performance of the intersection. Thus, for
effective computation of performance measures, we
need to have detector to phase mappings. The phase
represents the direction of traffic movement on an in-
tersection. Additionally, we would like the mappings
indicate the location of a detector, such as advanced
or stop-bar.
Figure 1: Phase Diagram Showing Vehicular & Pedestrian
Movement at a Four Way Intersections. The Solid Gray Ar-
rows Show Vehicle Movements (or phases). (U.S. Depart-
ment of Transportation, 2008).
In many practical situations, these mappings are
missing (e.g., the infrastructure was built decades ago
and the mappings are not available in a machine-
readable form) or incorrect (e.g., during maintenance
or addition of new lanes, the contractor forgot to up-
date the mappings). The absence of a detector to
phase mapping limits the value of the high-resolution
controller logs. This problem is further detailed in
Section 2.
Our goal in this paper is to find the best map-
ping of detectors to phases and to classify detectors
Mahajan, D., Banerjee, T., Karnati, Y., Rangarajan, A. and Ranka, S.
A Data Driven Approach to Derive Traffic Intersection Geography using High Resolution Controller Logs.
DOI: 10.5220/0009355402030210
In Proceedings of the 6th International Conference on Vehicle Technology and Intelligent Transport Systems (VEHITS 2020), pages 203-210
ISBN: 978-989-758-419-0
Copyright
c
2020 by SCITEPRESS – Science and Technology Publications, Lda. All rights reserved
203

Figure 2: Example of a Standard 4 Way Intersection (I).
as stop-bar detectors or advance detectors based only
on events in the high-resolution controller logs. These
events include a change in the signaling state (for ex-
ample, green, yellow, or red for vehicles, and walk,
flashing do not walk, and do not walk for pedestrians)
and a change in the detector state (based on whether
the detection area is occupied or not).
Our algorithms are based on the following overar-
ching intuition:
1. During normal traffic conditions, the traffic pass-
ing a detector when the corresponding phase is
green will be higher than the other detectors.
2. During very low traffic conditions, the sequence
of timestamps of vehicle arrivals and departures
can be used to separate advance detectors from
stop bar detectors.
Our goal is to develop automated machine-learning
methods that derive these mappings using several
months of loop detector data. This required us to de-
velop the following novel approaches:
1. Automatically decomposing data streams into cy-
cles and cluster these cycles based on similar
phase timing patterns. This is necessary because
combining data across multiple, distinct types of
patterns can lead to lower discrimination between
green versus red behavior. For this purpose, we
developed frequent pattern mining based on n-
grams and then applied clustering algorithms to
derive clusters of similar cycles.
2. For really low volume cycles (e.g., during night-
time), when only one vehicle is potentially
present, the time of arrival and departure along
with signal timing data can be used to derive or-
dering of detectors. We develop algorithms that
can leverage this information across multiple such
cycles.
3. For low to medium volume cycles, we developed
algorithms that can use green versus red depar-
ture information to derive a small subset of feasi-
ble phases for each detector. We then use frequent
set mining within a given cycle cluster to derive a
consistent mapping for that cluster.
4. We have developed algorithms to combine detec-
tor mappings derived for each cluster of similar
cycles to arrive at the overall mapping and the de-
tector type.
Since some non-conflicting phases are synchro-
nized, it may be infeasible to narrow down the map-
ping of a detector to one particular phase. Hence,
to quantify the quality of mapping, we compute the
prediction factor, which is the ratio of the number of
detector-to-phase assignments obtained using our al-
gorithms to the number of the actual detector-to-phase
assignments. Ideally, the prediction factor should be
1. We applied our algorithms to 10 intersections on an
arterial and found that the prediction factor was 1.3.
For this set of 10 intersections, our prediction coin-
cided with the available mappings, and we were able
to map some more detectors unambiguously to one
phase.
Figure 3 shows the overall flow diagram for our
inference engine. The problems of developing an
inference engine for detector locations (i.e., the ap-
proach or phase they belong to) and types from high-
resolution controller logs may be divided into three
parts. The first part is to map the detectors to phases.
The second part is to classify the detectors as stop bar
or advance detectors, using the controller logs. The
last part is to use the inference engine to validate and
update any known detector mappings. These three
steps are described in Section 3, Section 4, and Sec-
tion 5 respectively. Section 5 also presents the results
obtained from several intersections, and the conclu-
sions are presented in Section 6.
2 RELATED WORK
Traffic data that accurately reflect real-time traffic net-
work conditions plays a very important role in im-
proving traffic efficiency in Intelligent Transportation
Systems (ITS) (Martin, 2013). The implementation
and uses of an inductive loop detector system have
been described in detail by Pursula et al. in (Pur-
sula and Kosonen, 1989). Several measures of ef-
fectiveness used in recent times are heavily depen-
dent on phase-specific traffic analysis. Purdue Coor-
dination Diagrams (PCDs), arrivals on green (AOG)
versus those on red (AOR), and other such measures
(U.S. Department of Transportation, 2008; Day et al.,
2014) need to precisely record the phase and loca-
tion corresponding to vehicle arrivals. Yogesh et al.
(Yogesh et al., 2018) also aim to improve the per-
formance and efficiency of signalized intersections by
proposing an improved design and signal processing
algorithm to facilitate lane-by-lane detection in seri-
ally connected loop detectors. Lu et al. (Lu et al.,
2008) propose ways to detect fault(s) in loop detection
VEHITS 2020 - 6th International Conference on Vehicle Technology and Intelligent Transport Systems
204
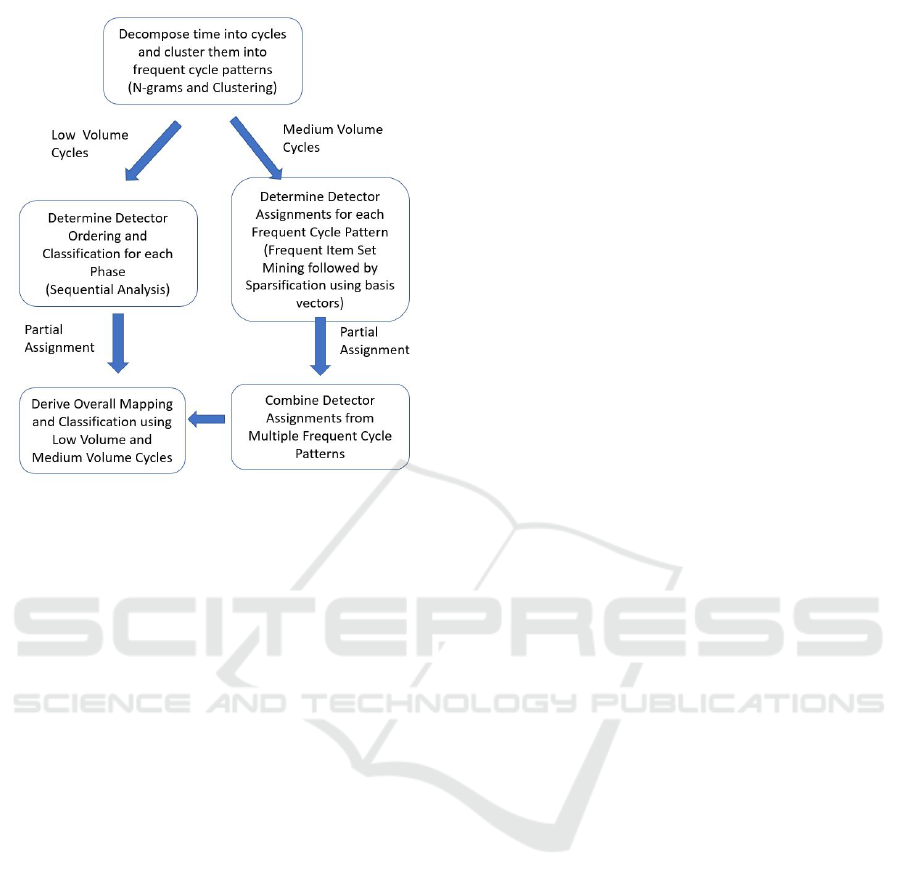
Figure 3: Flow Diagram for Our Methodology. We Sepa-
rate out the Low Volume and Medium Volume Data from
the Logs. The Medium Volume Data Is Used to for Partial
Assignments, and Low Volume Data Is Used to Distinguish
between Stop Bar and Advance Detectors, Enable Ordering
of Detectors.
systems and algorithms to temporarily correct/cleanse
(impute) faulty detector data with similar motivations.
Importance of Detector Mappings. To measure
performance of a signalized intersection in a mean-
ingful manner or effect substantial performance im-
provements, it is critical to have vehicle detection
sensors deployed. Another prerequisite for comput-
ing most performance measures in a semi-automated
manner or fully automated manner is to have high fi-
delity (or resolution) data logging solutions deployed
for all signal controllers. For correctly interpreting
this high resolution data gathered at traffic intersec-
tions and computing performance measures at inter-
sections, certain secondary set of data/information is
needed. The most critical requirement for interpret-
ing the high-resolution detector event data logged in
a controller is the detector mapping information. This
is outlined in (Day et al., 2016)
”Since any detector event must be understood
as a vehicle arriving at some right-of-way and
distance at the intersection, and any phase
event must be understood as an interval of
time elapsed for some movement, the detector
mapping process is the critical step in guiding
how signal output states and vehicle arrivals
are to be interpreted relative to each other.”
Hence, the focus of this research is on deriving or up-
dating these mapping using only the high resolution
event logs that have already been collected.
3 DETECTOR TO PHASE
MAPPING
Figure 2 shows the details of the intersection we use
for demonstrating our methodology throughout the
rest of the paper. This intersection is referred to as
intersection I.
We represent the mapping of detector to phases in
the form of a matrix, where the rows are the phases
and the columns are the detectors. A matrix element
is either zero, if the corresponding detector does not
belong to the corresponding phase, or 1 if that detec-
tor may belong to that phase. Without any informa-
tion, all the entries in the matrix are 1, i.e., this corre-
sponds to a situation where a detector may belong to
any phase. Applying our algorithms, we sparsify this
matrix. Table 6 shows the final state of the matrix.
Each phase may have multiple detectors, hence there
would be many 1s in each row . However, usually,
there should be only a few 1s or a single 1 per column
because a detector often belongs to only one phase. If
non-conflicting phases always start and end together,
then it may not be possible to assign a detector to only
one of these non-conflicting phases.
A signal cycle is defined as ”the total time to
complete one sequence of signalization for all move-
ments at an intersection. In an actuated controller
unit, the cycle is a complete sequence of all signal
indications.” (U.S. Department of Transportation,
2008). As a first step, we automatically decompose
data streams into cycles and cluster these cycles based
on similar phase timing patterns. This is necessary be-
cause combining data across multiple different types
of patterns can lead to lower discrimination between
green versus red behavior. For this purpose, we de-
velop frequent pattern mining on n-grams and use the
results for clustering. In the following, we first de-
scribe how a single cycle is processed and then how
we extend it to multiple cycles.
3.1 Cycle Identification and Clustering
The first step in our methodology is to identify the
cycles and cluster the signal cycles. We create a rep-
resentation of the SPaT data by writing out the phase
or groups of phases that are green at any given time.
For example, if the phases 2 and 5 receive green time
simultaneously, followed by the phases 2 and 6; 4 &
8; 3 & 7; and 1 & 5, we represent these changes as
A Data Driven Approach to Derive Traffic Intersection Geography using High Resolution Controller Logs
205
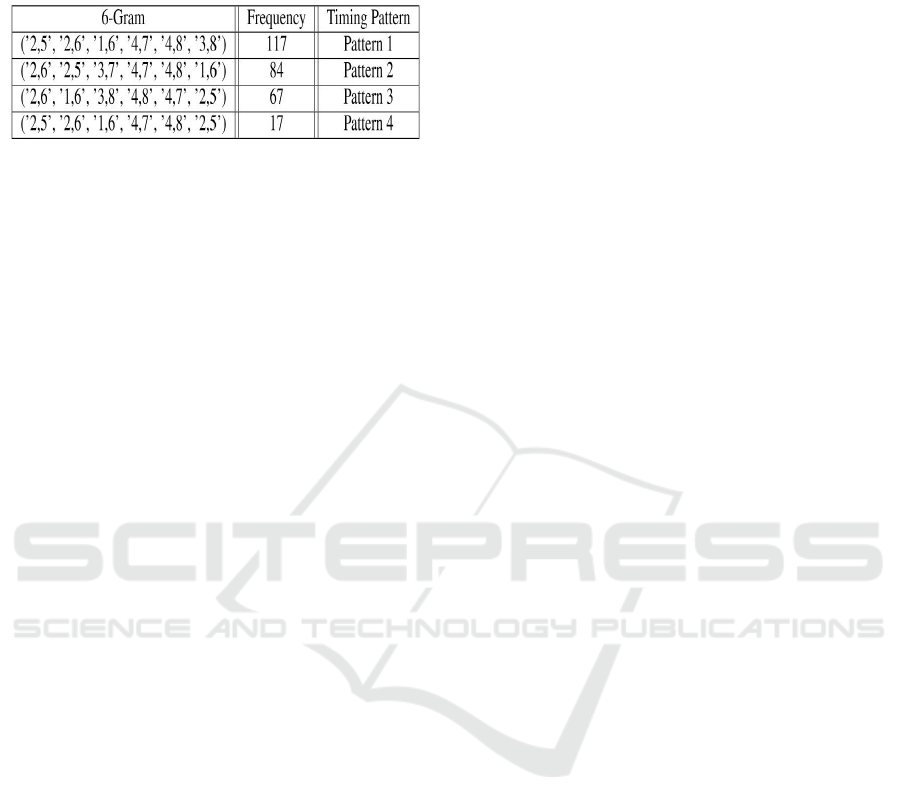
Table 1: Most Frequent 6-Grams Found in the SPAT Mes-
sages from a Controller. These Correspond to the Predomi-
nant Signal Timing Plans Deployed at This Controller.
a sequence such as: ’2,5’, ’2,6’, ’4,8’, ’3,7’, ’1,5’,
and so on. After creating a representation of the SPaT
data in this manner, we identify cycles by computing
n-grams.
Originally used in the field of computational lin-
guistics and probability, n-grams are a continuous se-
quence of n elements in a text. We find n-grams in
our SPaT representation to automatically detect signal
timing patterns. For example, a repeated sequence of
a 6-gram: (’2,5’, ’2,6’, ’4,8’, ’3,7’, ’1,5’, ’1,6’) indi-
cates this as the most dominant signal timing pattern.
Figure 6 shows examples of n-grams in SPaT data.
Table 1 presents the most frequent 6-grams, or timing
patterns, for the intersection in Figure 2.
3.2 Deriving Detector Assignments
We consider cycles from time periods with moderate
traffic activity. This is done by filtering out periods of
very low (e.g., night time) and very high (e.g., rush
hour) traffic. The rationale for doing this is that if
there is little traffic, the detectors would not be acti-
vated, and on the other hand, if there are many ve-
hicles at the intersection, then most detectors will be
activated too frequently, which may make the differ-
ences in activation counts less perceptible.
Our approach is based on the fundamental obser-
vation that the number of vehicle departures reported
on a lane will be more when the corresponding phase
is green or yellow as compared to the number of de-
partures when that phase is red. Thus, for example,
by assigning a positive vote to each vehicle departure
when phase 2 is green and by assigning a negative
vote to each vehicle departure when phase 2 is red, it
is expected that by the end of the signal cycle, all de-
tectors which actually belong to phase 2 will be left
with an overall positive voting score.
This scheme may be unable to disambiguate two
phases that are non-conflicting and are served simul-
taneously. For example, if phases 2 and 6 are served
simultaneously at all times, it will be virtually impos-
sible to assign detectors specifically to 2 or 6. Instead,
we will have a set of detectors that may belong to ei-
ther 2 or 6. If the timing plan is such that during some
part of the day the non-conflicting phases are served
separately, then it is possible to disambiguate these
detector mappings by considering the number of de-
parture votes over these special signal timing patterns.
A visualization of the number of departures for mul-
tiple cycles is presented in Figure 4 where certain de-
tectors report departures only when phase 2 is green.
This can be seen as an indication that those detectors
may be assigned to phase 2.
For each cluster of cycles, we compute the union
of the results obtained from the cycles belonging to
the same cluster. This effectively gives all the phases
a detector can be mapped to based on cycles with sim-
ilar behavior. Next, we take an intersection of the re-
sults from different clusters, to arrive at the final as-
signment of detectors to phases. This is because each
cluster corresponds to a potentially different combi-
nation of phases.
The details of each of these steps are presented
below.
Inference using a Single Cycle: A basis vector for
each phase is created during a cycle. The basis vector
is an array of numbers that are either +1 or -1, de-
pending respectively on whether the phase was active
or not during a time interval. Algorithm 1 presents
a method to infer partial detector-to-phase mappings
(or partial sparsification) using a single cycle. If we
aggregate the events to a resolution of 5 seconds and
we are analyzing a signal cycle of length 35 seconds,
then, a basis vector, b1 for phase 2 would have 7
entries, given by, for example, [-1,-1,-1,+1,+1,-1,-1].
This representation shows that phase 2 was active be-
tween seconds 20 through 30 and inactive for the rest
of the time. Figure 5 is a visual representation of
how the scores for each detector are computed. Algo-
rithm 1 is a description of the same and is the first step
in the sparsification process. The inference from one
cycle may have problems if two phases were served
simultaneously. For example, if phases 2 and 6 are
served simultaneously and detectors d2 and d6 belong
to phases 2 and 6 respectively, they are both identified
as potentially belonging to phase 2 or 6.
Inference from a Single Cluster: Any inference
from a single cycle is subject to errors. This is be-
cause traffic in a single cycle may be abnormally high
in a given phase or direction. Combining these re-
sults across multiple cycles has the benefit of reduc-
ing this error, especially if the results are consistent
across multiple cycles.
For combining across multiple cycles, it is useful
to cluster cycles with similar ordering of phases and
then combining the results within each cluster sepa-
VEHITS 2020 - 6th International Conference on Vehicle Technology and Intelligent Transport Systems
206
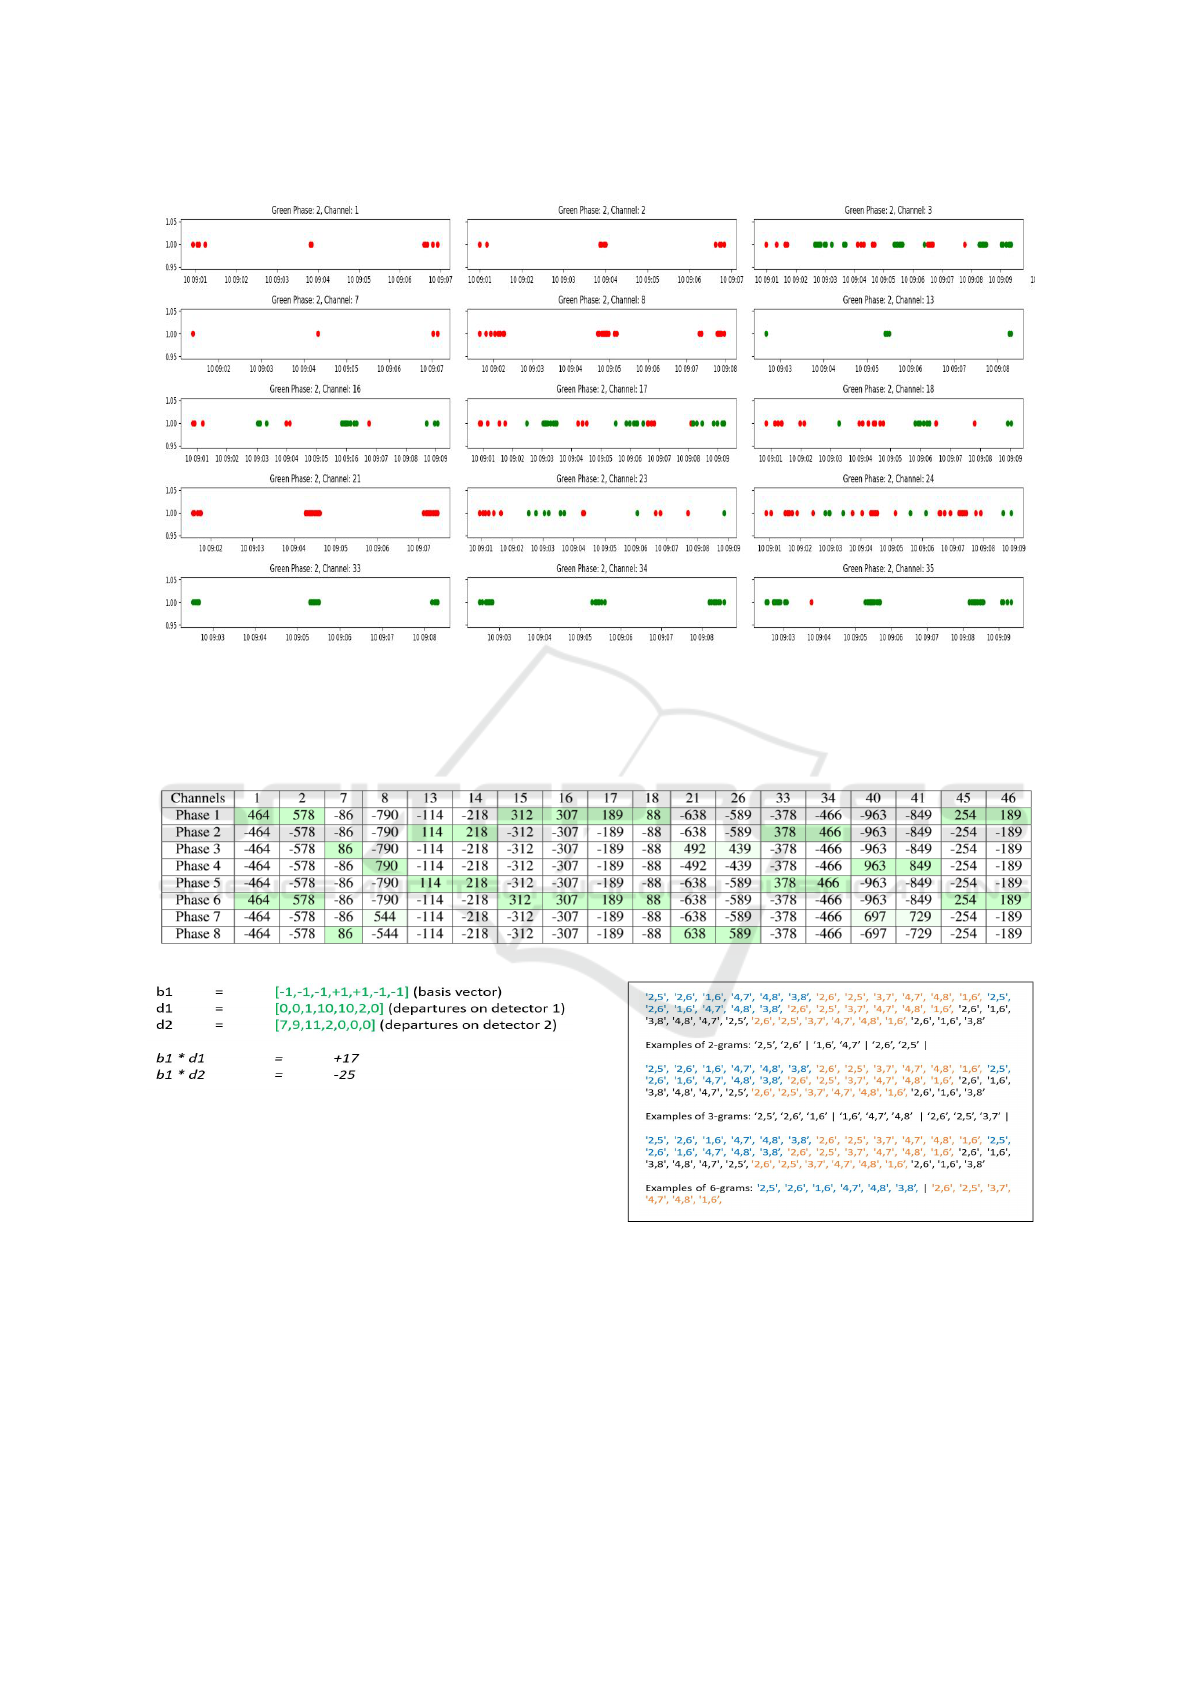
Figure 4: A Visualization of Departures Reported by Some Detectors of Intersection I for Multiple Cycles. Certain Detectors
Report Departures Only When Phase 2 Is Green. This Is a Strong Signal That These Detectors Belong to Phase 2.
Table 2: Partial Assignment Matrix Based on Pattern 1. This Assignment Matrix Is Derived from Pattern 1 in Table 1.
Detectors (Columns) Are Assigned Tentative Phases Based on the Number of Departures on Green vs. Red. But, It Is
Difficult to Distinguish between Phases That Were Green Together, E.G., Phases 1 and 6.
Figure 5: An Example of Computing Scores for Each De-
tector. Based on the Dot Product, That d2 Does Not Belong
to Phase 2 Whereas d1 May Belong to Phase 2.
rately. This process is explained using the most popu-
lar patterns Pattern 1 and Pattern 2 from Table 1. For
two cycles that have same pattern, we take a set union
of the results for these two cycles. The rationale for
taking a union is that the assignments may be slightly
different for the two cycles based on specific traffic
conditions during the occurrence of these cycles. For
example, in one case the volume of traffic may be low,
resulting in the mapping of fewer detectors. Tables 2
and 3 show the detector to phase mappings obtained
from Pattern1 and Pattern2, respectively, by apply-
ing the union operation on all cycles with the same
Figure 6: 2,3 and 6-Grams in the SPAT Data. We Use This
Approach to Infer Signal Timing Plans from SPAT Mes-
sages.
pattern. Tables 4 and 5 show these mappings for the
Pattern1 and Pattern2, respectively.
Inference from Multiple Clusters: For two or more
clusters consisting of cycles with different patterns,
we take a set intersection of the assignment matrix
A Data Driven Approach to Derive Traffic Intersection Geography using High Resolution Controller Logs
207
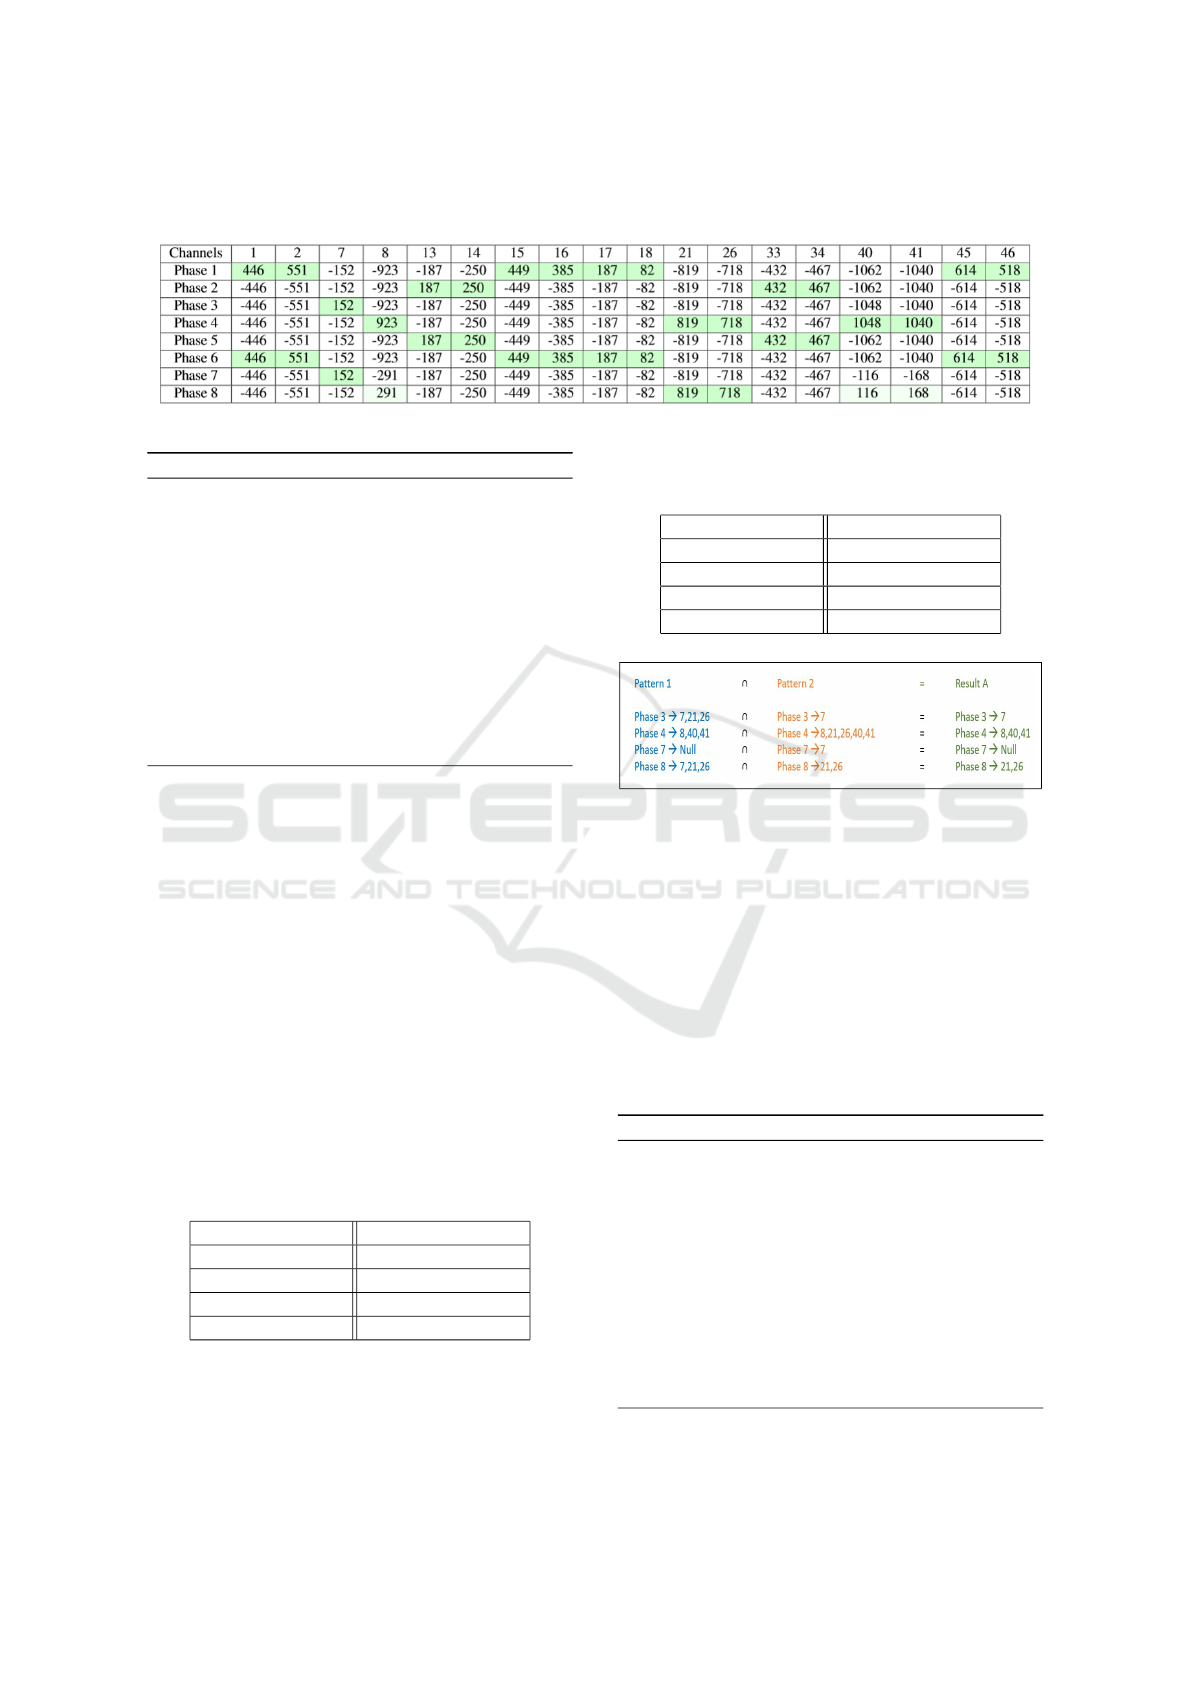
Table 3: Partial Assignment Matrix Based on Pattern 2. This Assignment Matrix Is Derived from Pattern 2 in Table 1. We
Combine the Results from Pattern 1 (Table 2) and Pattern 2 in Figure 7 to Get Better Mappings.
Algorithm 1: Map Detectors Using One Signal Cycle.
function MAPDETECTORS(LogsData , x, y)
Require: LogsData - High resolution controller logs of
the intersection being studied.
x - Intersection ID y - Time window of one observation
for every time window z do
Select cycles with moderate volumes.
Create basis vectors for each phase (bx).
Create departure vectors for each detector (dy).
Compute the vector dot product of each basis vec-
tor, bx with each departure vector dy.
Select the ones with the highest results for the par-
tial assignment matrix.
end for
end function
derived for each cluster in the previous step. For ex-
ample, using the results from Tables 4 and 5, we are
able to further disambiguate the overlapping assign-
ments. Here, detectors 21 and 26, are assigned to
phase 8 in Table 2 because the score for Phase 8 is
higher than the score for Phase 3. And the same de-
tectors are assigned to phases 4 and 8 in Table 3. Tak-
ing an intersection, we assign these detectors to phase
8. Next, detectors 1 and 2 can be assigned to both
Phase 1 and Phase 6. This is because they have the
exact same scores in Tables 2 and 3. Thus, apply-
ing a combination of the set union (within a cluster)
and intersection operations (across multiple clusters),
we arrive at the final assignment results shown in Fig-
ure 7. Algorithm 2 presents the overall algorithm.
Table 4: Partial Mapping Deduced Using Only Pattern 1.
This Is a Transactional Representation of the Results Pre-
sented in Table 2.
Detector Number Possible Phases
13,14 Phase 2 or Phase 5
1,2 Phase 6 or Phase 1
21,26 Phase 8
8,40,41 Phase 4 or Phase 7
Table 5: Partial Mapping Deduced Using Only Pattern 2.
This Is a Transactional Representation of the Results Pre-
sented in Table 3.
Detector Number Possible Phases
13,14 Phase 2 or Phase 5
1,2 Phase 6 or Phase 1
7 Phase 3 or Phase 7
21,26 Phase 4 or Phase 8
Figure 7: We Use the Set Intersection Operation to Com-
bine the Partial Mappings Derived Using Data from Differ-
ent Timing Patterns.
4 CLASSIFYING DETECTORS
We use low volume cycles to infer the relative loca-
tions of the detectors from the stop bar. For example,
a single car arriving at an intersection would trigger
the detectors in order. We filter out signal cycles with
only n (n=3) reported departures within a short dura-
tion of time. We choose the number three because
Algorithm 2: Map Detectors Using Multiple Signal Cycles.
function MAPDETECTORS(Mx , Patterns)
Require: Mx - Collection of Partial Assignment matrices
obtained using only one pattern.
Patterns - The collection of signal timing pattern corre-
sponding to the mapping
for each phase p (varying 1 to 8) do
Take an intersection of the results from each as-
signment matrix.
Obtain the final assignment matrix.
Use the low volume data to order the detec-
tors(stop bar vs advance).
end for
end function
VEHITS 2020 - 6th International Conference on Vehicle Technology and Intelligent Transport Systems
208
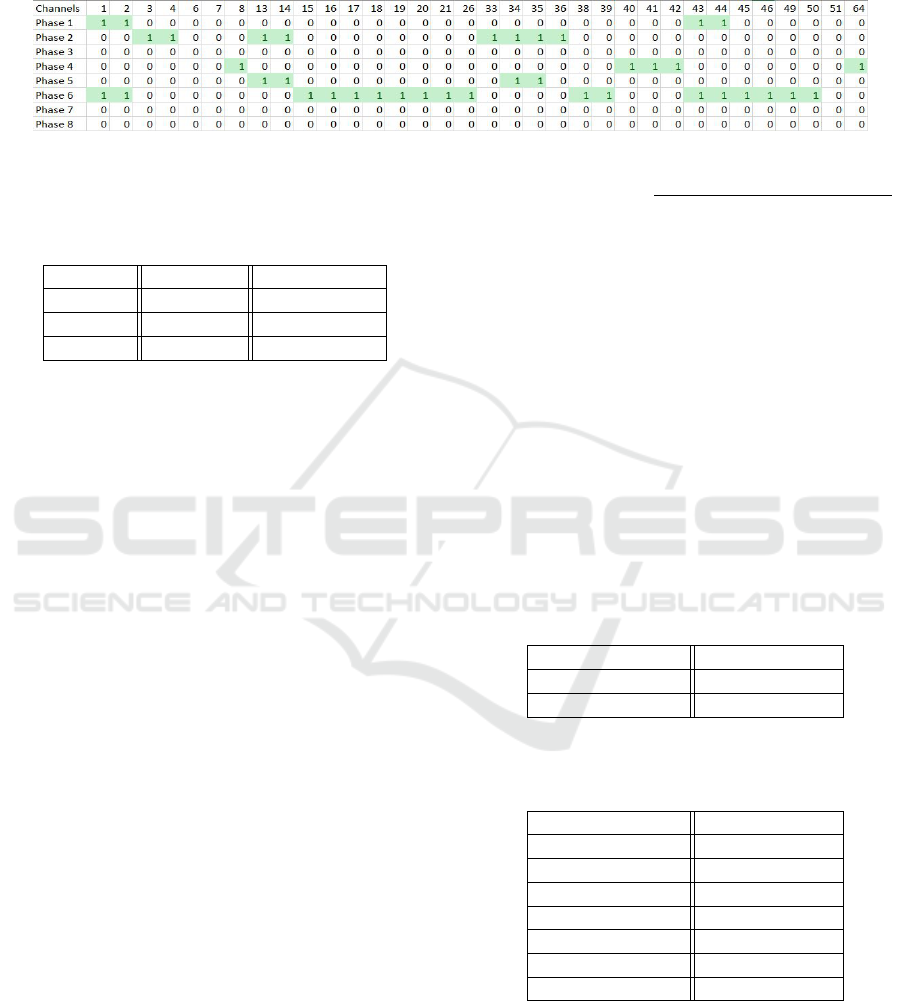
Table 6: Final Mapping or Assignment Matrix Deduced Using a Combination of Pattern 1 and Pattern 2. We Start with the
Assumption That Every Detector May Be Assigned to Any Phase. Hence, We Assume That All the Cells in the Assignment
Matrix Are Green. Techniques Presented in This Paper Can Be Used to Sparsify the Initial Matrix and Arrive at This Final
Mapping Where Green Cells Represent Likely Assignment.
Table 7: Frequent Item Sets Observed Using Very Low Vol-
ume Observation Periods. These Results Are in Agreement
with the Results Presented in Table 6. They Also Help Us
Distinguish between Stop Bar and Advance Detectors.
Item Set Frequency Green Phases
6,4,36 35 Phase 2 and 6
17,15,45 26 Phase 2 and 6
18,16,46 23 Phase 2 and 6
a single vehicle can cross a maximum of three detec-
tors while crossing the intersection. Next, we com-
pute the most frequently occurring ordered item sets
of detectors that report departures during these peri-
ods. For example, if detector 6 reports a departure
and that is followed by a departure event on detec-
tors 4 and 35. If this particular order of events is ob-
served with a high frequency, we can use these ob-
servations to order the three detectors. We could only
derive potential orderings for Phases 2 and 6 using
this technique. Table 7 presents the results for the or-
der derived using time periods with low volumes for
intersection ID 1995.
5 VERIFICATION
Assume that a (partial) mapping is available for an in-
tersection. The approach described above can be used
to determine a sparse assignment matrix of detector-
to-phase mapping. If this mapping is conflicts with
the mapping provided, then the derived mapping can
be effectively used to provide suitable corrections.
We applied our algorithm for a set of 10 intersections
in Seminole County. This corridor was selected to
test our algorithms because all the controllers on this
corridor are ATC compliant and detector-to-phase as-
signment was available for all of them. It was found
that the actual assignments are a subset of our predic-
tions. However, due to the problem presented by syn-
chronized phases, the model might make more than
one assignment prediction. To quantity this, we de-
fine the following metric:
Prediction Factor =
No o f assignments suggested
No o f actual assignments
(1)
On this corridor of 10 intersections, we made (on
average) 1.3 predictions of assignment instead of 1,
hence our Prediction Factor was 1.3.
Our techniques can also be used to update previ-
ously known mappings to generate a more complete
picture or validate and update out-of-date mappings.
For example, for one of the signals the previously
known mappings are presented in Table 8. It can
be observed that we started with partial information
for Phases 2 and 6 and no information for the other
phases. The derived detector mappings are presented
in Table 9. Note that for Phases 2 and 6, the map-
pings are ordered, i.e., it was deduced that detectors
2, 3 and 11, 12 are advance detectors whereas the oth-
ers are stop bar detectors.
Table 8: Known Mapping for an Intersection. This Can Be
Contrasted with the Final State in Table 9.
Detector Number Possible Phases
2,3 Phase 2
11,12 Phase 6
Table 9: Final Mapping Deduced Using a Combination of
All Techniques in This Paper. We Validate the Known Map-
pings in Table 8 and Update Them at the Same Time.
Detector Number Possible Phases
1 Phase 1
2,3,26,27 Phase 2
29 Phase 3
7 Phase 5
11,12,13,14 Phase 6
15 Phase 7
16,17 Phase 8
6 CONCLUSIONS
We have proposed a framework to derive loop de-
tector mappings if none or only partial mappings are
A Data Driven Approach to Derive Traffic Intersection Geography using High Resolution Controller Logs
209

available. We also presented a way to identify top-bar
and advance detectors on the same lane. Our main
contributions are as follows:
1. We have developed novel algorithms for automati-
cally decomposing data streams into cycles and to
cluster these cycles based on similar phase-timing
patterns. For this purpose, we developed frequent
pattern-mining bases on n-grams and then applied
clustering algorithms.
2. For really low volume cycles (e.g., during night-
time), when only one vehicle is potentially
present, the time of arrival and departure along
with signal timing data can be used to derive or-
dering of detectors. We develop algorithms that
can leverage this information across multiple such
cycles.
3. For low to medium volume cycles, we developed
algorithms that can use green versus red departure
information to derive a small subset of phases for
each detector. We then use frequent set mining
within a given cycle cluster to derive a consistent
mapping for that cluster.
There are several avenues for improving the work
presented in this paper. In the intersection defined in
Section 3, we note that for the timing plans deployed,
phases 1, 6 and 2, 5 are partially synchronized. In
some cases, it may be possible to compute and de-
ploy a customized timing plan for a short period of
time (non-peak hour, to minimize impact on Quality
of Service) where phases 1 and 5 are synchronized.
These customized basis vectors (signal-timing plans)
can help us reduce the Prediction Factor (Step 2, Fig-
ure 7). We also plan to treat permissive left and right
turn lanes differently in the future.
ACKNOWLEDGEMENTS
This work was supported by NSF CNS 1922782,
by the Florida Dept. of Transportation (FDOT) and
FDOT District 5. The opinions, findings and conclu-
sions expressed in this publication are those of the au-
thor(s) and not necessarily those of the FDOT or the
National Science Foundation.
REFERENCES
Day, C., Bullock, D., Li, H., Remias, S., Hainen, A.,
Freije, R., Stevens, A., Sturdevant, J., and Brennan, T.
(2014). Performance Measures for Traffic Signal Sys-
tems: An Outcome-Oriented Approach. Purdue Uni-
versity, West Lafayette, Indiana.
Day, C. M., Bullock, D. M., Li, H., Lavrenz, S., Smith,
W. B., and Sturdevant, J. R. (2016). Integrating traf-
fic signal performance measures into agency business
processes. Joint Transportation Research Program.
Intelligent Transport Systems, U.S. Department of Trans-
portation, F. H. A. (2009). Ite advanced transporta-
tion controller (atc) family of standards. https://www.
standards.its.dot.gov/Factsheets/Factsheet/14. (Ac-
cessed on 7/20/2019).
Lu, X.-Y., Varaiya, P., Horowitz, R., and Palen, J. (2008).
Faulty loop data analysis/correction and loop fault de-
tection. In 15th World Congress on Intelligent Trans-
port Systems, pages 12–24.
Martin, Peter T; Feng, Y. W. X. (2013). Detector technol-
ogy evaluation. https://digitallibrary.utah.gov/awweb/
awarchive?item=30285. (Accessed on 7/20/2019).
Pursula, M. and Kosonen, I. (1989). Microprocessor and
pc-based vehicle classification equipments using in-
duction loops. In Second International Conference on
Road Traffic Monitoring, 1989., pages 24–28.
U.S. Department of Transportation, F. H. A. (2008). Traf-
fic signal timing manual. https://ops.fhwa.dot.gov/
publications/fhwahop08024/index.htm. (Accessed on
7/20/2019).
U.S. Department of Transportation, F. H. A. (2013). Mea-
sures of effectiveness and validation guidance for
adaptive signal control technologies. https://ops.fhwa.
dot.gov/publications/fhwahop13031/index.htm. (Ac-
cessed on 7/20/2019).
Yogesh, G. K. V., Sharma, A., and Vanajakshi, L.
(2018). An improved inductive loop detector de-
sign for efficient traffic signal operations and leaner
space requirements. Transportation Research Record,
2672(18):143–153.
VEHITS 2020 - 6th International Conference on Vehicle Technology and Intelligent Transport Systems
210
