
Weather Effects on Obstacle Detection for Autonomous Car
Rui Song
1a
, Jon Wetherall
2b
, Simon Maskell
1c
and Jason F. Ralph
1d
1
Dept. Electrical Engineering and Electronics University of Liverpool Liverpool, U.K.
2
CGA Simulation, Liverpool, U.K.
Keywords: Autonomous Vehicle, Multiple Sensors, Weather Simulation, Virtual Environment, Object Detection.
Abstract: Adverse weather conditions have become a critical issue when developing autonomous vehicles and driver
assistance systems. Training and testing autonomous vehicles in a simulation environment before deploying
them into the market have many benefits due to lower costs and fewer risks. However, there are only a few
works about weather influences on sensors in the simulated environment. A more systematic study of weather
effects on the sensors used on autonomous cars is required. This paper presents a multi-sensor simulation
environment under different weather conditions and examines the influence on environmental perception and
obstacle detection for autonomous cars. The simulation system is being developed as part of a collaborative
project entitled: Artificial Learning Environment for Autonomous Driving (ALEAD). The system
incorporates a suite of sensors typically used for autonomous cars. Each sensor model has been developed to
be as realistic as possible – incorporating physical defects and other artefacts found in real sensors. The
influence of weather on these sensors has been simulated based on experimental data. The multi-sensor system
has been tested under different simulated weather conditions and analysed to determine the effect on detection
of a dynamic obstacle and a road lane in a 3D environment.
1 INTRODUCTION
In recent years, there has been a significant move
towards the development of semi-autonomous and
fully autonomous vehicles. Autonomous transport
offers increased convenience and an improved quality
of life. It could help elderly and physically disabled
people to have independence. Autonomous cars could
reduce CO
2
emissions and lead to a revolution in
urban transportation; less traffic congestion and lower
transportation costs (in fuel and for infrastructure).
According to the definition used by the Society of
Automotive Engineers (SAE), the maximum
autonomy level of autonomous vehicle is currently at
level 3 out of 6 levels (Badue et al., 2019) –
autonomous driving is possible under the supervision
of an operator. The main reason for this limit is
because of the difficulty in detecting and dealing with
unexpected events, particularly when sensor
performance is degraded due to environmental effects
(weather, dirt, and possible damage). Such
a
https://orcid.org/0000-0002-8695-1522
b
https://orcid.org/0000-0001-8477-9071
c
https://orcid.org/0000-0003-1917-2913
d
https://orcid.org/0000-0002-4946-9948
unexpected events could even lead to fatal crash
(Nyholm, 2018). A close relation exists between
autonomous driving and weather recognition, since in
adverse weather conditions such as rain, fog, or snow,
driving is more difficult than during fair conditions.
The ability to tackle real life problems is critical to
improve the autonomy level of cars and to reduce
accidents. Because of the costs and risks associated
with road trials, the trend is to train algorithms using
simulations before putting autonomous cars into
service on the road.
The demand for realistic simulation environments
and recent advances in computer technology has led
to significant improvements in simulation systems for
autonomous cars. In traditional self-driving software,
sensor data collected from real world are imported to
test the reaction of the vehicle’s control software to
environmental changes, for example using recorded
video streams to avoid other cars and pedestrians on
Song, R., Wetherall, J., Maskell, S. and Ralph, J.
Weather Effects on Obstacle Detection for Autonomous Car.
DOI: 10.5220/0009354503310341
In Proceedings of the 6th International Conference on Vehicle Technology and Intelligent Transport Systems (VEHITS 2020), pages 331-341
ISBN: 978-989-758-419-0
Copyright
c
2020 by SCITEPRESS – Science and Technology Publications, Lda. All rights reserved
331
road (Ess et al., 2009; Xu et al., 2017). To improve
the stability and robustness of self-driving software,
road networks, other vehicles, bicycles, pedestrians
and even animals need to be included in the
simulation (Tideman and van Noort 2013; Kehrer et
al., 2018). In this way, developers can use virtual
worlds to test and retest a variety. of scenarios found
in everyday life and identify potential problem cases.
Recently, sensor models, advanced visual perception
and intelligent guidance systems have been integrated
into simulation systems for sensing the vehicle’s
surroundings and to help avoid collisions.
Cameras and LiDAR are the two most popular
sensors in visual navigation and car localization
(Miklic et al., 2012; Shimchik et al., 2016; Häne et
al., 2017). Radar simulation is gaining attention due
to its robustness in most adverse weather conditions
(Apollo, 2019; RFpro, 2019). One common problem
with these simulated systems is that they are not
suitable for real-time tests, especially when the 3D
environment is complex. To solve the real-time
problem, LGSVL combines the real world video data
and the simulated sensing data together to train
autonomous cars ( LGSVL Simulator, 2019). VIRES
Virtual Test Drive (VTD) improves the simulation
environment that can be adjusted to different weather
conditions (VIRES, 2019).
However, current systems do not generally
provide models for the influence of weather on the
sensors used on autonomous vehicles. As in human
vision, these sensors are negatively impacted by
adverse weather conditions. For example, rainy and
foggy conditions cause significant degradation to the
functions of camera and LiDAR (Dannheim et al.,
2014), significantly reducing operating range and
signal contrast. Therefore, accurate simulations of
sensor performance in adverse weather conditions are
particularly important for the further development of
simulation software for autonomous vehicles.
Based on the multi-sensor system developed for
the Artificial Learning Environment for Autonomous
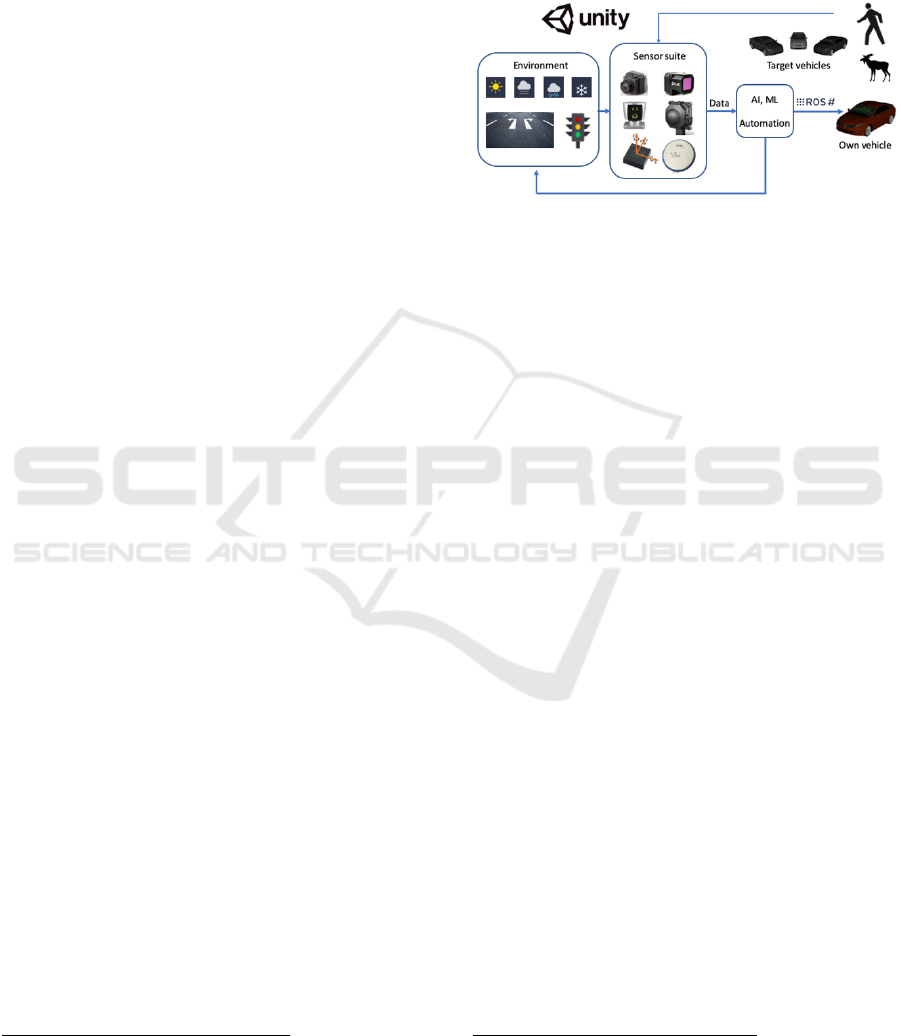
Driving (ALEAD) project (Song et al.,2019), shown
in Figure 1, a range of different weather effects on
onboard sensors have been simulated in this paper. To
investigate the influence of these effects on
autonomous vehicle navigation, a scene with a ball
bouncing in a street has been simulated in Unity3D.
A tracking algorithm has been developed and
implemented to detect the movement of the bouncing
ball and to separate it from the surrounding clutter.
1
ALEAD is capable of doing online testing, but also
rerun problematic cases (using stored random number
seeds) and run at less than real-time (e.g. to facilitate
The paper is organized as follows. Section 2 details
the ALEAD project and the multi-sensor system.
Section 3 and 4 explain the methods used in weather
simulation and object detection, respectively. Results
are shown and discussed in Section 5. The paper is
summarized, and conclusions drawn in Section 6.
Figure 1: Structure of ALEAD simulator.
2 ALEAD PROJECT
2.1 Project Overview
ALEAD is a digital environment that provides
autonomous vehicles a virtual space to learn to drive
and to respond to external stimuli, thereby reducing
costs and time associated with road tests
1
. ALEAD is
being based around industry standard software
components. As shown in Figure 1, most simulations
are run in the Unity3D graphics engine, and is
interfacing with the Robot Operating System (ROS)
and autonomous car models, including the Baidu
Apollo (Apollo, 2019) open driving solution.
Existing computer game simulation technologies
developed by the industrial partner CGA are being
applied to autonomous vehicle training, using novel
improvements to existing simulation systems and
applying these systems in a new sector. By using
artificial intelligence (AI) and machine learning (ML)
to train vehicles in an extensive simulated world,
designed with real world inputs and benefiting from
the integration of multiple sensors, ALEAD is
combining technologies to create a wholly new
environment which could have a significant impact
on the time required to get autonomous vehicles on
the road. ALEAD focuses on the merging fields of
machine learning, virtual reality, augmented reality in
realistic simulations of urban environments.
The ALEAD project will significantly reduce the
need for live trials of autonomous vehicles. Using a
testing of new algorithms). It can give control of time to
the user and generate multiple images simultaneously.
VEHITS 2020 - 6th International Conference on Vehicle Technology and Intelligent Transport Systems
332
large number of parallel simulated environments, it
will be possible to train systems much faster than
running live trials and across a range of exceptional
weather conditions, such as fog or ice.
2.2 Sensor Suite
Current testing systems mainly use video information
and live trials. The key to simulating the environment
in as realistic way as possible is the use of physically
realistic sensor models and environmental factors.
This contrasts with work to accurately model the
physics of the sensor platform (Which has been the
focus of the development of VTD). The ALEAD
system is developing a representative sensor suite
including models for each of the key sensors that are
likely to be present in future autonomous vehicles,
including short range Radar, IR cameras, LiDAR
scanners, and GPS. The aim is to identify the factors
that determine or limit sensor performance, thereby
having an adverse effect on the robustness and safety
of an autonomous vehicle: including, precipitation
and other atmospheric effects, such as high humidity
or fog, bright sources of illumination, such as the sun
being low in the sky and reflections from buildings,
erratic behavior from other road users, debris in the
road, and deliberate jamming of the sensor data. The
sensor modelling will make the training physically
realistic for computer vision, which operates very
differently from human perception.
2.2.1
Image
A standard visible band camera model uses the simple
scene as a basis. The angle of the field of view (FOV)
will be defined based on the interface with the
coverage of other sensors. In this paper, the camera
sensor is used directly from the original camera of
Unity3D. To accelerate processing, only objects near
the camera are rendered. The output of the camera
only includes these rendered objects and objects out
of range are ignored. The FOV of the camera is set as
38
o
, and a perspective projection is used.
Infrared Band camera generates thermal images of
the scene are based on the three-dimensional
geometry of the scene and require objects within the
scene to be labelled with temperature information.
Also requires some indication of the atmospheric
properties to derive path radiance and attenuation
properties. The infrared scene shares the same 3D
scene rendered for the visible band camera, since the
physical objects are the same in each case. Moreover,
the infrared scene includes a temperature map, where
temperature profiles to different surfaces present in
the visible band scene are allocated. The IR camera
model utilizes this temperature map and converts the
temperatures into thermal intensities/photon fluxes
(Griffith et al., 2018). The thermal radiation is
propagated through an atmospheric model (including
attenuation and path radiance) and then detected
using a bespoke infrared camera model with
properties representative of a commercial infrared
camera (pixel non-uniformities, limited pixel
resolution, dead/saturated pixels, etc.) (Ahire, 2014).
The FOV of IR camera is set as 59
o
, with limited
resolution to reflect the smaller focal plane arrays
typically available in infrared cameras.
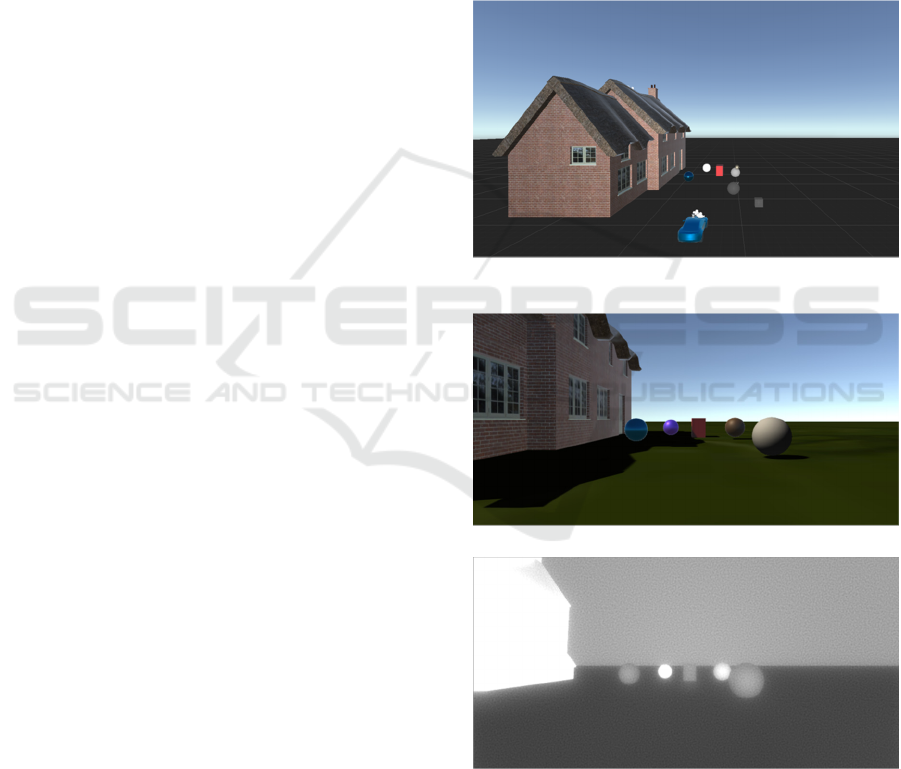
Figure 2: A simple constructed scene.
(a) Image captured from the visible band camera model
(b) Image captured from the simulated IR camera
Figure 3: Rendering results from imaging sensors.
To test the functionality of simulated sensors, a
simple scene shown in Figure 2 has created with a
cottage and several sphere and cubic objects around
an autonomous car. The cameras are mounted behind
Weather Effects on Obstacle Detection for Autonomous Car
333
the windshield of the autonomous car to get realistic
data in the rain. The position of the IR camera is set
beside the camera. The rendering results from camera
and IR camera are shown in Figure 3(a) and (b),
respectively.
2.2.2 LiDAR
LiDAR is an active near visible band sensor (Near
Infrared Band), which measures the time of flight of
pulsed light to build up a three-dimensional map of
the scene. The scanning processes will be presented
while vehicle is in motion and reflection of light from
the surfaces of objects in the scene.
A commercial LiDAR sensor is simulated to ensure
that the representation is as realistic as possible. The
Velodyne HDL-64E (Velodyne Manual, 2014), a
vertical LiDAR sensor is used because it is the most
popular type used in self-driving cars ((Bergelt et al.,
2017). To simulate this type of LiDAR sensor,
parameters such as the number of lasers, position of
each individual laser and its angle, and the rotational
speed have been included in the model.
In Unity3D, each laser can be represented using
ray-casting. From a mathematical perspective, ray-
casting is a directional 3D vector, which checks for
intersections with other geometries. The coordinate of
the intersected point will be sent back. In such a way,
the ray-casting can be considered to be a realistic
representation of a laser scanner. Note that this
requires the creation of a collider for each object built
in the constructed scene. Unity3D uses the physics
engine to handle ray-casting. Multiple ray-casts can
be executed within a single physics frame. In this way,
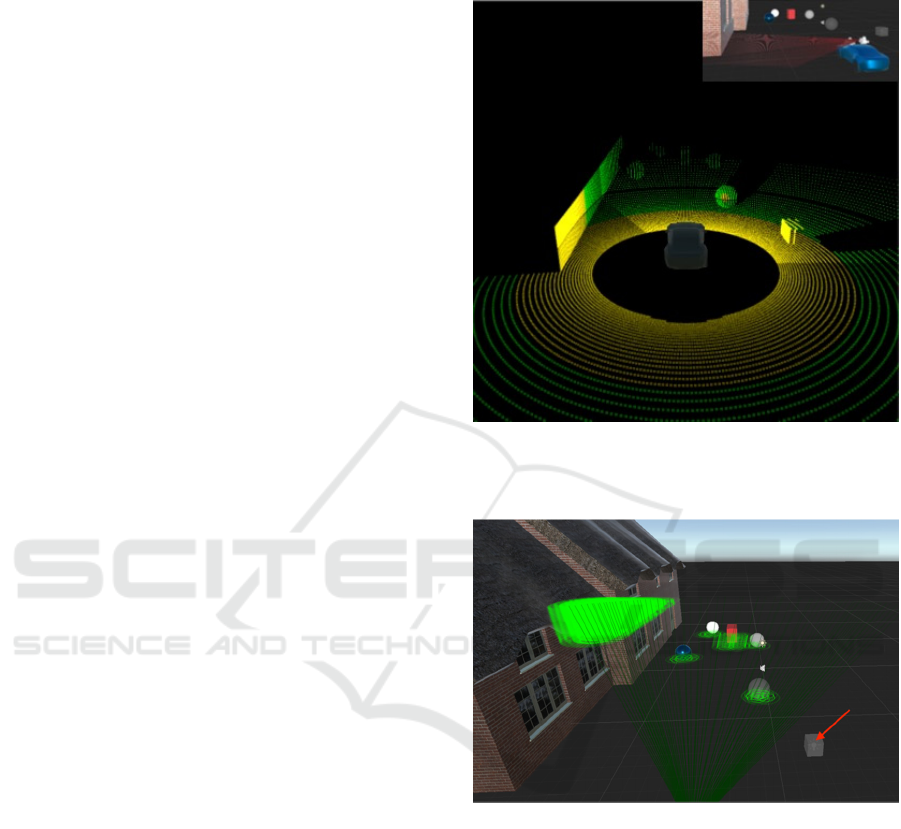
it can provide simultaneous actions. Figure. 4 shows
the result of a 360
o
LiDAR scanning in the scene.
2.2.3 Radar
Radar is a simple distance measuring device with
relatively broad beam width and short range – but
with better bad weather performance than LiDAR or
cameras. Usually, in the driving environment, the
radar cross section (RCS) of obstacles is relatively
small. Therefore, the type of radar used in an
autonomous car is a broadband Frequency Modulated
Continuous Wave (FMCW) radar (Belfiore et al.,
2017). It detects multiple objects and their respective
distances by performing a fast Fourier transform (FFT)
on the interference beat-frequency signal.
Figure 4 illustrates the radar sensing result. In the
scene, each object has a defined radar signature with
RCS information (green circles). Ray-casts (green
lines) are used to represent radar beams. It can be seen
that the cubic object, pointed by a red arrow is not
detected by the radar as it is out of the detection range.
Figure 4: LiDAR sensing result with a scanning of 360
o
in
the simple constructed scene. Laser beams are represented
by red lines.
Figure 5: Radar using ray-casting, with detection of RCS.
2.2.4 GPS
GPS/GNSS Satellite Navigation Systems use basic
radio navigation based on very low power satellite
signals, and it requires WGS’84 Earth model
information for realistic satellite data, including an
interface for live GPS/GNSS feed or recorded
satellite ephemeris data (e.g. RINEX format). The
position of the vehicle, in terms of longitude, latitude
and altitude, is calculated using the distance between
the vehicle and the satellites within view. To get an
accurate position, at least 4 satellites should be
visible, although often six to eight may actually be
visible. The total number of satellites is 32.
VEHITS 2020 - 6th International Conference on Vehicle Technology and Intelligent Transport Systems
334
3 WEATHER EFFECTS ON
SENSORS
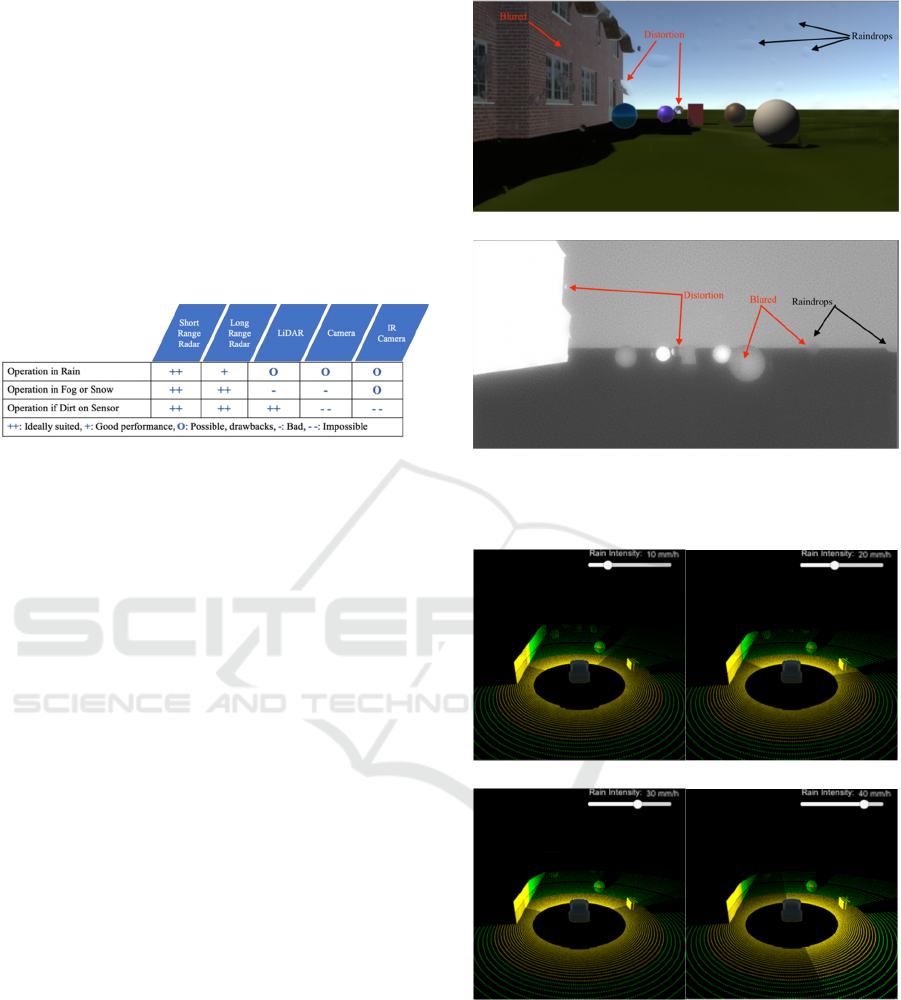
From the investigations of (Rasshofer and Gresser,
2005), the influence of weather on sensors can be
summarized as shown in Figure 6. It can be seen that
image sensors, camera and IR camera, and LiDAR
are most prone to be influenced in rainy and foggy
weather. Therefore, this paper focuses on simulation
of these sensing technologies for autonomous
vehicles and their respective issues under adverse
weather conditions of rain and fog.
Figure 6: Typical strengths and weaknesses of automotive
sensors in different weather environments.
3.1 Rainy Conditions
In Unity3D, rain is simulated using a particle-based
system, where the intensity of rain can be adjusted.
The shape of droplet spread on the windshield is
assumed to be an ellipse.
3.1.1 Camera and IR camera
Rainy weather introduces sharp intensity fluctuations
due to increased atmospheric scattering and general
obscuration, which degrade the quality of images and
videos taken from a standard camera (Garg and
Nayar, 2005). IR cameras perform similarly in the
presence of rain. Because both visible and IR cameras
are set behind windshield, raindrops that stay on the
glass can create a raindrop pattern on the image,
which decreases the image intensity and blurs the
edges of other patterns behind it (Bernard et al.,
2014).
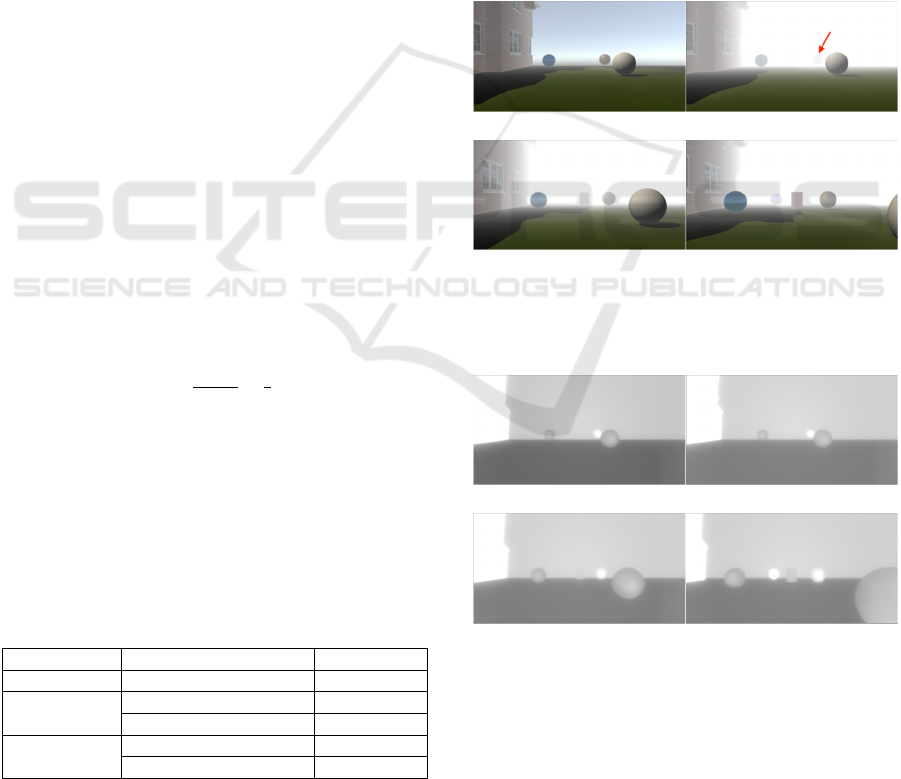
Figure 7 (a) and (b) show the results of images
captured from the visible band and IR camera models,
respectively under rainy weather. Comparing Figure
7 with Figure 3, it can be seen that the contrast of both
the visible band and IR camera images have reduced
slightly. The areas that have strong contrast in color
and covered by raindrops are distorted with reflection
of some patterns behind raindrops. Whereas those
areas with less contrast were blurred.
(a)
(b)
Figure 7: Results of captured images in rainy conditions.
(a) Camera image, (b) IR camera image.
(a) (b)
(c)
(d)
Figure 8: LiDAR scanning results in rainy conditions with
different rate of rain. From (a) to (d), the rain rate increases
from 10 mm/h to 40 mm/h.
3.1.2 LiDAR
There are several studies on laser pulse transmission
through rain Rasshofer et al., 2011; Hasirlioglu et al.,
2016; Filgueira et al., 2017). The relationship
between rain rate and laser power is modeled by
Weather Effects on Obstacle Detection for Autonomous Car
335
(Goodin et al., 2019). In this paper, the detection
range Z influenced by rain can be modeled using:
Z
'
=Z+0.02Z(1-e
-R
)
2
(1)
where Z’ is the modified detection range affected by
rain, and 0.02 is the variance factor. The rate of rain
is denoted as R. Note that the sizes of the raindrops
are assumed to be the same.
The scanning results from LiDAR model at
different rain rates predicted by Equation (1) are
shown in Figure 8. By comparing Figure 4 and Figure
8(a), it can be seen that the detected maximum
distance of target is reduced. When the rain rate
increases from 10 mm/h to 40 mm/h, the detection
range decreases further, and the number of detected
objects were reduced accordingly. Moreover, the
shapes or outlines of some objects cannot be
presented completely by point clouds.
3.2 Foggy Conditions
From the definition, fog can be considered to be
microscopic water droplets. Therefore, the influence
of fog on LiDAR scanning is similar to the effect of
rain, as presented in Section 3.1.2, but the variance
factor in Equation (1) changes to 0.17 (Heinzler et al.,
2019).
When light passes through the atmosphere or
liquid, it can be absorbed, scattered, and reflected
anywhere in space without hitting a solid surface. As
with rain, the scattering due to fog can lead to
extinction of an optical signal. The relationship
between visibility and the extinction coefficient due
to fog can be expressed as:
V
=
ln(0.05)
k
≈
3
k
(2)
where V is the distance that the value through fog is
reduced to 5% of its original value. k is the extinction
coefficient (Duthon et al., 2019).
The extinction coefficient also varies with
wavelengths (Nebuloni, 2005). Table 1 below
summaries the extinction coefficient (per km) value
of different wavelengths with different visibility.
Table 1: Extinction coefficient values of different
wavelengths (Nebuloni 2005).
Wavelength Visibility V (km) k
Visible V>0 3.91
Near IR
(Inc)
0.06 <V < 0.5 3.65
0.5 < V < 2 2.85
IR
0.06 <V < 0.5 3.01
0.5 <V <10 2.40
To simulate fog, an approximation method using
exponential model is applied:
f
=e
-cd
(3)
where c is the coordinate of fog (is where to render
colour of fog), and d is the density of fog. After
adopting the extinction coefficients for the visible
band and IR camera into image rendering, the results
are shown in Figure 9 and Figure 10, respectively. As
shown in Figure 9(a) and (b), when the density of fog
increases from 0.4 to 0.8 (fog density varies between
0 to 1), the spherical object indicated by the red arrow
can hardly be seen due to the longer distance.
However, comparing to IR camera results, the
intensity reduction is less and the spherical object can
still be seen. When the car moves closer to objects in
the scene, those objects initially at longer distances
can be seen clearly.
(a)
(b)
(c)
(d)
Figure 9: Image results from camera in foggy conditions.
(a) Fog density=0.4, (b) fog density=0.8, (c) and (d) same
fog density, but camera moves forward.
(a)
(b)
(c)
(d)
Figure 10: Image results from IR camera in foggy
conditions. (a) fog density=0.4, (b) fog density = 0.8, (c)
and (d) same fog density, but IR camera moves forward.
VEHITS 2020 - 6th International Conference on Vehicle Technology and Intelligent Transport Systems
336
4 OBJECT DETECTION
After understanding how weather affects sensor data,
the next task is to investigate how autonomous
driving and navigation will be affected. A more
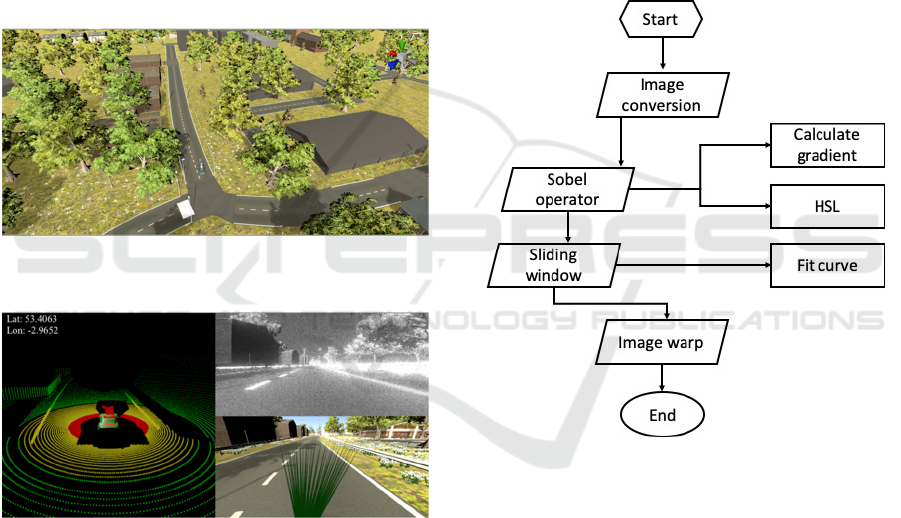
complex scene shown in Figure 11 was created,
consisting of a road network, vegetation and houses.
The models of sensors and weather effects simulated
in Section 3 are integrated into the scene to allow the
autonomous car detecting and tracking objects while
driving. The data received from sensors are presented
in a display window (Figure 12), where the left
represents point clouds generated by LiDAR data and
GPS information is displayed at the top left corner.
The right side shows the rendering images from IR
camera and visible band camera, respectively. Radar
beams are plotted as green lines in the camera image.
Figure 11: Complex scene. Road network, including road
marks, buildings and vegetation are simulated.
Figure 12: Display window of multi-sensor results.
In this paper, the weather influences on object
detection are considered. Two simulation scenarios
are proposed:
Scenario 1: detection of road lanes while driving;
Scenario 2: detection of a ball bouncing in the
street.
Video streams recorded from the cameras are
selected as data for detection. Rain is added, as an
example of adverse weather effect, in both scenarios.
The main methodologies used for detections in these
two scenarios are Hough transformation (Duda and
Hart, 1972) and Background difference method
(Philip, 2013), respectively.
4.1 Road Lane Detection
A flow chart of the procedures to detect road lanes
using Hough transformation is shown in Figure 13.
Firstly, the rendered image from the camera is
converted into a ‘birds-eye view’ image. A Sobel
operator is applied to calculate thresholds of gradient
and color that represented by hue, saturation and
lightness (HSL) values. The lane line on both side of
car can be extracted thereafter. Then, the curve of
each line is fitted using sliding window technique to
derive the corresponding second degree polynomial
function. In such a way, the positions of pixel points
of lines can be obtained. The last step is to warp the
‘birds-eye view’ back to camera view with lines
projected.
Figure 13: Flow chart of Hough transformation.
4.2 Ball Detection
In Scenario 2, it is assumed that the bouncing ball is
the only dynamic obstacle in the scene, whereas the
car is not moving (for simplicity). The background
difference method is usually used where a scene is
relatively static – the stationary constraint for the car
can be relaxed by aligning the background between
frames using image registration, but this is not
considered here.
In the background difference method, a
background frame is selected first by taking an
average over a certain number of frames. In such a
way, the slow motion of raindrops can be neglected.
Then, a grayscale subtraction operation is performed
on the current frame image and the background image,
Weather Effects on Obstacle Detection for Autonomous Car
337
and the absolute values are taken. The values are
compared with a threshold value to generate
foreground pixels (values greater than the threshold).
Foreground pixels are determined thereafter. The
center of the ball can be calculated by enlarging the
foreground pixels.
5 RESULTS
5.1 Scenario 1
In Scenario 1, two simulations (Simulation 1.1 and
1.2) are tested. The car is set to start at the same
location and drive along the same road. Simulation
1.1 is driven in clear sky environment, while
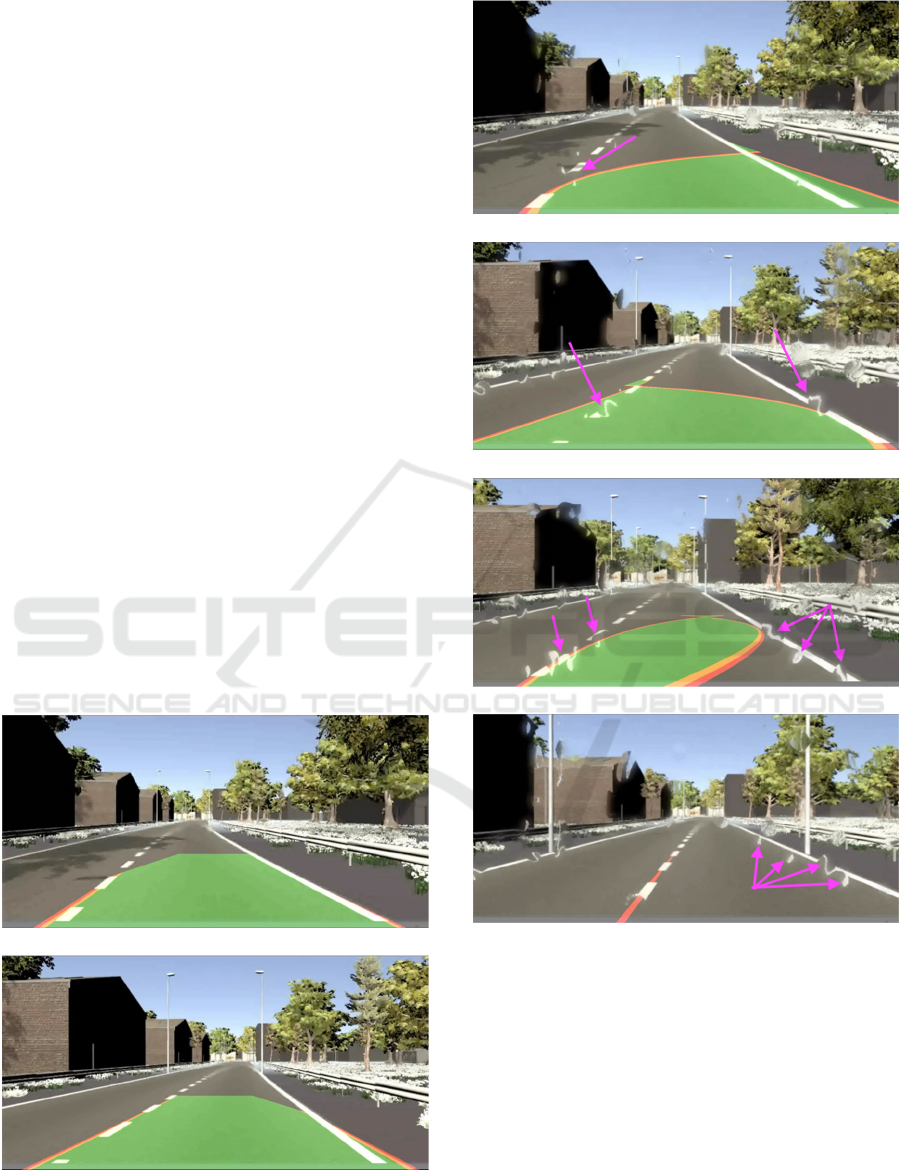
Simulation 1.2 is driven in rainy weather. The results
for road lane detection are shown in Figure 14 and 15,
respectively. The lane region is coloured in green,
with the outline plotted in red/yellow.
It can be seen from Figure 14 that road lanes can
be detected successfully, but with slight offsets at the
bottom of Figures 14(a) and (b). This is because the
lane color vanishes which leads to lower contrast.
However, in rainy conditions, offsets increase due to
distortions of the road lanes. Comparing Figure 15(a)
to (c), it can be seen that when the number of
distortion areas increases (more rain drops), offsets
increase as well. Moreover, in Figure 15(d), only the
road lane on the right side of car is segmented.
(a)
(b)
Figure 14: Road lane detection in clear sky. (a) and (b) are
the car driving at different time steps.
(a)
(b)
(c)
(d)
Figure 15: Road lane detection in rainy conditions. (a) to
(d) are the car driving at different time steps.
5.2 Scenario 2
In Scenario 2, two simulations (Simulation 2.1 and
2.2) are tested in clear sky and rainy conditions,
respectively. The results for detecting the bouncing
ball in these two simulations are presented in Figure
16 to 20 at different time steps. The centres of the
detected ball positions are marked using green boxes.
All segmentations of the ball in Simulation 2.1 are
successful. For Simulation 2.2, the ball can be
VEHITS 2020 - 6th International Conference on Vehicle Technology and Intelligent Transport Systems
338
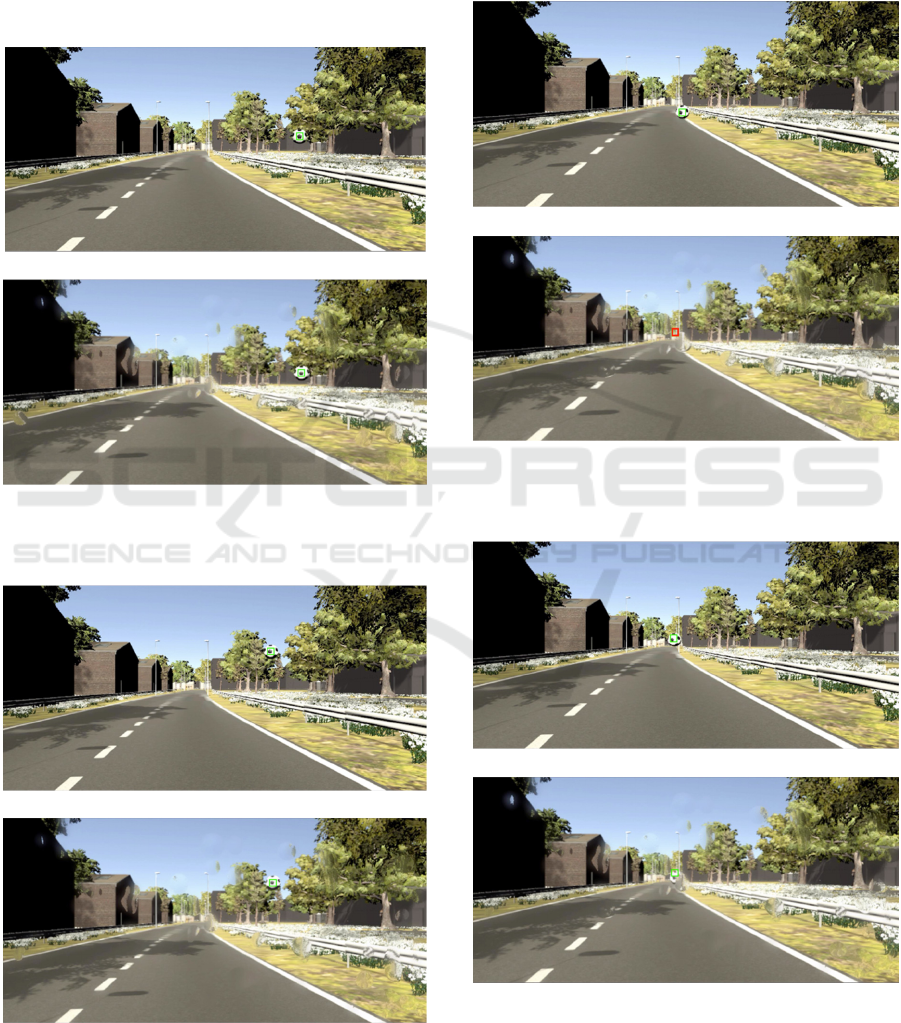
detected if the ball is not covered by raindrops, as
shown in Figure 16(b) and Figure 17(b). When the
ball is partly covered by raindrops (Figure 19b) or
near a raindrop (Figure 20b), the ball can still be
detected, but the center will be shifted. Whereas,
when the ball is fully covered by raindrops, it cannot
be detected at all. In this case, a red box is plotted in
the middle of the image, as shown in Figure 18(b).
(a)
(b)
Figure 16: Ball detection at time step 1. (a) Simulation 2.1,
(b) Simulation 2.2.
(a)
(b)
Figure 17: Ball detection at time step 30. (a) Simulation 2.1,
(b) Simulation 2.2.
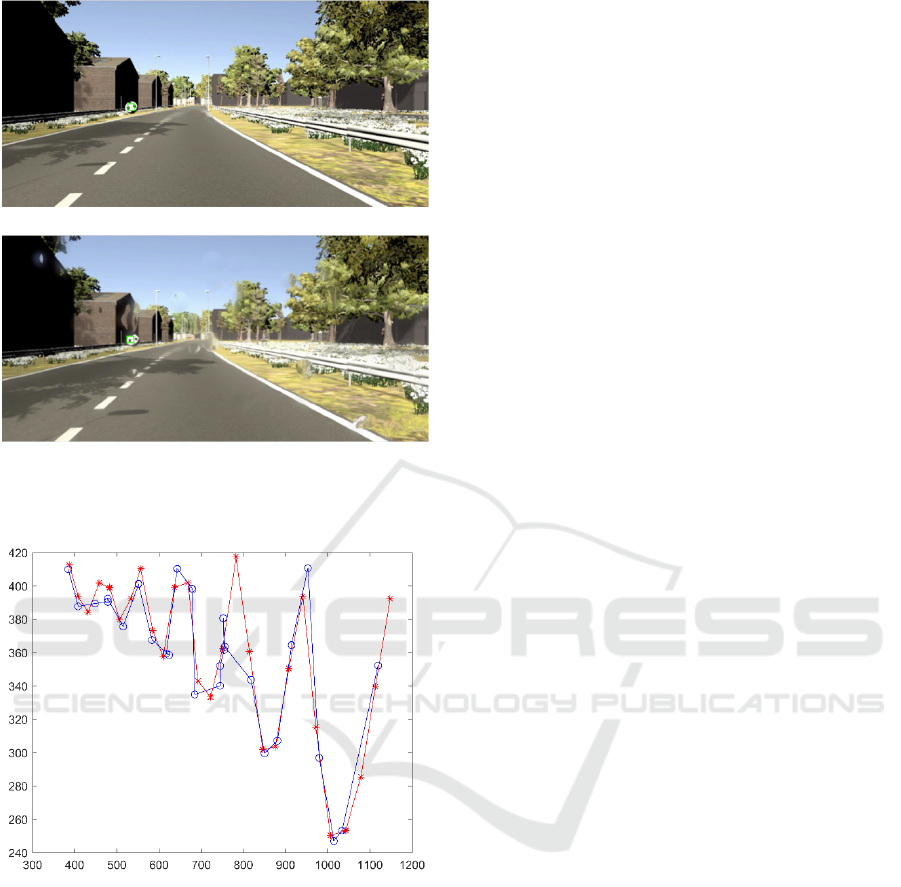
The detected positions of the bouncing ball are
plotted in Figure 21. The results of Simulation 2.1 and
2.2 are presented in red and blue color, respectively.
It can be investigated that there are offsets between
red and blue plots. The main reason is because of the
noise generated by raindrops.
(a)
(b)
Figure 18: Ball detection at time step 100. (a) Simulation
2.1, (b) Simulation 2.2.
(a)
(b)
Figure 19: Ball detection at time step 110. (a) Simulation
2.1, (b) Simulation 2.2.
Weather Effects on Obstacle Detection for Autonomous Car
339
(a)
(b)
Figure 20: Ball detection at time step 180. (a) Simulation
2.1, (b) Simulation 2.2.
Figure 21: Detected positions of the bouncing ball. Results
of Simulation 2.1 and 2.2 in clear sky and rainy weather are
presented in red and blue colour, respectively.
6 CONCLUSIONS
In this paper, a multi-sensor system has been
developed for the ALEAD project allowing
autonomous car models to perceive surrounding
environment in simulated scenes. The influence of
weather on the sensing data for each of the sensors
has been implemented to make the simulation as close
to a realistic environment as possible. Image
processing methods have been applied to detect road
lanes and a moving obstacle in rainy conditions.
Simulation results show that adverse weather can
have a significant effect on lane following and object
detection. In the case of moving object detection, the
ability to track and evade moving obstacles may
deteriorate significantly in rainy conditions.
For future work, more advanced segmentation
algorithms, such as deep learning methods, will be
applied to improve the accuracy of object detection
and tracking. Edge case usages for the sensors will be
simulated to enhance the realism and to explore the
‘worst case’ scenarios that are possible for
autonomous vehicles, for example, various light
conditions and sever rain, and to investigate the
response of automated driving systems in such cases.
ACKNOWLEDGEMENTS
This is a collaborative work between University of
Liverpool and CGA Simulation as part of the
Connected and Autonomous Vehicle programme. It
is funded by the Innovate UK, with Grant No.
104274.
The authors are also indebted to Mr. Dave
Griffiths and Mr Ben Mitchell for their work on
making the animations in the 3D scene and creating
the temperature map. Thanks to the feedback received
from Daimler on our previous work, and this paper is
a partial response to it.
REFERENCES
Ahire, A. S. (2014). Night vision system in BMW.
International Review of Applied Engineering Research,
4(1), 1-10.
Apollo. (2019). Apollo [online].
Badue, C., Guidolini, R., Carneiro, R. V., Azevedo, P.,
Cardoso, V. B., Forechi, A., ... & Oliveira-Santos, T.
(2019). Self-driving cars: A survey. arXiv preprint
arXiv:1901.04407.
Belfiore, F., Calcagno, A., Borgonovo, G., Castro, M. G.,
Pisasale, A., Platania, M., ... & Salomon, A. M. (2017,
October). A 76 to 81GHz packaged transceiver for
automotive radar with FMCW modulator and ADC. In
2017 European Radar Conference (EURAD) (pp. 143-
146). IEEE.
Bergelt, R., Khan, O., & Hardt, W. (2017). Improving the
intrinsic calibration of a velodyne lidar sensor. In 2017
IEEE SENSORS (pp. 1-3). IEEE.
Bernard, E., N. Rivière, M. Renaudat, M. Péalat and E.
Zenou (2014). Active and thermal imaging
performance under bad weather conditions. France,
Europe.
Dannheim, C., Icking, C., Mäder, M., & Sallis, P. (2014,
May). Weather detection in vehicles by means of
VEHITS 2020 - 6th International Conference on Vehicle Technology and Intelligent Transport Systems
340

camera and LIDAR systems. In 2014 Sixth
International Conference on Computational
Intelligence, Communication Systems and Networks
(pp. 186-191). IEEE.
Duda, R. O., & Hart, P. E. (1971). Use of the Hough
transformation to detect lines and curves in pictures
(No. SRI-TN-36). Sri International Menlo Park Ca
Artificial Intelligence Center.
Duthon, P., Colomb, M., & Bernardin, F. (2019). Light
transmission in fog: The influence of wavelength on the
extinction coefficient. Applied Sciences, 9(14), 2843.
Ess, A., Leibe, B., Schindler, K., & Van Gool, L. (2009,
May). Moving obstacle detection in highly dynamic
scenes. In 2009 IEEE International Conference on
Robotics and Automation (pp. 56-63). IEEE.
Filgueira, A., González-Jorge, H., Lagüela, S., Díaz-
Vilariño, L., & Arias, P. (2017). Quantifying the
influence of rain in LiDAR performance. Measurement,
95, 143-148.
Garg, K., & Nayar, S. K. (2005, October). When does a
camera see rain? In Tenth IEEE International
Conference on Computer Vision (ICCV'05) Volume 1
(Vol. 2, pp. 1067-1074). IEEE.
Goodin, C., Carruth, D., Doude, M., & Hudson, C. (2019).
Predicting the Influence of Rain on LIDAR in ADAS.
Electronics, 8(1), 89.
Griffith, E. J., Mishra, C., Ralph, J. F., & Maskell, S.
(2018). A system for the generation of synthetic Wide
Area Aerial surveillance imagery. Simulation
Modelling Practice and Theory, 84, 286-308.
Häne, C., Heng, L., Lee, G. H., Fraundorfer, F., Furgale, P.,
Sattler, T., & Pollefeys, M. (2017). 3D visual
perception for self-driving cars using a multi-camera
system: Calibration, mapping, localization, and
obstacle detection. Image and Vision Computing, 68,
14-27.
Hasirlioglu, S., Doric, I., Lauerer, C., & Brandmeier, T.
(2016, June). Modeling and simulation of rain for the
test of automotive sensor systems. In 2016 IEEE
Intelligent Vehicles Symposium (IV) (pp. 286-291).
IEEE.
Heinzler, R., Schindler, P., Seekircher, J., Ritter, W., &
Stork, W. (2019). Weather Influence and Classification
with Automotive Lidar Sensors. arXiv preprint
arXiv:1906.07675.
Kehrer, M., Pitz, J., Rothermel, T., & Reuss, H. C. (2018).
Framework for interactive testing and development of
highly automated driving functions. In 18.
Internationales Stuttgarter Symposium (pp. 659-669).
Springer Vieweg, Wiesbaden.
LGSVL Simulator (2019). LGSVL Simulator: An
Autonomous Vehicle Simulator [Online].
Miklić, D., Petrović, T., Čori
ć, M., Pišković, Z., & Bogdan,
S. (2012, May). A modular control system for
warehouse automation-algorithms and simulations in
USARSim. In 2012 IEEE International Conference on
Robotics and Automation (pp. 3449-3454). IEEE.
Nebuloni, R. (2005). Empirical relationships between
extinction coefficient and visibility in fog. Applied
optics, 44(18), 3795-3804.
Nyholm, S. (2018). The ethics of crashes with selfdriving
cars: A roadmap, II. Philosophy Compass, 13(7),
e12506.
Philip, A. S. (2013). Background subtraction algorithm for
moving object detection using denoising architecture in
FPGA. Int. J. Sci. Res, 2, 151-157.
Rasshofer, R. H., & Gresser, K. (2005). Automotive radar
and lidar systems for next generation driver assistance
functions. Advances in Radio Science, 3(B. 4), 205-209.
Rasshofer, R. H., Spies, M., & Spies, H. (2011). Influences
of weather phenomena on automotive laser radar
systems. Advances in Radio Science, 9(B. 2), 49-60.
RFpro. (2019). Driving Simulation | Deep Learning
Automated Driving | Vehicle Dynamics [Online].
Shimchik, I., Sagitov, A., Afanasyev, I., Matsuno, F., &
Magid, E. (2016). Golf cart prototype development and
navigation simulation using ROS and Gazebo. In
MATEC Web of Conferences (Vol. 75, p. 09005).
EDP Sciences.
Song, R., Wetherall, J., Maskell, S., & Ralph, J.F. (2019).
A Multi-Sensor Simulation Environment for
Autonomous Cars. In 2019 22nd International
Conference on Information Fusion (FUSION) (pp.).
IEEE.
Tideman, M., & Van Noort, M. (2013, June). A simulation
tool suite for developing connected vehicle systems. In
2013 IEEE Intelligent Vehicles Symposium (IV) (pp.
713-718). IEEE.
Velodyne Manual (2014). High Definition LiDAR - HDL
64E User Manual [Online].
VIRES (2019). VTD—virtual test drive [Online].
Xu, H., Gao, Y., Yu, F., & Darrell, T. (2017). End-to-end
learning of driving models from large-scale video
datasets. In Proceedings of the IEEE conference on
computer vision and pattern recognition (pp. 2174-
2182).
Weather Effects on Obstacle Detection for Autonomous Car
341
