
Classification of Driver Intentions at Roundabouts
Moritz Sackmann
1 a
, Henrik Bey
1 b
, Ulrich Hofmann
2
and J
¨
orn Thielecke
1
1
Institute of Information Technology, FAU Erlangen-N
¨
urnberg, 91058 Erlangen, Germany
2
Pre-Development of Automated Driving, AUDI AG, 85057 Ingolstadt, Germany
Keywords:
Automated Driving, Intention Classification, Trajectory Analysis, Pattern Recognition.
Abstract:
Classification of other drivers’ intentions is an important requirement for automated driving. We present
two methods to estimate whether a driver leaves a roundabout. The first, like many other approaches to this
problem, requires training data of the specific roundabout to extract typical behavior patterns. Afterwards,
these patterns are used for classification of other drivers’ intentions. The second approach generates typical
behavior patterns from a precise map. Consequently, no training data is required and classification can be
performed on arbitrary roundabouts as long as a map is available. Experimental evaluation on a real world
dataset of 266 trajectories shows that the performance of the map-based approach is comparable to the data-
driven approach. The classification result can be used in a later stage for behavior planning of automated
vehicles or driver assistance systems.
1 INTRODUCTION
Interpretation of the environment is a key enabler for
automated driving. Consider the situation depicted in
Figure 1. When the driver of the red vehicle is waiting
at the entrance of the roundabout, he needs to judge
whether the yellow vehicle will leave the roundabout
at the next exit. For this task, he can rely on turn
signals, however, this indicator is not always reliable.
Thus, in his decision, he also relies on certain aspects
of the vehicle dynamics, i. e., the perceived heading
and velocity.
An automated system that purely relies on its cur-
rent perception is unable to safely enter the round-
about until the yellow vehicle has actually left the
roundabout or passed the conflict area. To overcome
this limitation, we develop a method to estimate the
probability of another vehicle leaving the roundabout
based on certain features of its trajectory.
Another application of driver intent inference for
semi-automated vehicles is mentioned by Liebner et
al. (2012) and Zhao et al. (2017): Estimating the in-
tention of the driver of the ego vehicle can be used
to warn or support the driver in dangerous situations,
e. g., when a vulnerable road user is crossing the exit
of a roundabout that the driver is planning to take.
Hence, the driver intention needs to be estimated. The
a
https://orcid.org/0000-0001-9341-5800
b
https://orcid.org/0000-0003-4945-6802
Figure 1: The red vehicle wants to enter the roundabout.
Therefore, it needs to determine whether the yellow vehi-
cle is going to leave the roundabout and adapt its velocity
accordingly.
task is somewhat easier since for the driver of the
ego vehicle, additional information sources are avail-
able. For example, Zhao (2018) found that classifica-
tion performance in some scenarios was the highest
when incorporating features based on the drivers gaze
or head pose (p. 68f).
This kind of information is extremely hard to infer
from the exterior, which limits the practicality in real-
world applications. In contrast, we propose a method
based solely on aspects that are readily observable
from the outside, such as the vehicle’s velocity and
orientation, together with a precise map of the road
layout.
One key challenge when working with trajectory
data is that there is no obvious similarity or distance
Sackmann, M., Bey, H., Hofmann, U. and Thielecke, J.
Classification of Driver Intentions at Roundabouts.
DOI: 10.5220/0009344603010311
In Proceedings of the 6th International Conference on Vehicle Technology and Intelligent Transport Systems (VEHITS 2020), pages 301-311
ISBN: 978-989-758-419-0
Copyright
c
2020 by SCITEPRESS – Science and Technology Publications, Lda. All rights reserved
301

measure between trajectories. Even building a seem-
ingly simple nearest neighbor classifier requires to put
a lot of thought into the design of the distance func-
tion. The reason for this is that trajectories may differ
in temporal or spatial aspects or both. Instead of di-
rectly measuring the distance between trajectories in
the Euclidean space using distance measures as pre-
sented for example by Quehl et al. (2017) or Zheng
(2015), we suggest measuring the distance between
certain features of the trajectories, e. g., the curvature
or the heading angle, at fixed positions in the round-
about. We show that differing behaviors can be dis-
tinguished more easily through these features than by
measuring point distances in a world frame.
This paper is structured as follows: Following a
literature overview, the problem is formally described
in Section 3.1. Then, two possible solutions are
shown:
The data-driven approach in Section 3.2 con-
structs one prototype trajectory from a set of repre-
sentatives for both intentions (leaving and remaining).
The class probability is then estimated by a multitude
of naive Gaussian classifiers that measure the simi-
larity of the observed trajectory to both prototypes at
the current position. This yields good classification
results; however, it has the disadvantage of not be-
ing transferable to any other situation than the one on
which the classifier has been trained.
The information score, a metric to judge the qual-
ity of a classifier in our scenario, is introduced in Sec-
tion 3.3. Subsequently, Section 3.4 extends the data-
driven approach in order to maximize the information
score by combining multiple features, e. g., trajectory
curvature and heading angle, in the intention classifi-
cation.
Section 3.5 introduces a new optimization-based
classification approach that eliminates the need for
training data by generating behavior prototypes from
a map. The classification is performed similar to the
data-driven approach, namely by comparing the ob-
servation to the trajectory prototypes.
In Section 4, we compare both approaches. Hav-
ing access to prior knowledge, i. e., typical driver be-
havior, the data-driven approach acts as a baseline in
the evaluation. We show that the optimization-based
approach has a comparable performance to the data-
driven solution with the advantage of not requiring
any training data.
2 RELATED WORK
Existing approaches to solve the problem at hand can
be divided into two categories. Firstly, there are gen-
eral motion prediction approaches that predict the fu-
ture trajectories of other vehicles. The second group
comprises purely classification based approaches like
the one presented in this work.
Lef
`
evre et al. (2014) distinguish physics-based,
maneuver-based, and interaction-aware approaches to
trajectory prediction. Physics-based approaches such
as CV, CA, CTRV or CTRA (Schubert et al., 2008)
can only be used for short term predictions (Schreier,
2015).
Many of the maneuver-based approaches use a
maneuver recognition module in a first step that esti-
mates the likelihood of multiple maneuvers to accom-
plish a multimodal probabilistic prediction of the fu-
ture vehicle state. For this purpose, Deo et al. (2018)
learn coefficients of a Hidden Markov Model (HMM)
that describe the vehicle’s state change with respect
to the performed maneuver in a highway scenario.
Schreier (2015) employs a Bayesian network to de-
tect lane changes and turn maneuvers. Using evidence
variables, such as velocity and vehicle heading, the
executed maneuver is inferred.
Further approaches to maneuver recognition can
be categorized into the following categories: Hidden
Markov Models (Meyer-Delius et al., 2008; Streubel
and Hoffmann, 2014), Artificial Neural Networks
(Phillips et al., 2017), Dynamic Bayesian Networks
(Gindele et al., 2015; Schulz et al., 2018), and Gaus-
sian Processes (Tran and Firl, 2013). All aforemen-
tioned approaches are developed for one specific do-
main, either highways, urban intersections or round-
abouts.
Many approaches, such as (Liebner et al., 2012;
Vasquez et al., 2009; Morris and Trivedi, 2011; K
¨
afer
et al., 2010), are tailored to specific situations which
means that they need to be trained or adjusted to ev-
ery new traffic situation. We agree that this assump-
tion is feasible in some domains and that the knowl-
edge gained from this restriction can be useful for
both classification and prediction. Nevertheless, our
approach is designed to work without knowledge of
historical motion patterns by using generic prototype
trajectories that can be generated from a map.
In order to classify intentions without any ex-
amples of driver behavior, Schulz et al. (2018) and
Schreier (2015) implicitly assume that drivers try to
follow the lane center and steer towards it. However,
this approach does not allow for capturing subtle be-
havior patterns, e. g., cutting corners. Consequently,
Schulz et al. (2019) deploy a neural network to learn
how drivers accelerate and steer depending on their
environment and vehicle state. Lef
`
evre et al. (2012)
use “exemplar paths” instead of the lane center for the
same purpose, but do not explain how these paths are
VEHITS 2020 - 6th International Conference on Vehicle Technology and Intelligent Transport Systems
302
generated or if they are extracted from data.
In this work, we extend the idea of exemplar paths.
Firstly, we extract them from previous observations.
Secondly, we generate them from a precise map based
on ideas that were conceived by Ziegler et al. (2014)
in a different context. Ziegler et al. present a method
that is used for trajectory planning of the ego vehicle.
We implement a similar method to generate prototype
trajectories for each of our hypotheses on a map.
3 APPROACH
First, we present a probabilistic method to classify
the driver intention (leaving or remaining) at a round-
about from observations. This method extracts one
prototype trajectory from a set of representatives for
each intention class in the learning stage. Later, the
classification of a trajectory is performed by compar-
ing it to each prototype.
This method cannot be used to perform classifica-
tion at roundabouts where no previous observations
are available. Nevertheless, it lays the foundation of
a second method that generalizes to unseen round-
abouts. Furthermore, it acts as a baseline for evalu-
ating the performance of this second method.
To be able to generalize to unseen roundabouts,
we generate the prototypes using an optimization-
based method instead of extracting them from obser-
vations. For this, we briefly introduce the work of
Ziegler et al. (2014) to generate an optimal trajectory
given an initial state and a map. After showing that
this method generates realistic prototype trajectories,
a classification on this basis is shown.
3.1 Problem Statement
Let T = R ∪L be a set of trajectories T
i
, where L =
{T
1
,T
2
,...,T
N
} denotes the trajectories leaving the
roundabout at a specific exit and R = {T
N+1
,...,T
M
}
refers to the trajectories remaining inside.
Each trajectory T
i
= (x
1
,x
2
,...) consists of the ve-
hicle positions x
k
at fixed sample times in a common
world frame. Our goal is to estimate the probability of
a partially observed trajectory T
j
belonging to L or R
and to guess the correct intention as early as possible.
All information available to reason about the ma-
neuver that is currently executed by the driver is fully
included in the trajectory. Instead of directly compar-
ing the trajectories in a Cartesian coordinate system,
we opt to compare certain aspects of the trajectories
that are more suitable for expressing differences be-
tween maneuvers, such as curvature or heading angle.
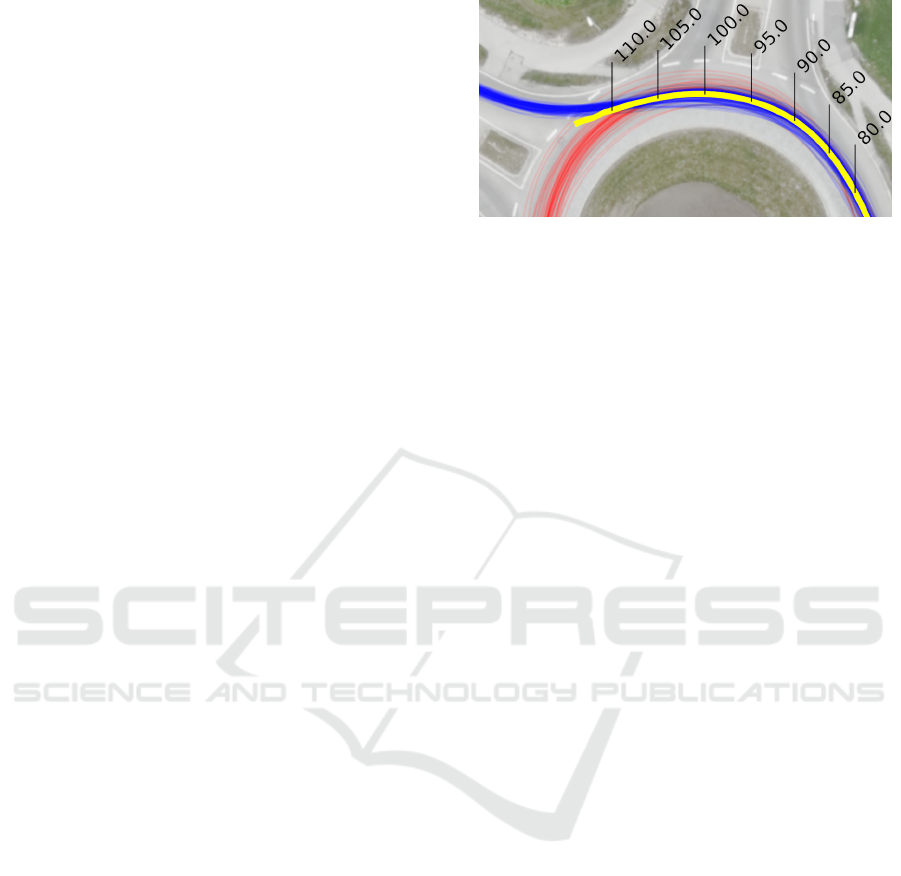
Figure 2: Vehicles driving through the roundabout, leav-
ing at the exit around x = 110m (blue) or remaining inside
(red). Yellow: Frenet axis. The Frenet x coordinate is de-
fined as the arc length along the Frenet path. Here, it starts
around x = 80m, because only the interesting part before
the exit of the roundabout is depicted. It acts as the axis of
a curvilinear coordinate system which proves to be a more
suitable representation for the classification problem than a
Cartesian coordinate system.
Figure 2 shows that the trajectories of vehicles
leaving the roundabout around x = 110m are highly
overlapping in the Cartesian frame with those of ve-
hicles which remain inside the roundabout. Until
shortly before the exit, their difference in Cartesian
coordinates is marginal. In contrast, when examining
the curvature of these trajectories in Figure 3, the dif-
ference between the two maneuvers becomes appar-
ent approximately 10 m before the exit. For a vehicle
travelling at 30km/h, this corresponds to a reduction
of the detection time of more than 1 s.
Using standard filtering techniques, various as-
pects of the vehicle state can be estimated from sensor
observations. In particular, our experiments show that
the vehicle’s heading angle and the trajectory curva-
ture represent the most informative aspects for classi-
fication, whereas the velocity and acceleration are less
expressive with respect to the driver’s intent. More-
over, the vehicle’s offset to the lane center allows for
intention classification much later than heading angle
and trajectory curvature and consequently does not
contribute any information to the classification prob-
lem.
In this paper, we thus focus on intention classifi-
cation using the vehicle heading and trajectory curva-
ture. However, we use the abstract terms aspects or
features in the remainder, in order to emphasize that
the method is not restricted to these two quantities.
Other situations are conceivable, in which the veloc-
ity and acceleration allow for a clear separation of two
intentions. This is for example the case, when the task
is to decide whether vehicles will stop before entering
a roundabout.
Comparing such aspects instead of the actual tra-
jectory however leads to the following problem: since
Classification of Driver Intentions at Roundabouts
303

70 80 90 100 110
−0.10
−0.05
0.00
0.05
0.10
Frenet x-coordinate in m
Curvature in 1/m
Mean Remaining µ
R
κ
Mean Leaving µ
L
κ
Remaining
Leaving
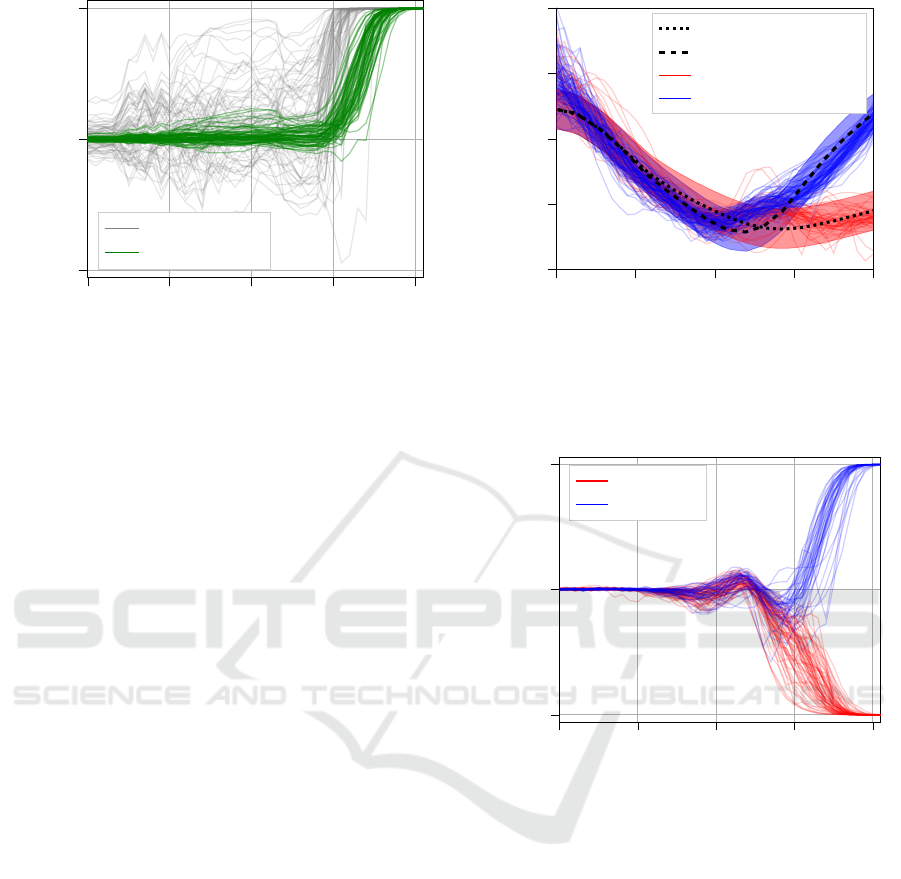
Figure 3: Curvature of trajectories of vehicles that are driv-
ing through the roundabout. The vehicles enter the round-
about around x = 60m, drive a slight right curve around
x = 70m, then steer to the left in order to proceed in the
roundabout. It is evident that for those vehicles that re-
main in the roundabout around x = 100m, the curvature
remains approximately constant as they are driving on a cir-
cular path.
each trajectory has an individual velocity profile, the
data is temporally non-aligned. There are approaches
to measure the distance between time series of differ-
ing length such as dynamic time warping, first pro-
posed by (Vintsyuk, 1972).
We refrain from using them, because there is a
more natural index than time for similarity measure-
ments between vehicle trajectories when a default
path, such as the road center or the average driven
path, is available: The Frenet frame.
The Frenet frame acts as a curvilinear coordinate
system. As shown in Figure 2, the main axis can be
determined from the original trajectories as follows:
using fast dynamic time warping (Salvador and Chan,
2007), the trajectories are pairwise temporally aligned
in the Cartesian coordinate system. Each aligned pair
of trajectories is reduced to one by calculating the av-
erage position at each time step. This process is re-
peated iteratively until one single average path is left,
which is the primary axis of the Frenet frame. The
secondary axis is orthogonal to the first axis.
Now, we transform all trajectories T and their as-
pects from the time-indexed Cartesian world coordi-
nate system to the Frenet frame by projecting them
onto the Frenet axis. This way, the original tempo-
rally aligned data can be converted to a space-aligned
data series. For our experiments, we want to judge
the values of certain aspects of the trajectories at spe-
cific positions. We thus use linear interpolation with
a resolution of 1m. All the aspects, e. g., velocity, ac-
celeration and curvature, are estimated in the Carte-
sian frame and then mapped to the Frenet frame. Let
L
F
and R
F
denote the set of trajectories of vehi-
cles leaving and remaining in the roundabout in the
Frenet frame. Each trajectory T
F
i
= (x
F
1
,x
F
2
,...,x
F
k
)
now consists of the same number of state estimates at
fixed positions in the Frenet frame. A state estimate
x
F
j
= (x
F
j
,y
F
j
,v
C
j
,a
C
j
,θ
C
j
,κ
C
j
) in the Frenet frame com-
prises the position (x
F
,y
F
) in the Frenet frame and
the velocity v
C
, acceleration a
C
, heading θ
C
, and tra-
jectory curvature κ
C
estimated in the Cartesian frame
(thus superscript C), but projected to the correspond-
ing position in the Frenet frame. For the sake of sim-
plicity, the notation x
F
i,10m
denotes the state estimate
of the ith vehicle at position x = 10m in the Frenet
frame. Likewise, e. g., κ
C
i,10m
denotes the curvature
of the trajectory in the Cartesian coordinate system of
the ith vehicle at the Frenet coordinate x = 10m.
3.2 Data-driven Trajectory
Classification
In the Frenet frame, it is possible to estimate a mean
course of all the aspects as well as their degree of dis-
persion. For the curvature, the mean course of the
leaving vehicles
µ
L
κ,x
=
1
|L
F
|
|L
F
|
∑
i=1
κ
C
i,x
(1)
is depicted in Figure 3. The corresponding standard
deviation is
σ
L
κ,x
=
1
|L
F
|
v
u
u
t
|L
F
|
∑
i=1
κ
C
i,x
−µ
L
κ,x
2
. (2)
The plot shows that a classification based only on the
curvature of the trajectories could be realized with
high confidence after x = 100m, approximately 12m
before the exit, by simply comparing the values to a
fixed threshold.
For our application, a realistic estimation of the
probability of each hypothesis is extremely important,
since reliable estimates of each hypothesis’ probabil-
ity are especially vital for the derivation of a safe and
comfortable driving policy.
We thus implement a simple Bayesian classifi-
cation based on the following idea: Assuming that
we observe an incomplete trajectory T
0
of a vehicle
with unknown intention and estimate its curvature at
x = 100m to be κ
C
i,100m
= κ
∗
, the probability of be-
longing to the class of vehicles leaving the roundabout
can be estimated using Bayes’ theorem
P(T
0
∈ L|κ = κ
∗
) =
P(κ = κ
∗
|T
0
∈ L)
P(κ = κ
∗
|T
0
∈ T )
(3)
VEHITS 2020 - 6th International Conference on Vehicle Technology and Intelligent Transport Systems
304

where
P(κ = κ
∗
|T
0
∈ T ) =P(κ = κ
∗
|T
0
∈ R ) ·P(T
0
∈ R )
+P(κ = κ
∗
|T
0
∈ L) ·P(T
0
∈ L)
(4)
is given by the product rule. P(T
0
∈R ) and P(T
0
∈L)
is situation-specific a priori knowledge that describes
the prior probability of a driver leaving the round-
about at that exit. If not available, it can be set to 0.5.
The conditional distributions P(κ = κ
∗
|T
0
∈ R ) and
P(κ = κ
∗
|T
0
∈ L) can be estimated from the data by
assuming that they follow a normal distribution, i. e.,
P(κ = κ
∗
|T ∈ L) ∼ N
µ
L
κ,x
∗
,(σ
L
κ,x
∗
)
2
, (5)
and by estimating µ
L
κ,x
∗
and σ
L
κ,x
∗
from L at the posi-
tion x = x
∗
as shown in (1) and (2).
Note that this methodology uses only the informa-
tion at the current point on the Frenet axis rather than
the full trajectory history. The prediction at the next
point on the Frenet axis, again, uses only the state esti-
mation at that point. Thus, for classifying a complete
trajectory at K points along the Frenet axis, K inde-
pendent Bayesian classifiers according to (3) will be
used. This makes the method sensitive to observation
noise, which needs to be addressed by a proper state
estimation in a preprocessing step.
3.3 What Makes a Good Classification?
There are three desirable properties that a good classi-
fication of driver intent at roundabouts should satisfy.
Firstly, since a misclassification can be extremely
harmful, wrong intention classifications should be
avoided under any circumstances. Secondly, as long
as there is not enough evidence available, the classi-
fication should express its uncertainty by yielding a
probability estimate close to the prior probabilities.
And thirdly, the intention should be classified as early
as possible. Below, we will present a metric for judg-
ing the quality of a classifier that captures these prop-
erties.
The requirements lead to an extension of the well-
known binary cross entropy (Murphy, 2012) to time
series. The classifier estimates the probability p
i,x
=
P(T
F
i,x
∈ L) of the ith vehicle leaving the roundabout
from the information available at position x. For this
single point prediction, the score is defined as
s
i,x
= c
i
·log
2
(p
i,x
) + (1 −c
i
)log
2
(1−p
i,x
) (6)
where
c
i
=
(
1 if T
i
∈ L
0 if T
i
∈ R
. (7)
70 110
80 90 100
Frenet x coordinate in m
0.0
0.2
0.4
0.6
0.8
1.0
−2.5
−2.0
−1.5
−1.0
−0.5
Classification score
Probability
Figure 4: Estimated probability of 24 vehicles leaving the
roundabout at the positions corresponding to the Frenet axis
in Figure 2. The classification score per prediction accord-
ing to (8) determines the color of each line. It is visible
that early predictions are rated better than late predictions
and that mispredictions are strongly discouraged. Note that
earlier detections do not necessarily entail a better classifi-
cation score, if they underestimate the probability of leaving
at another point.
By averaging this score over all points X in the
Frenet system at which a classification is performed,
an overall classification score
s
i
=
1
|X|
∑
x∈X
s
2
i,x
(8)
can be assigned to a set of predicted probabilities at all
positions X along the Frenet axis in the roundabout.
This formula satisfies the three initial require-
ments: Misclassifications are rated very negatively, as
can be seen by setting c
i
= 1 and p
i,x
= 0.1 in (6).
This would result in a score of −3. Uncertain classi-
fications (e. g., c
i
= 1 and p
i,x
= 0.5) receive a score
of −1 and are rated slightly worse than correct classi-
fications (e. g., c
i
= 1 and p
i,x
= 1) with a score of 0.
Detecting the intention of leaving early is rated better
than detecting it late, but only if this does not make
the classification susceptible for misclassifications.
The classification score s
i
is shown for a set of 24
vehicles leaving the roundabout in Figure 4. The best
possible score is 0, if a probability of 1 is assigned to
the correct class all the time. Conversely, as p →0 for
the correct class, the score approaches −∞.
Finally, the information score
H
C
(E) =
1
|E|
|E|
∑
i=1
s
i
(9)
rates the performance of a classifier C for a set of ex-
ample trajectories E. This metric can be used to draw
conclusions on different approaches to the classifica-
tion problem. We use it extensively to parametrize
Classification of Driver Intentions at Roundabouts
305

classification approaches in a way that maximizes the
information score as will be shown in the following
section.
3.4 Maximizing the Information Score
Equation (5) suggests estimating the mean course of
each aspect as well as the standard deviation directly
from the training dataset. For small datasets, this
is disadvantageous, because the variance estimations
fluctuate strongly along the Frenet axis. This in turn
leads to overly confident probability estimates in the
classification and thus in a low information score. To
solve this problem, the variance (σ
T
κ,x
)
2
is not esti-
mated at a single point x but rather on a narrow inter-
val [x −a, x + a] from the joint set of trajectories T .
Thus, σ
L
κ,x
= σ
R
κ,x
= σ
T
κ,x
.
Evaluation of the information score shows that
this improves the score compared to directly estimat-
ing the two vectors of the standard deviation for both
groups along the Frenet-axis.
Until now, only the curvature of the trajectory has
exemplarily been used for classification. By incorpo-
rating further aspects, the robustness of the classifica-
tion can be improved. For this, we augment the state
estimate in the Frenet frame by the following aspects:
Velocity, acceleration, heading angle, curvature, lat-
eral deviation from center. We denote them as the
features of the state vector f
i,x
of the ith vehicle at po-
sition x.
The resulting classifier C
w
classifies according to
a multivariate normal distribution
C
w
: P(f
x
= f
i,x
|T
i
∈ L) ∼ N
µ
L
f,x
,WΣ
L
f,x
, (10)
where W = diag(w) is a diagonal weight matrix and
the covariance matrix Σ
L
f,x
is assumed to be diagonal
with the variances estimated as shown in (2).
The weights are determined by setting them ac-
cording to
argmax
w
H
C
w
(E) (11)
using the derivative-free Nelder-Mead optimization
algorithm (Gao and Han, 2012). This method auto-
matically balances the importance of the different fea-
tures in the classification. Note that a high weight for
one component effectively leads to a high variance of
that component in (10), thus it will be effectively ig-
nored in the classification. Conversely, a low weight
value renders the component highly relevant for the
classification.
We found that during this optimization, consis-
tently only the heading angle and the curvature of
the trajectory significantly influence the classification
performance while the other aspects such as velocity
and acceleration have a negative impact on the clas-
sification performance. The reason for this is that the
heading angle and the curvature describe the shape
of the trajectory whereas the velocity and their accel-
eration describe the dynamics of the trajectory. The
shape of all trajectories leaving the roundabout is nec-
essarily similar whereas the dynamics may vary de-
pending on the driving style, other interacting vehi-
cles and vulnerable road users. Incorporating these
aspects is investigated by Liebner et al. (2012) for
vehicles approaching an intersection. However, it is
not transferable to roundabout situations, because the
velocities of vehicles crossing an intersection differ
considerably from those that turn left or right while
the same cannot be said about vehicles leaving or re-
maining in a roundabout.
There is also another interpretation to the weight
matrix W: Effectively, multiplying this matrix with a
scalar larger than 1 brings the classifier’s probability
estimates closer to 0.5. This leads to a more robust
classification, because there will be less wrong prob-
ability estimates. On the other hand, this also delays
the point where a trajectory can be classified as leav-
ing or remaining with high probability. In practice,
this can be used for an application-dependent trade-
off between robustness and earliness of the classifi-
cation. In the following, we restricted ourselves to
setting the weight matrix as determined by the opti-
mization.
3.5 Optimization-based Trajectory
Classification
To eliminate the need for previous observations of
the roundabout, i. e., training data, we implemented a
method similar to the one presented by (Ziegler et al.,
2014). Given a road section that is defined by its left
and right boundaries represented by polygonal chains,
and an initial vehicle state, this method generates a
trajectory that always lays within the road and that
balances the main aspects of the vehicle dynamics.
This is achieved by formulating an optimization prob-
lem that minimizes a weighted sum of cost terms that
punish acceleration, jerk, yaw rate, deviations from a
typical velocity and from the direction of the road as
well as deviations from the road center. The weights
directly influence the driving style, thus allowing for
trade-offs. For example, lowering the weight for ac-
celerations allows for trajectories that brake and ac-
celerate more strongly and that drive through curves
more quickly, leading to higher lateral accelerations.
As the weights strongly influence the resulting trajec-
tories, we manually set them to fit to a subset of the
training trajectories.
VEHITS 2020 - 6th International Conference on Vehicle Technology and Intelligent Transport Systems
306

80.
85.
90.
95.
100.
105.
110.
synthetic trajectories
ground truth trajectories
Figure 5: Two synthetic trajectories (dotted) are generated
for two discrete behavior options: Leaving the roundabout
around x = 110m or remaining in the roundabout. They re-
semble the ground truth trajectories. The green and orange
lines show the left and right boundaries of the road segments
that were used for generating the synthetic trajectories. The
corresponding Frenet axis is overlaid in yellow.
The result of the optimization is a trajectory of
positions at fixed time steps. Velocity, acceleration
and jerk can be estimated from this trajectory by tak-
ing the first, second, and third order derivatives. The
heading can be determined by calculating the angle
between two successive trajectory points and the cur-
vature is estimated using the formula of the Menger
curvature that determines the radius of a circle that
passes through three points.
Ziegler et al. (2014) employ this method in an
MPC-like manner for planning the trajectory of an au-
tomated vehicle. We implement the same approach
with slight modifications to generate trajectory pro-
totypes for a road section. These can be calculated
off-line for discrete decision points on the map, e. g.,
roundabouts and intersections, and be stored in con-
junction with the map data. The optimized trajecto-
ries for vehicles that leave or proceed in the round-
about, together with the actual driven trajectories for
both classes, are illustrated in Figure 5.
To perform a classification similar to (3), the mean
course and the course of the standard deviation of the
curvature and the heading of the trajectory are re-
quired. The mean course can be directly extracted
from the generated trajectories. The standard devia-
tion can be determined in a subsequent optimization
loop similar to (10) and (11) by setting the standard
deviation of each aspect individually to the constant
value
Σ
∗
= argmax
Σ
H
C
o
Σ
(E) (12)
that maximizes the information score of the classifier
C
o
Σ
: P(f
x
= f
i,x
|T
i
∈ L) ∼ N
µ
L,o
f,x
,Σ)
. (13)
Note that the standard deviation of the curvature and
the heading angle are now constant along the com-
plete Frenet axis and equal for both classes. Fur-
thermore, no covariance is estimated, i. e., Σ
∗
=
diag(σ
2
κ
,σ
2
θ
) is a diagonal matrix. Our previous ex-
perience with the data-driven classifier lead us to use
only curvature and heading for classification.
4 RESULTS
The data used in this paper was collected using a
drone hovering over two roundabouts. Subsequently,
the footage was processed to extract the vehicle tra-
jectories using a deep neural network. The details of
this process are out of the scope of this paper, we re-
fer to (Bock et al., 2019) and (Zhan et al., 2019) who
describe a similar processing pipeline.
Using the drone data has two advantages: First,
the data is very diverse, because many driving styles
have been captured. Second, it was possible to cap-
ture many full trajectories from the entrance arms to
the exit arms of the roundabout in parallel.
The dataset for the first exit consists of 50 vehi-
cles remaining in the roundabout and 92 trajectories
leaving the roundabout. We split the data into a train-
ing and a test set of equal size. The training set itself
was again split into two sets of equal size. On the
first training set, the mean course and standard devi-
ation of curvature and heading were determined. The
second training set was used to determine the weights
of each aspect as described by equation (11). This
leads to the heading being more relevant to the classi-
fication result than the curvature. Moreover, a second
roundabout dataset is used for evaluation, consisting
of 70 vehicles leaving the roundabout and 54 vehicles
remaining inside.
4.1 Data-driven Classification
The classification results for the data-driven classifier
are shown in Figure 6. We implemented the classifi-
cation with respect to the following aspects: velocity,
acceleration, curvature, and heading. However, only
curvature and heading have an effect on the classifi-
cation performance.
Increasing both weights by a scalar factor delays
the prediction. This can be seen in Figure 6: Al-
most all trajectories are classified correctly around
x = 105m using the non-weighted classifier, whereas
the weighted classifier delays the point where the cor-
rect class was assigned a probability of 1 by approx-
imately 5 meters. On the other hand, the weighted
classifier is more robust to outliers and returns consid-
erably better probability estimates where no sufficient
information is available (e. g., between x = 70m and
x = 90m) and never assigns a high probability to the
Classification of Driver Intentions at Roundabouts
307
70 80 90 100 110
0
0.5
1
Frenet x coordinate in m
Correct class probability
Non-Weighted
Weighted
Figure 6: Classification results for the data-driven classifi-
cation. A value of 1 means that the correct class is assigned
a probability of 1. It is visible that implementing the weight-
ing as described in (11) significantly improves the robust-
ness of the classification. The lowest probability assigned
to the wrong class is 3% for the non-weighted classifier; it
is 42% for the improved classifier.
wrong class. In effect, the weight can also be inter-
preted as a parameter to trade off the robustness of the
classification against its earliness, similar to a receiver
operating characteristic (ROC) curve. The classifica-
tion results on the training set do not differ notably
from the results on the test set.
4.2 Optimization-based Classification
Two synthetic trajectories, generated by the optimiza-
tion, are depicted in Figure 5. For their parameter
set, they represent an optimal way of driving through
the roundabout by balancing the different dynamic as-
pects (i. e., velocity, acceleration, and shape of the tra-
jectory). One constraint during the optimization was
that a vehicle of width 2 m should always be located
fully within the road boundaries. Without this re-
quirement, it would be possible for the generated tra-
jectories to overlap with the road boundaries at some
points.
The real vehicles drive slightly different, which
can be seen in Figure 7. The reason for this is that
the optimal trajectories cut corners as closely as possi-
ble whereas human drivers seem to prefer some safety
distance. While it would be possible to integrate this
as an additional cost term of the optimization, we de-
cided to neglect this in order to avoid an overly com-
plex model.
These slight discrepancies, which also appear in
the heading angle of the synthetic prototypes, de-
grade the classification performance compared to the
data-driven approach. Notably, there are some areas
70 80 90 100 110
−0.10
−0.05
0.00
0.05
0.10
Frenet x coordinate in m
Curvature in 1/m
Optimized remaining
Optimized leaving
Remaining
Leaving
Figure 7: Curvature of the synthetic trajectories and one
standard deviation (transparent) that results from the opti-
mization (12). The course of the synthetic values approxi-
mately matches the course of the actual data that has been
shown before in Figure 3.
70 80 90 100 110
0
0.5
1
Frenet x coordinate in m
Prob. of leaving the roundabout
Remaining
Leaving
Figure 8: Estimated probabilities of leaving the roundabout
for the optimization-based classification. Due to a slight
difference between the prototypes and the actual data, the
probability estimates are biased between x = 90m and x =
100m. Thus, the classifier tends to assign a high probability
to the class leaving and later to the class remaining.
where all trajectories tend to be classified as remain-
ing, because the leaving prototype cuts the corner and
thus changes its curvature and heading earlier than the
other trajectories. This can be mitigated by comparing
the current observation to multiple copies of the pro-
totype, shifted to the left and to the right in the Frenet
frame. This effectively allows for detecting delayed
(non-optimal) maneuvers executed by human drivers.
The resulting course of the probabilities for the re-
maining and the leaving class is depicted in Figure 8.
VEHITS 2020 - 6th International Conference on Vehicle Technology and Intelligent Transport Systems
308

65.
70.
75.
80.
85.
90.
Figure 9: Frenet axis, real trajectories and synthetic proto-
types for the second scenario.
4.3 Comparison
The weighted data-driven and the optimization-based
approach can be compared by contrasting Figure 6
and Figure 8. In order to visualize the systematic bias
of the optimization-based approach, the correspond-
ing plot separately depicts the remaining and leaving
probabilities. Apart from that, the evaluation is per-
formed on the same dataset and is a good base for a
comparison.
The data-driven approach is non-biased, the clas-
sification performance is consistent on the complete
dataset and it yields slightly better probability esti-
mates. The point where the correct class is assigned a
probability of at least 95% is on average at 105.8m±
1m for the data-driven approach whereas it is slightly
earlier at 104.4m ±1.6m for the optimization-based
approach.
As both classifiers output a class probability, sub-
sequent planning approaches can either use this value
directly, or, if a binary decision is required, perform a
thresholding. For our evaluation, we use 95% as the
detection threshold. However, this is an application-
specific parameter which always requires a trade-off
between reliability and earliness of classification.
Figure 10 shows a similar classification scenario
in a different roundabout. Here, the same proper-
ties of the classification emerge: Around x = 70m,
the optimization-based classifier is biased towards the
class remaining. In this scenario, the data-driven ap-
proach detects the correct class with 95% on average
at 83.5m±0.89m. The optimization-based approach
detects the correct class at 85m±1.1m.
The proposed classification method comes with
negligible runtime costs. In order to determine the
probability of an observed vehicle leaving the round-
about, only (3) needs to be evaluated, which en-
tails evaluation of two multivariate normal probabil-
ity density function values. However, this requires
two prototype trajectories for both hypotheses. The
implemented trajectory generation method was origi-
nally designed for on-line trajectory planning Ziegler
40
60
80
0
0.2
0.4
0.6
0.8
1
Frenet x coordinate in m
Correct Class Probability
optimization-based
data-driven
Figure 10: Comparison of optimization-based and data-
driven approach at another exit for 70 vehicles leaving the
roundabout and 54 vehicles remaining in the roundabout.
The corresponding Frenet axis is shown in Figure 9.
et al., 2014. Nevertheless, as no on-line knowledge
is required for the trajectory optimization in our case,
we generate them in advance and store them in con-
junction with the map.
In conclusion, the classification performance of
the optimization-based approach is comparable to the
data-driven approach. The optimization-based ap-
proach eliminates the need for training data, i. e., no
prior data acquisition is required. Moreover, it is more
versatile than the data-driven approach, because it can
be applied to arbitrary roundabout situations as long
as a precise map is available.
5 CONCLUSIONS
We presented two methods for estimating the prob-
ability of a driver leaving a roundabout or remain-
ing inside. Both methods build up trajectory proto-
types for the two possible maneuvers. The first, data-
driven method extracts the prototypes from training
data, which ties it to that specific situation. The sec-
ond, optimization-based method generates the proto-
types from a precise map, eliminating the need for any
previous observations. This makes the optimization-
based method a versatile tool applicable to real world
scenarios.
We found that the curvature and heading angle are
the most reliable features for classifying intentions in
this situation. Based on these features, we compared
both approaches and showed that, albeit having no
further prior knowledge than a map, the optimization-
based approach has a comparable performance to the
data-driven approach.
Classification of Driver Intentions at Roundabouts
309

Future work might address the extension of the
method to other traffic situations, e. g., intersections
or inbound roundabout arms. The results of this work
can be helpful for behavior planning of automated ve-
hicles or advanced driver assistance systems.
ACKNOWLEDGMENTS
A big thank you goes to Richard Schneidt for captur-
ing the trajectory dataset and to Moritz Oertel for his
support with the implementation of the optimization-
based trajectory generation.
The German Federal Ministry of Economics and
Energy funded this research within the project @City:
Automated Cars and Intelligent Traffic in the City.
This work was supported by AUDI AG.
REFERENCES
Bock, J., Krajewski, R., Moers, T., Runde, S., Vater, L.,
and Eckstein, L. (2019). The inD Dataset: A Drone
Dataset of Naturalistic Road User Trajectories at Ger-
man Intersections. arXiv preprint arXiv:1911.07602.
Deo, N., Rangesh, A., and Trivedi, M. M. (2018). How
Would Surround Vehicles Move? A Unified Frame-
work for Maneuver Classification and Motion Pre-
diction. IEEE Transactions on Intelligent Vehicles,
3(2):129–140.
Gao, F. and Han, L. (2012). Implementing the Nelder-Mead
simplex algorithm with adaptive parameters. Com-
putational Optimization and Applications, 51(1):259–
277.
Gindele, T., Brechtel, S., and Dillmann, R. (2015). Learn-
ing Driver Behavior Models from Traffic Observa-
tions for Decision Making and Planning. IEEE Intel-
ligent Transportation Systems Magazine, 7(1):69–79.
K
¨
afer, E., Hermes, C., W
¨
ohler, C., Ritter, H., and Kum-
mert, F. (2010). Recognition of situation classes at
road intersections. In IEEE International Conference
on Robotics and Automation, pages 3960–3965, An-
chorage, AK.
Lef
`
evre, S., Laugier, C., and Ibanez-Guzman, J. (2012).
Risk assessment at road intersections: Comparing in-
tention and expectation. In IEEE Intelligent Vehi-
cles Symposium, pages 165–171, Alcal de Henares ,
Madrid, Spain. IEEE.
Lef
`
evre, S., Vasquez, D., and Laugier, C. (2014). A survey
on motion prediction and risk assessment for intelli-
gent vehicles. ROBOMECH Journal, 1(1).
Liebner, M., Baumann, M., Klanner, F., and Stiller, C.
(2012). Driver intent inference at urban intersections
using the intelligent driver model. In IEEE Intelli-
gent Vehicles Symposium, pages 1162–1167, Alcal de
Henares , Madrid, Spain.
Meyer-Delius, D., Plagemann, C., von Wichert, G., Feiten,
W., Lawitzky, G., and Burgard, W. (2008). A Proba-
bilistic Relational Model for Characterizing Situations
in Dynamic Multi-Agent Systems. In Preisach, C.,
Burkhardt, H., Schmidt-Thieme, L., and Decker, R.,
editors, Data Analysis, Machine Learning and Appli-
cations, pages 269–276. Springer Berlin Heidelberg.
Morris, B. T. and Trivedi, M. M. (2011). Trajectory Learn-
ing for Activity Understanding: Unsupervised, Mul-
tilevel, and Long-Term Adaptive Approach. IEEE
Transactions on Pattern Analysis and Machine Intel-
ligence, 33(11):2287–2301.
Murphy, K. P. (2012). Machine Learning – A Probabilistic
Perspective. MIT Press.
Phillips, D. J., Wheeler, T. A., and Kochenderfer, M. J.
(2017). Generalizable intention prediction of human
drivers at intersections. In IEEE Intelligent Vehi-
cles Symposium, pages 1665–1670, Los Angeles, CA,
USA.
Quehl, J., Hu, H., Tas, O. S., Rehder, E., and Lauer, M.
(2017). How good is my prediction? Finding a simi-
larity measure for trajectory prediction evaluation. In
IEEE International Conference on Intelligent Trans-
portation Systems, pages 1–6, Yokohama.
Salvador, S. and Chan, P. (2007). FastDTW: Toward Ac-
curate Dynamic Time Warping in Linear Time and
Space. Intelligent Data Analysis, pages 561–580.
Schreier, M. (2015). Bayesian environment representation,
prediction, and criticality assessment for driver assis-
tance systems. PhD thesis, TU Darmstadt.
Schubert, R., Richter, E., and Wanielik, G. (2008). Com-
parison and Evaluation of Advanced Motion Models
for Vehicle Tracking. In International Conference on
Information Fusion, pages 1–6, Cologne.
Schulz, J., Hubmann, C., L
¨
ochner, J., and Burschka, D.
(2018). Multiple Model Unscented Kalman Filter-
ing in Dynamic Bayesian Networks for Intention Es-
timation and Trajectory Prediction. In IEEE Interna-
tional Conference on Intelligent Transportation Sys-
tems, pages 1467–1474, Maui, HI.
Schulz, J., Hubmann, C., Morin, N., L
¨
ochner, J., and
Burschka, D. (2019). Learning Interaction-Aware
Probabilistic Driver Behavior Models from Urban
Scenarios. In IEEE Intelligent Vehicles Symposium,
pages 1326–1333, Paris, France.
Streubel, T. and Hoffmann, K. H. (2014). Prediction of
driver intended path at intersections. In IEEE Intel-
ligent Vehicles Symposium, pages 134–139, MI, USA.
IEEE.
Tran, Q. and Firl, J. (2013). Modelling of traffic situations at
urban intersections with probabilistic non-parametric
regression. In IEEE Intelligent Vehicles Symposium,
pages 334–339, Gold Coast City, Australia.
Vasquez, D., Fraichard, T., and Laugier, C. (2009). In-
cremental learning of statistical motion patterns with
growing hidden Markov models. In IEEE Trans-
actions on Intelligent Transportation Systems 10(3),
pages 403–416.
Vintsyuk, T. K. (1972). Speech discrimination by dynamic
programming. Cybernetics, 4(1):52–57.
VEHITS 2020 - 6th International Conference on Vehicle Technology and Intelligent Transport Systems
310

Zhan, W., Sun, L., Wang, D., Shi, H., Clausse, A., Nau-
mann, M., K
¨
ummerle, J., K
¨
onigshof, H., Stiller, C.,
de La Fortelle, A., and Tomizuka, M. (2019). INTER-
ACTION Dataset: An INTERnational, Adversarial
and Cooperative moTION Dataset in Interactive Driv-
ing Scenarios with Semantic Maps. arXiv:1910.03088
[cs, eess].
Zhao, M. (2018). Modeling Driving Behavior at Single-
Lane Roundabouts. PhD thesis, TU Braunschweig.
Zhao, M., K
¨
athner, D., Jipp, M., S
¨
offker, D., and Lemmer,
K. (2017). Modeling driver behavior at roundabouts:
Results from a field study. In IEEE Intelligent Vehicles
Symposium, pages 908–913, Los Angeles, CA, USA.
Zheng, Y. (2015). Trajectory Data Mining: An Overview.
ACM Transactions on Intelligent Systems and Tech-
nology, 6(3):1–41.
Ziegler, J., Bender, P., Dang, T., and Stiller, C. (2014).
Trajectory planning for Bertha - A local, continuous
method. In IEEE Intelligent Vehicles Symposium Pro-
ceedings, pages 450–457, MI, USA.
Classification of Driver Intentions at Roundabouts
311
